Numerical simulations of winter cold damage to citrus fruits using the WRF model - adv-sci-res.net
←
→
Page content transcription
If your browser does not render page correctly, please read the page content below
18th EMS Annual Meeting: European Conference for Applied Meteorology and Climatology 2018
Adv. Sci. Res., 16, 1–6, 2019
https://doi.org/10.5194/asr-16-1-2019
© Author(s) 2019. This work is distributed under
the Creative Commons Attribution 4.0 License.

          Numerical simulations of winter cold damage to citrus
                      fruits using the WRF model
                                           Yukitaka Ohashi1 and Hideki Ueyama2
               1 Department  of Biosphere-Geosphere Science, Okayama University of Science, Okayama City,
                                                 Okayama, 700-0005, Japan
                   2 Western Region Agricultural Research Center, Zentsuji City, Kagawa, 765-0053, Japan

                                 Correspondence: Yukitaka Ohashi (ohashi@big.ous.ac.jp)

          Received: 3 November 2018 – Revised: 2 February 2019 – Accepted: 4 February 2019 – Published: 13 February 2019

       Abstract. To numerically assess winter cold damages of citrus fruits, a cold duration of sub-zero temperature
       was simulated using a high resolution configuration (500 m horizontal grid spacing) of the WRF numerical
       weather prediction system. Japanese citrus is often cultivated on slopes made of a small hill and a valley. Hence,
       a high resolution spatial configuration is needed to simulate cold durations at complex micro-topographies. In
       this study, detailed cold duration maps for sub-zero temperatures were produced to assess the spatial difference
       of cold duration, as an example of a winter cold surge attack in west Japan in 2011. Our findings suggest that the
       recorded temperature (by automatic observation of the Japan Meteorological Agency), which was observed at a
       flat coastal plain, may underestimate cold damage risk for citrus fruit on narrow slopes, valleys and hilly areas.

1   Introduction                                                   yields. Moreover, the global warming progress is likely to
                                                                   lead to a severe cold winter in mid-latitude Eurasian (Mori et
In Japan, a strong cold surge (cold air outbreak by a synoptic     al., 2014).
pressure pattern) in winters has often damaged citrus fruits          As many citrus orchards are locally spread and scattered
cultured in outdoor open fields, leading to a reduction in         on the slope sides of small hills and mountains in Japan,
yields (e.g., Nakagawa et al., 1965; Ikeda, 1982; Matsumoto        it is difficult to know how cold conditions affect actual or-
et al., 2018). An example of large-scale cold damage is the        chard fields. The outdoor surface air temperature is continu-
economic damage of JPY 750 million (EUR 6.1 million) re-           ously observed by the Japan Meteorological Agency (JMA),
ported in December 2005 in the west region of Ehime Prefec-        by their Automated Meteorological Data Acquisition System
ture which is a major production area of citrus fruits (Ehime      (AMeDAS). In fact, most AMeDAS observatories that are
Newspaper, 2005). This cold event induced a decrease in the        close to major produce regions of citrus fruits are located at
production yield exceeding 6000 t. In general, many citrus         lowland sites near the coast.
varieties are known as being vulnerable to sub-zero tempera-          A numerical weather prediction (NWP) model has been
ture conditions (e.g., Konakahara, 1984; Jackson, 1992; Inch       utilized for the purpose of understanding the spatial distribu-
et al., 2014). The past cold attacks from December to Febru-       tion of near-surface meteorological elements, such as wind
ary have caused freeze damage to citrus fruits and physiolog-      speed, air temperature, and humidity in numerous fields of
ical disorders of citrus rind, afflicting major Japanese citrus    study as well as agrometeorology. The NWP model output
farmers. Figure 1 shows a relationship between yearly yields       has the potential to evaluate the cold damage risk on complex
of lemon (Citrus limon) and “Iyokan” as Japanese name (Cit-        and micro-scale terrain. Hence, we examine an application of
rus iyo) against cold duration defined as integrated hours of      a high-resolution NWP model to quantitatively assess winter
sub-zero temperature. The yearly yield data in this figure         cold damages of citrus fruits.
was provided by the Ministry of Agriculture, Forestry and
Fisheries (MAFF) in Japan. As can be seen in this figure,
the long exposure of sub-zero temperature decreases citrus

Published by Copernicus Publications.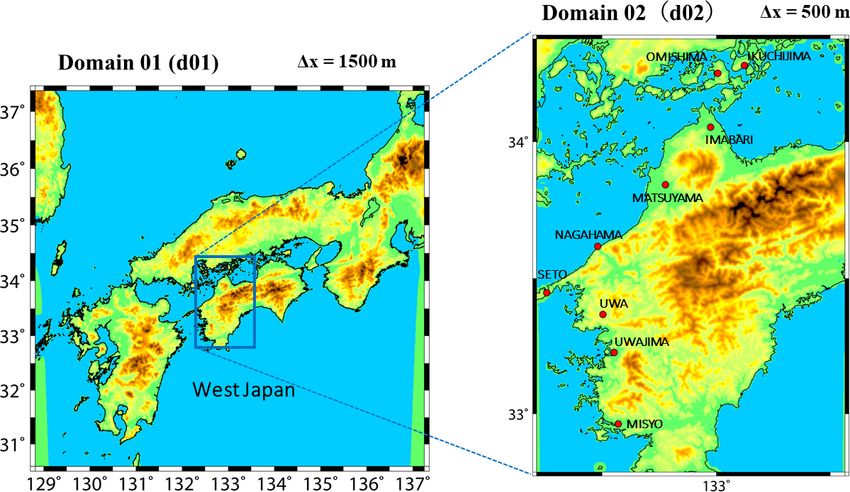
2                                      Y. Ohashi and H. Ueyama: Numerical simulations of winter cold damage to citrus fruits

Figure 1. Relationship between the annual cold duration (h) less than −1 ◦ C and citrus yield amount (ton per 1 ha) for (a) lemon (2003–2015)
and (b) Iyokan (2007–2015).

Figure 2. Calculation areas and geographies of coarse resolution (d01) and fine resolution (d02) domains.

2   Numerical model and calculation settings                             ysed from 09:00 JST on 15 January to 12:00 JST on 16 Jan-
                                                                         uary.
                                                                            Initial and boundary conditions of the model were as-
In this study, the Weather Research and Forecasting Model                signed by the National Centers for Environmental Predic-
(Ver. 3.8.1 of WRF-ARW; Skamarock et al., 2008) was used                 tion (NCEP, 2019) final analysis, JMA meso-analysis (JMA,
to simulate a field exposure of sub-zero temperature. A sim-             2019), and UKMO operational sea surface temperature and
ulation period from 15 to 16 January 2011, was chosen as an              ice analysis (OSTIA; Donlon et al., 2012) data every 3 h.
example of strong cold surge. Fruit (mainly citrus) damage               The land use (100 m resolution) and topographic data (50 m
amounts of 839 t (652 ha) were reported during the winter                resolution) of the Geospatial Information Authority of Japan
of this year in Ehime Prefecture (Official Statics of Japan,             (GIAJ, 2019) were used in the model. Data assimilation was
2012). Simulation domains included Ehime Prefecture in the               not carried out in this study.
west of Japan at which a citrus cold damage was reported by
Ehime Prefecture (2012). A coarse resolution was spatially
                                                                         3     Results and discussion
resolved at 1500 m, while the finer resolution was done at
500 m (Fig. 2). For a vertical resolution, stretched grids were
                                                                         3.1    Model validation
provided with the lowest height of 22 m up to 100 hPa. Our
model settings are summarized in Table 1. An initial time of             Figure 3 shows the simulated and actual observed cold dura-
calculation was set to 09:00 Japan Standard Time (JST) on                tions between −2 and −1 ◦ C, those between −3 and −2 ◦ C,
14 January 2011. The outputted data every 10 min were anal-              and those less than −3 ◦ C at Omishima, Seto, and Misyo sites

Adv. Sci. Res., 16, 1–6, 2019                                                                          www.adv-sci-res.net/16/1/2019/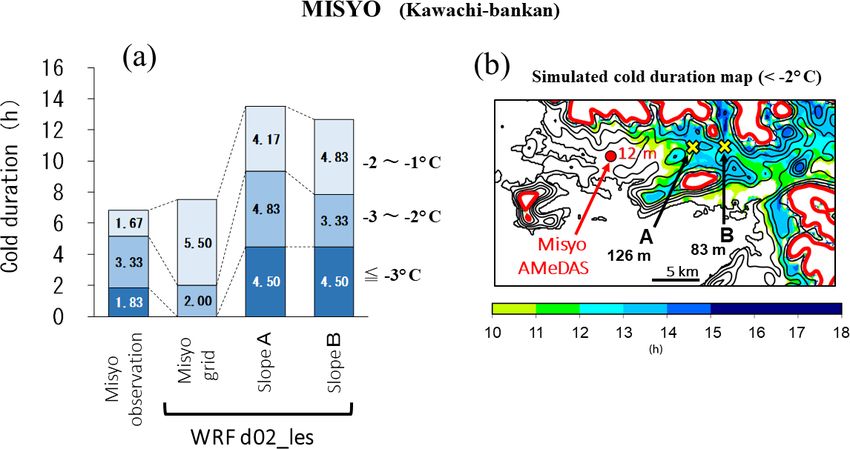
Y. Ohashi and H. Ueyama: Numerical simulations of winter cold damage to citrus fruits                                                   3

Table 1. Model setting of grids, boundary condition, and physics for d01 and d02.

                                                    d01_pbl (Domain 1)                    d02_les (Domain 2)
                  Horizontal grids                  1500 m                                500 m
                  Vertical grids                                        44, 67, 112, 121, 153, 194 m ...
                  The number of grids               500 (we) × 500 (sn) × 34 (vert)       250 (we) × 355 (sn) × 34 (vert)
                  Initial and boundary conditions    JMA Meso analysis (5 km) and UKMO OSTIA SST (0.05◦ ) data
                  Model top level                                                   100 hPa
                  Cloud microphysics                         Morrison double-moment (Morrison et al., 2009)
                  Radiations                                              Shortwave Dudhia (1989)
                                                                     Longwave RRTM (Mlawer et al., 1997)
                  Surface layer                                          Monin-Obukhov (Janjic Eta)
                  Land surface process                                            Noah LSM
                  Atmospheric boundary layer        PBL scheme of                         Large eddy simulation
                                                    Mellor-Yamada-Nakanishi-Niino         (full diffusion)
                                                    (Nakanishi and Niino, 2009)
                  Urban canopy                                                       None
                  Others                              One-way nesting, slope shadow effect, fog gravitational settling

Figure 3. Cold durations (h) recorded between −2 and −1 ◦ C, those between −3 and −2 ◦ C, and those less than −3 ◦ C at (a) Omishima,
(b) Seto, and (c) Misyo sites by the AMeDAS observation data, simulated d01, and d02 results.

(ref., each site location in Fig. 2). This cold duration was inte-       grid are 16, 86, and 15 m above sea level (a.s.l.), respectively.
grated during a period of the above-mentioned 09:00 JST on               Seto (Fig. 3b) altitudes of observational site, d01 grid, and
15 January–12:00 JST on 16 January. The Omishima area has                d02 grid are 140, 121, and 145 m a.s.l., respectively. Misyo
major citrus producers of lemon and Iyokan, while the Seto               (Fig. 3c) altitudes of observational site, d01 grid, and d02
area has major “Kiyomi” (Citrus unshiu × sinensis) produc-               grid are 17, 27, and 12 m a.s.l., respectively. The surface air
ers, and the Misyo area has “Kawachi-bankan” in Japanese                 temperature in the model is a value obtained at a height of
name (Citrus kawachiensis) producers. Figure 3 indicates the             2 m above ground level (a.g.l.), which is diagnostically esti-
calculation results at model grids, including the AMeDAS                 mated from the Bulk parameterisation for surface heat flux.
observational site in the d01 and d02 domains. Omishima                  The AMeDAS temperature is also measured at a height of
(Fig. 3a) altitudes of observational site, d01 grid, and d02             1.5 m a.g.l.

www.adv-sci-res.net/16/1/2019/                                                                             Adv. Sci. Res., 16, 1–6, 2019
4 Y. Ohashi and H. Ueyama: Numerical simulations of winter cold damage to citrus fruits
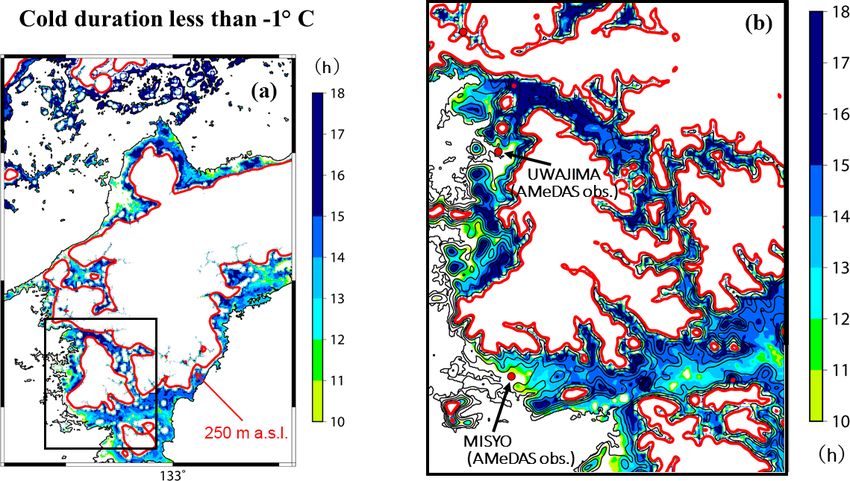
Figure 4. Simulated maps of cold duration (h) less than −1 ◦ C, which were produced for the (a) d02 entire domain and (b) enlarged rectangle
area in the left figure.
At the Seto area (Fig. 3b), the cold duration especially less which were located on the plain near the coast (as can be
than −3 ◦ C was well reproduced by both d01 and d02. Al- seen on the right-side figure), were estimated as having the
though there seems to be not a large difference between d01 shortest cold duration. The results suggest that temperatures
and d02 results at Seto and Misyo (Fig. 3c), a cold duration of observed by AMeDAS sites may underestimate the risk of
d02 at Omishima agreed with the observed that betters than cold damage for citrus fruit from the monitored temperature
that of d01 (Fig. 3a). This may be because the Omishima data.
site is located at the narrow valley of a small island. In fact, Figure 5a shows the cold durations simulated at slope grids
the d01 grid including the AMeDAS site has a significantly (A and B) in addition to the simulated and observed cold du-
higher altitude than those of the d02 grid and actual site and rations at the Misyo site on the plain. The Misyo AMeDAS
includes not only the narrow valley but also the surrounding site is located on at elevation of 12 m a.s.l., while elevations
hills. Therefore, a finer grid setting in the model is required of A and B are 126 and 83 m a.s.l., respectively, where citrus
for simulating cold meteorological conditions on complex cultivation fields spread (Fig. 5b). Simulated cold durations
micro-topographies, which will include narrow slopes, val- less than −3 ◦ C recorded 4.5 h at both slope grids. This ex-
leys, and hilly areas where citrus fruits are cultivated. treme cold condition was not simulated at the AMeDAS grid.
A relationship between air temperature observed at Misyo
site and the yearly yield of Kawachi-bankan in Ehime Pre-
3.2 Cold duration mapping
fecture was analysed in the same manner as Fig. 1. That re-
Here, calculated cold duration maps were produced to assess sult showed a yield decrease of 1.5 t ha−1 for recorded tem-
a spatial difference of cold duration less than −1 ◦ C, using peratures (at Misyo site) of less than −2 ◦ C for 10 h. The
the d02 output data (Fig. 4). As an example, a region includ- cold surge event also observed 5.2 h of temperatures less than
ing the Misyo site was focused on the right side of Fig. 4. −2 ◦ C at the Misyo AMeDAS. In this manner, visualizing a
These maps were drawn using the GMT software in which cold temperature by maps provides knowledge of a spatial
the tone mapping is interpolated by the bicubic method. In heterogeneity of cold risk for citrus fruits.
these figures, only areas less than 250 m a.s.l. were visualized
because of a cultivate elevation limit of citrus fruits. This was 4 Summary
achieved by using a land-use GIS map developed by the Min-
istry of Land, Infrastructure, Transport and Tourism (MLIT) In this study, winter cold damage of citrus fruits by cold surge
in Japan. The figure revealed that the cold duration tended attack was simulated using a high resolution configuration of
to be longer at the foot of mountains, whereas the areas in- the WRF NWP model. Japanese citrus is often cultivated on
cluding the AMeDAS observatories of Misyo and Uwajima, slope lands with a small hill and valley. Here, detail cold du-
Adv. Sci. Res., 16, 1–6, 2019 www.adv-sci-res.net/16/1/2019/Y. Ohashi and H. Ueyama: Numerical simulations of winter cold damage to citrus fruits 5
Figure 5. (a) Cold durations (h) observed at the Misyo AMeDAS site and simulated at the grids including the AMeDAS site, slope A, and
slope B. (b) Simulated cold duration map (with temperature less than −2 ◦ C) and locations of AMeDAS, slope A, and slope B.
ration maps for sub-zero temperatures were produced to sim- Acknowledgements. Input data of the WRF was arranged and
ulate a spatial heterogeneity of cold duration in west Japan provided by Teruo Osawa in Kobe University, Japan. This study
during the winter of 2011. The simulation results demon- was supported by JSPS KAKENHI Grant-in Aid for Scientific
strated that the temperature measured at AMeDAS sites at Research (C) number 16K07963. The Generic Mapping Tools
coastal locations underestimated the risk of cold damage for (GMT) graphics system (Wessel and Smith, 1998) was used for
drawing some figures.
cultivated citrus fruits on narrow slopes, valleys, and hilly
areas. This fact suggests a necessity for a numerical me-
Edited by: Keith Lambkin
teorological model for predicting cold damage, which can Reviewed by: two anonymous referees
resolve complex micro-topographies where citrus fruits are
cultivated. A higher resolution configuration such as of 100–
200 m may improve the accuracy of the sub-zero temperature References
maps further.
Dudhia, J.: Numerical study of convection observed during the
winter monsoon experiment using a mesoscale two-dimensional
Data availability. Data are available via e-mail request to the cor- model, J. Atmos. Sci., 46, 3077–3107, 1989.
responding author. Donlon, C. J., Martin, M., Stark, J. D., Roberts-Jones, J., Fiedler, E.,
and Wimmer, W.: The operational sea surface temperature and
sea ice analysis (OSTIA) system, Remote Sens. Environ., 116,
Author contributions. HU provided the idea and motivation of 140–158, 2012.
this study and YO carried it out. YO performed the simulations and Ehime Newspaper: Ehime Newspaper Database, available at: http://
prepared the manuscript. www.ehime-np.co.jp/pr/db/ (last access: 3 January 2019), article
in 2005.
Ehime Prefecture: Kankitsu-kajitsu no Kangai to Shizai niy-
Competing interests. The authors declare that they have no con- oru Kangai-boushi-kouka, Hukyu dayori, 1, 5–5, avail-
flict of interest. able at: https://www.pref.ehime.jp/nan99909/seiyo/documents/
hp23fukyuudayori_1.pdf (last access: 3 January 2019), 2012 (in
Japanese).
GIAJ (Geospatial Information Authority of Japan): National Land
Special issue statement. This article is part of the special issue
Numerical Information download service, available at: http://
“18th EMS Annual Meeting: European Conference for Applied Me-
nlftp.mlit.go.jp/ksj-e/index.html, last access: 3 January 2019.
teorology and Climatology 2018”. It is a result of the EMS Annual
Ikeda, I.: Freeze injury and protection of citrus in Japan, Plant cold
Meeting: European Conference for Applied Meteorology and Cli-
hardiness and freezing stress: mechanisms and crop implications,
matology 2018, Budapest, Hungary, 3–7 September 2018.
Academic Press, Inc., New York, 575–590, 1982.
www.adv-sci-res.net/16/1/2019/ Adv. Sci. Res., 16, 1–6, 20196 Y. Ohashi and H. Ueyama: Numerical simulations of winter cold damage to citrus fruits Inch, S., Stover, E., Driggers, R., and Lee, R.: Freeze response of Nakagawa, Y., Konakahara, M., and Sumida, A.: Studies on the citrus and citrus-related genotypes in a Florida field planting, climatically favourable place for fruit culture (2) Responses of HortScience, 49, 1010–1016, 2014. fruits to freezing temperature in Citrus natsudaidai, J. Agr. Met., Jackson, L. K.: Cold damage symptoms on citrus, University of 21, 47–52, 1965. Florida Institutional Repository, available at: http://ufdc.ufl.edu/ Nakanishi, M. and Niino, H.: Development of an improved turbu- IR00004614/00001 (last access: 3 January 2019), 1992. lence closure model for the atmospheric boundary layer, J. Me- JMA (Japan Meteorological Agency) meso analysis: Joint WMO teorol. Soc. Jpn, 87, 895–912, 2009. technical progress report on the global data processing and fore- NCEP (National Centers for Environmental Prediction/National casting system and numerical weather prediction research activ- Weather Service/NOAA/U.S. Department of Commerce): NCEP ities for 2017, available at: http://www.jma.go.jp/jma/jma-eng/ FNL Operational Model Global Tropospheric Analyses, contin- jma-center/nwp/report/2017_Japan.pdf, last access: 3 January uing from July 1999, Research Data Archive at the National 2019. Center for Atmospheric Research, Computational and Informa- Konakahara, M.: Cold injuries on citrus trees and the practical man- tion Systems Laboratory, https://doi.org/10.5065/D6M043C6, agement for their protection, J. Agr. Met., 39, 315–322, 1984 (in last access: 3 January 2019. Japanese). Official Statics of Japan (e-Stat): Statistics of Japan, available at: Matsumoto, K., Okumura, R., Shinomiya, R., and Muramoto, K.: https://www.e-stat.go.jp/ (last access: 3 January 2019), 2012. Differences in Freezing Resistance of Citrus Varieties in Nursery Skamarock, W. C., Klemp, J. B., Dudhia, J., Gill, D. O., Barker, D. Stocks based on Data Obtained during a Cold Snap in 2016, Bull. M., Duda, M. G., Huang, X.-Y., Wang, W., and Powers, J. G.: Fukuoka Agric. Res. Cent., 4, 122–128, 2018. A description of the advanced research WRF version 3, NCAR Mlawer, E. J., Taubman S. J., Brown, P. D., Iacono, M. J., and Tech. Note NCAR/TN-475+STR, 113 pp., 2008. Clough, S. A.: Radiative transfer for inhomogeneous atmo- Wessel, P. and Smith, W. H. F.: New, improved version of the sphere: RRTM, a validated correlated-k model for the longwave, generic mapping tools released, EOS T. Am. Geophys. Un., 79, J. Geophys. Res., 102, 16663–16682, 1997. p. 579, 1998. Mori, M., Watanabe, M., Shiogama, H., Inoue, J., and Kimoto, M.: Robust Arctic sea-ice influence on the frequent Eurasian cold winters in past decades, Nat. Geosci., 7, 869–873, 2014. Morrison, H., Thompson, G., and Tatarskii, V.: Impact of cloud mi- crophysics on the development of trailing stratiform precipitation in a simulated squall line: comparison of one and two-moment schemes, Mon. Weather Rev., 137, 991–1006, 2009. Adv. Sci. Res., 16, 1–6, 2019 www.adv-sci-res.net/16/1/2019/
You can also read