Modeling of Gasoline Direct Injection Mixture Formation Us- ing KIVA-3V: Development of Spray Breakup & Wall Im- pingement Models and Validation ...
←
→
Page content transcription
If your browser does not render page correctly, please read the page content below
Modeling of Gasoline Direct Injection Mixture Formation Us-
   ing KIVA-3V: Development of Spray Breakup & Wall Im-
 pingement Models and Validation with Optical Engine Planar
         Laser Induced Fluorescence Measurements.

          *B. P. Vanzieleghem, C. A. Chryssakis, R. O. Grover, V. Sick, H. G. Im,
                                    and D. N. Assanis

                                    W.E. Lay Automotive Laboratory
                      Department of Mechanical Engineering, University of Michigan
                              1231 Beal Ave., Ann Arbor, MI 48105, U.S.A.

                          Key Words: Gasoline, Injection, Modeling, Optical, Laser

                                                    ABSTRACT
     The computational code KIVA-3V has been used as the modeling platform for Gasoline Direct Injection engine
simulations. Improved models for fuel injection, wall impingement and stratified combustion have been implemented.
To complement the modeling effort, experimental data of an optical engine has provided extensive data for validating
the new models. The experimental data include Planar Laser Induced Fluorescence measurements, of the injection,
mixing and combustion events in an optical engine. In this work, focus is given on fuel injection, wall impingement and
air-fuel mixing.

INTRODUCTION                                                   under constant temperature and pressure conditions, in
    The design of more powerful, fuel-efficient, and en-       constant-volume vessels (bombs). These experimental
vironmentally friendly gasoline engines is currently one       set-ups allow for highly accurate measurements with
of the main goals of engine researchers. With the advent       laser diagnostics methods and offer precious insight on
of increasingly stringent fuel consumption and emissions       the physical phenomena occurring during injection and
standards, engine manufacturers face the challenging           wall impingement. However, in an engine environment,
task of delivering conventional vehicles that abide by         temperature and pressure conditions are continuously
these regulations. Many automotive manufacturers are           varying, presenting an additional challenge for the mod-
responding to the challenge of developing highly effi-         els. Therefore, it is important to validate these models
cient, Ultra Low Emission Vehicles (ULEV's) by devel-          against measurements acquired in optical engines con-
oping Gasoline Direct Injection (GDI) systems [1-7].           figurations. Han et al. [8-9] have presented comparisons
Controlling the mixture formation of a GDI engine under        of optical measurements with spray evolution and fuel
a wide range of engine operating conditions is essential       vapor distribution calculations for stratified operating
to reduce smoke and particulate generation and optimize        conditions; however, there exists a void in the literature
fuel economy. A valuable tool for understanding and            for this type of study at early injection timings. In the
controlling the mixture formation is the combination of        current work, focus is given on coupling the individual
optical diagnostics with Computational Fluid Dynamics          models for fuel injection, wall impingement and com-
(CFD) simulations of the in-cylinder processes.                bustion and validate them under homogeneous engine
                                                               operation, achieved by early fuel injection.
    In order to perform reliable CFD simulations of a
GDI engine, appropriate models for fuel injection, mix-            The submodels developed for fuel injection, spray
ing and combustion are required. Accurate predictions of       breakup and wall impingement have been extensively
the air-fuel mixing process are critical in order to provide   validated against optical diagnostics experiments [10-13]
correct initial conditions for the combustion modeling. It     and will be briefly described here. The validation was
is common practice to validate fuel injection and wall         performed with data acquired under atmospheric condi-
impingement models against experimental data acquired          tions and should apply to early injection timings in a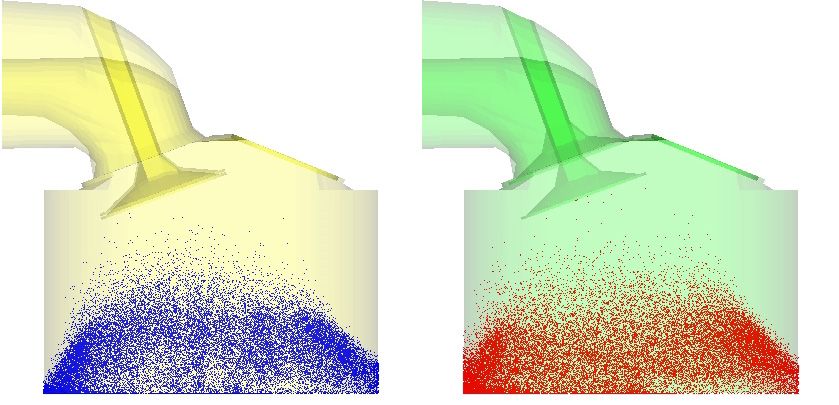
GDI engine. Subsequently, comparison with Planar Laser
Induced Fluorescence (PLIF) measurements from an
optical single-cylinder engine will be presented to dem-
onstrate the predictive capability of the models. In a later
study, these models are coupled to a combustion model
applicable for both stratified and homogeneous operation
[14].

EXPERIMENTAL SETUP
     The experimental setup consists of a single-cylinder,
four stroke GDI engine with a four valve head, featuring
full optical access, variable swirl [15] and dimensions as
given in Table 1. The spark plug is located on the exhaust           Fig. 1: View of the computational grid for the
side of the combustion chamber, while the injector is                                optical engine
located on the intake side. The optical access is achieved
by a quartz window in both the piston and pent roof of         engine. To generate the swirl, one of the valves is deac-
the engine, combined with a quartz cylinder. The piston        tivated completely.
window is smaller than the engine bore, giving optical
access to part of the engine’s volume. The swirl is varied     Fuel Injection Model
by restricting the airflow through one of the two intake            A comprehensive model for sprays emerging from
valves.                                                        high-pressure swirl injectors has been developed, ac-
                                                               counting for both primary and secondary atomization
              Table 1: Optical Engine Geometry
                                                               [10-11]. The model considers the transient behavior of
         Connecting Rod                159 mm                  the pre-swirl spray and the steady-state behavior of the
                                                               main spray. The pre-swirl spray modeling is based on an
         Bore                           86 mm
                                                               empirical solid-cone approach with varying cone angle.
         Stroke                         86 mm                  First, a solid-cone-like injection is performed, represent-
                                                               ing the pre-swirl spray. The cone angle is gradually in-
         Clearance Volume              49.9 cm3
                                                               creased, using a linear profile. At the transition point, the
         Displacement                 499.15 cm3               code switches into a hollow-cone structure, while the
                                                               cone angle is still increasing, until the steady-state value
         Compression Ratio                11.0                 is reached.
         Optical Piston Window          55 mm                       The primary breakup approach adopted here for the
                                                               main spray is based on the Linearized Instability Sheet
         Intake Temperature              45o C                 Atomization (LISA) model [17-18], with appropriate
         Intake Pressure                45 kPA                 extensions to include a swirl velocity component. A
                                                               Rosin-Rammler cumulative distribution is used for cal-
                                                               culating the droplet size. For the secondary droplet
    A laser induced fluorescence (LIF) technique, with         breakup the TAB model [19] is being used both for the
Toluene as a tracer added to the fuel (iso-octane), has        pre-swirl and the main spray, with its baseline constants.
been used to provide visualization of the fuel-injection,
mixing and combustion processes [15]. The LIF signal           Wall Impingement Model
was calibrated by taking images of early injection events           A wall impingement model, developed by Grover et
90o after top-dead-center (ATDC), at which point the fuel      al. [12-13] has been used to improve the prediction capa-
had sufficient time to mix and evaporate to create a ho-       bility of spray-wall interactions. The model conserves
mogeneous, gaseous fuel-air mixture. Dependence of the         mass, tangential momentum and energy of an impinging
toluene signal on fuel concentration, laser energy and gas     parcel. This model focuses on spray impact on dry and
temperature was corrected for in the measurements.             wet surfaces below the fuel’s Leidenfrost temperature, a
                                                               scenario encountered under typical engine operating
                                                               conditions [20].
COMPUTATIONAL FRAMEWORK                                             Three splashing parcels and one wallfilm parcel are
For the numerical simulations performed in this work a         used to represent the shattering of a splashing droplet
modified version of the Los Alamos KIVA-3V code [17]           upon impact with the surface. It is assumed that the im-
has been used. The modifications include the fuel injec-       pulsive force on an impinging droplet normal to the sur-
tion model, the wall impingement model and the Coher-          face is dominant allowing one to treat the magnitude of
ent Flame Combustion model [14]. The computational             its tangential momentum component constant after im-
mesh consists of approximately 70,000 cells. An image          pact. The viscous dissipation of an impinging droplet and
of the grid showing the intake and exhaust ports is shown      kinetic energy of the wallfilm are accounted for in the
in Figure 1. The adopted mesh has been found to gener-         energy conservation equation.
ate a swirl behavior very similar to that in the optical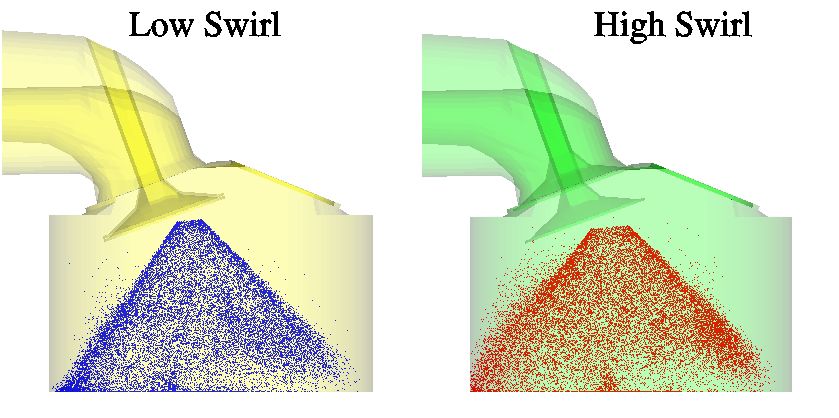
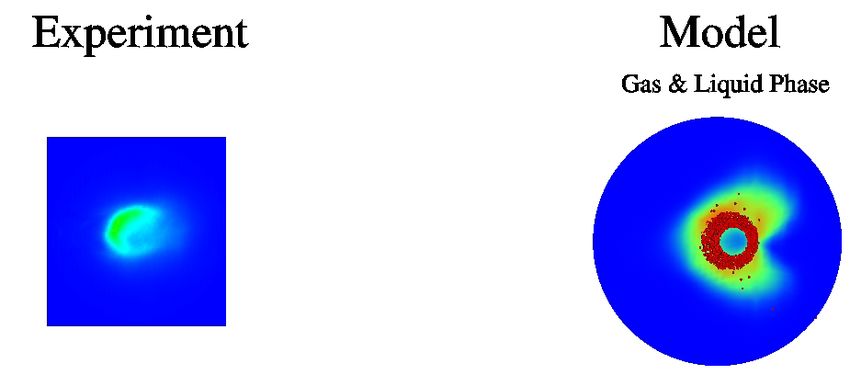
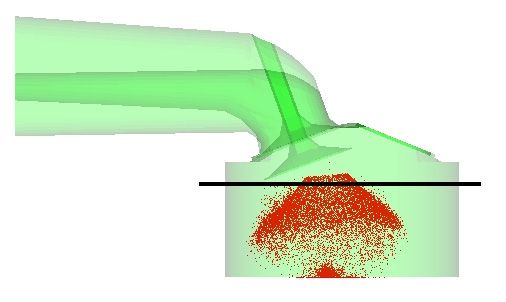
COMPARISON WITH EXPERIMENTS                                  sen here for validation purposes is located eight millime-
                                                             ters below the firing deck, as seen in Figure 3. Figure 4
Cylinder Charge Air Motion                                   shows the comparison of the modeled spray and the ex-
    Figure 2 shows the velocity field in a horizontal sec-   perimental visualization on the same geometrical scale,
tion 1 mm below the firing deck of the engine (the firing    for the 2000 rpm, low swirl case. The modeled spray
deck is defined as the location where the head and cylin-    shows both the equivalence ratio of the evaporated fuel
der meet), at spark timing (340° CA). A more organized       and the fuel droplets in liquid form, while the experiment
flow structure, with a counter-clockwise swirl, can be       was setup to visualize the liquid core of the spray. It can
observed in the high swirl case. The low swirl case does     be seen from the comparison that the liquid droplet dis-
not exhibit an obvious swirling motion, and the velocity     tribution of the model is in good agreement with the ob-
magnitudes are slightly lower, shown by the shorter ve-      served spray from the experiments. The radius of the
locity vectors. The low and high swirl conditions corre-     liquid spray corresponds to the spray radius observed in
spond to experimentally measured swirl numbers of 0.8        the experiments, and the timing of when the spray has
and 5.5 respectively.                                        passed the plane agrees with the experiments, as can be
                                                             seen in the image for 97o CA. The experimental observa-
                                                             tion does suffer from an attenuation of the laser beam as
                                                             the spray is being traversed. The gaseous fuel distribu-
                                                             tion seen in the model, however, is not observed in the
                                                             experiments.

                                                                         8mm

                                                                        Fig. 3: Location of the laser sheet.

                                                                                      82o CA

                                                                                      88o CA

  Fig. 2: Comparison of the velocity vectors for the low
 and high-swirl case, 2000 rpm (viewed from below, in-
        take valves on left side, exhaust on right).
                                                                                      97o CA
Fuel Injection Comparison
    The fuel injection and mixing process were validated
against LIF spray images and spray vaporization rates.
The simulated and experimental results were in good
agreement and lead us to believe that the boundary con-
ditions were adequate for an assessment of the combus-
tion model.                                                  Fig. 4: Comparison of experimental and modeled spray,
    The spray images obtained with the LIF technique         low swirl, 2000 rpm, crank angles 82° - 88°, during the
were taken at different horizontal planes. The plane cho-                        intake stroke.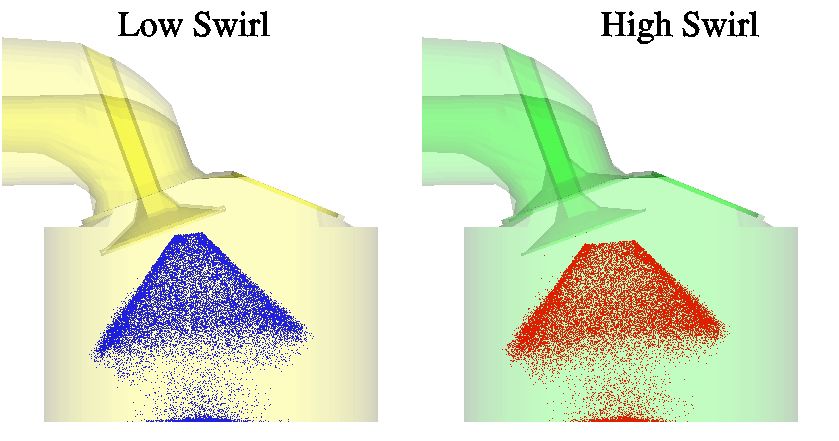
Aside from the above visual comparison of the When the experimental results for the fuel concentra-
simulation and the experiments, a number of the qualita- tion were spatially averaged in the field of view plane 1
tive experimental observations were found to be repro- mm above the firing deck, the high swirl case, for both
duced in the simulation. For the 2000 rpm case, it was 600 and 2000 rpm, resulted in a leaner equivalence ratio
observed in the experiments that the spray evaporates [15]. Since the fueling was set to yield an overall equiva-
faster for the high swirl operation [15]. In addition, the lence ratio of 1.0, it was conjectured that rich regions had
spray was shifted to the left of the cylinder geometry in to be present elsewhere in the combustion chamber. In-
the high swirl case at 2000 rpm. Furthermore, it was vestigation of the other elevations did not reveal these
conjectured that rich regions should be present at the rich regions, leading to the conclusion that rich areas
periphery of the cylinder, where optical access was not must occur outside the field of view of the laser imaging,
possible for the high swirl cases at both 600 and 2000 at the periphery of the cylinder where optical access was
rpm. This conclusion was reached after spa- not possible. Figure 9 shows the fuel distribution at the
tially-averaging the equivalence ratio in a plane 1 mm time of spark, which corresponds to the timing of the
above the firing deck, and achieving an equivalence ratio experimental image that was spatially averaged to deter-
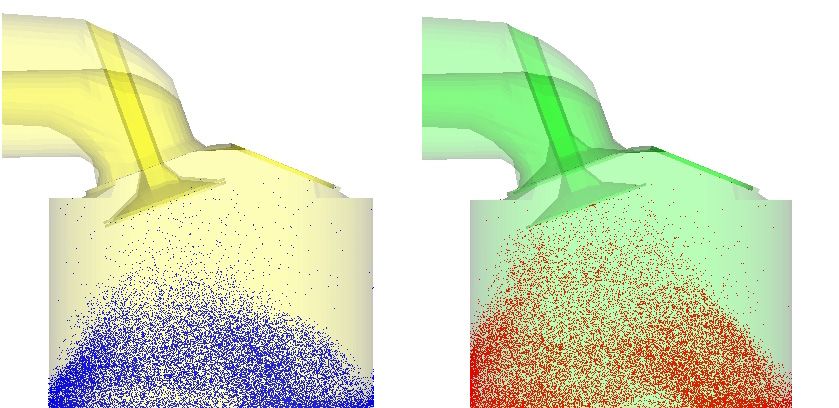
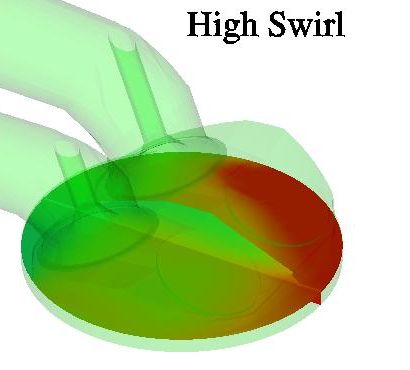
lower than one for the high swirl cases. Figure 5 shows mine the overall equivalence ratio. From the images, it is
the modeling prediction of the spray plume for the high clear that a significant amount of fuel can be found at the
and low swirl, 2000 rpm, operating point during the in- periphery of the combustion chamber for the high swirl
jection process. A careful observation of the images re- case, which further supports the experimental observa-
veals that the spray is pulled to the intake side of the en- tions.
gine for the high swirl operation, consistent with the ex-
perimental observation. For the result at 94° CA, the
spray hits the cylinder liner in a higher location for the
high swirl case compared to the low swirl case. For the
600 rpm case, the difference between both sprays for the
high and low swirl case was less pronounced, but the
high swirl condition still shows a movement towards the
intake side of the combustion chamber, as seen in Figure
6. Figures 7 and 8 show the evaporation rate of the drop-
lets for the 600 and 2000 rpm cases. It is clear that for
the 2000 rpm, high swirl case, the evaporation proceeds
at a faster rate than for the low swirl case. For the 600
rpm operating point, the difference between the low and CA=88o
high swirl operation is less significant.
CA=91o
Fig. 6: Comparison of the modeled spray for the low and
high swirl case at 600 rpm.
CA=82o
CONCLUSIONS
To accurately simulate GDI engine operation under
homogeneous chare conditions, a set of computational
models, including fuel injection, wall impingement and
stratified combustion, has been developed and imple-
mented in to KIVA-3V. To validate the results of the fuel
injection and air-fuel mixing modeling, comparisons of
all the engine processes were performed with experi-
ments on a single-cylinder optical GDI engine. Agree-
CA=94o ment between the model and the experimental results
was shown to be very good.
Fig. 5: Comparison of the modeled spray for the low
and high swirl case at 2000 rpm.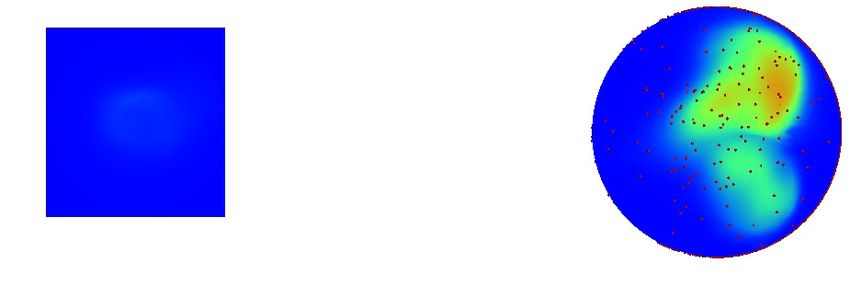
4
                     3 10

                                                                    Low Swirl - 2000 RPM
                                                                    High Swirl - 2000 RPM
                            4
                    2.5 10

                            4
                     2 10
Number of Parcels

                            4
                    1.5 10

                            4
                     1 10

                     5000

                         0
                                50        100            150              200               250

                                                      Crank Angle

Fig. 7: Comparison of evaporation rate for the 2000 rpm
               low and high swirl cases.
                            4
                     3 10

                                                                    Low Swirl - 600 RPM
                                                                    High Swirl - 600 RPM
                            4
                    2.5 10

                            4
                     2 10
Number of Parcels

                            4
                    1.5 10

                            4
                     1 10

                     5000

                         0
                                80   90   100   110      120        130   140     150       160

                                                      Crank Angle
                                                                                                  Fig. 9: Comparison of equivalence ratio distribution for
                                                                                                           the 2000 rpm low and high swirl cases.
     Fig. 8: Comparison of evaporation rate for the 600 rpm
                   low and high swirl cases.

REFERENCES                                                                                        [5] Tomoda, T., Sasaki, S., Sawada, D., Saito, A., and
[1] Kume, T., Iwamoto, Y., Iida, K., Murakami, M., Aki-                                                Sami, H., “Development of Direct Injection Gasoline
    shino, K., and Ando, A., “Combustion Control Tech-                                                 Engine - Study of Stratified Mixture Formation”,
    nologies for Direct Injection SI Engine”, SAE Paper                                                SAE Paper 970539, 1997
    960600, 1996                                                                                  [6] Wurms, R., Grigo, M., Hatz, W., “Audi FSI technol-
[2] Iwamoto, Y., Noma, K., Nakayama, O., Yamauchi, T.,                                                ogy ~ Improved performance and reduced fuel con-
    and Ando, H., “Development of Gasoline Direct In-                                                 sumption”, SAE Paper 2002-33-002, 2002
    jection Engine”, SAE Paper 970541, 1997                                                       [7] Borgmann, K., Liebl, J., Hofmann, R., Schausberger,
[3] Kuwahara, K., Ueda, K., and Ando, H., “Mixing con-                                                C., Schwarzbauer, G., “The innovative V12 power-
    trol Strategy for Engine Performance Improvement in                                               train for the new 7 Series”, SAE Paper 2003-08-0202,
    a Gasoline Direct Injection Engine”, SAE Paper                                                    2003
    980158, 1998                                                                                  [8] Han Z., Xu Z., Wooldridge S., Yi J., Lavoie
[4] Harada, J., Tomita, T., Mizuno, H., Mashiki, Z., and                                              G., ”Modeling of DISI Engine Sprays with Compari-
    Ito, Y., “Development of Direct Injection Gasoline                                                son to Experimental In-Cylinder Spray Images”, SAE
    Engine”, SAE Paper 970540, 1997                                                                   Paper 2001-01-3667, 2001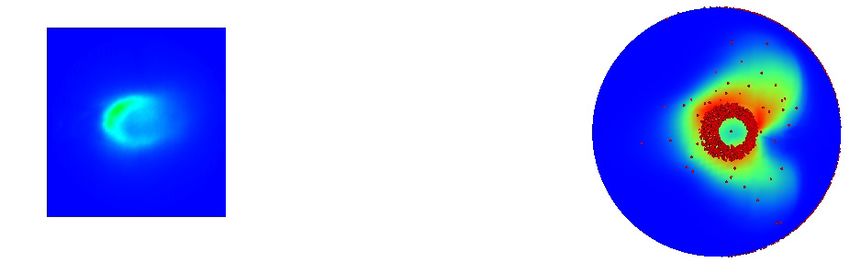
[9] Han Z., Weaver C., Wooldridge S., Alger T., Hilditch     [14] B.P. Vanzieleghem, V. Sick, H. G. Im and D.N. As-
    J., McGee J., Westrate B., Xu Z., Yi J., Chen X.,           sanis, “Modeling of Gasoline Direct Injection Com-
    Trigui N., Davis G., “Development of a New Light            bustion using KIVA-3V: Development of an Ex-
    Stratified-Charge DISI Combustion System for a              tended Coherent Flamelet Model and Validation with
    Family of Engines with Upfront CFD Coupling with            Optical Engine Planar Laser Induced Fluorescence
    Thermal and Optical Engine Experiments”, SAE Pa-            Measurements”, COMODIA 2004, Yokohama, Japan,
    per 2004-01-0545, 2004                                      August 2004
[10] Chryssakis, C. A., Driscoll, K. D., Sick, V. Assanis,   [15] Frieden, D., Sick, V., “Investigation of the fuel in-
    D. N., “Validation of an Enhanced Liquid Sheet At-          jection, mixing and combustion processes in an SIDI
    omisation Model Against Quantitative Laser Diag-            engine using quasi-3D LIF imaging,” SAE Paper
    nostic Measurements”, 18th Annual Conference on             2003-01-0068, 2003
    Liquid Atomization and Spray Systems, Zaragoza,          [16] Amsden, A.A., “KIVA-3V, Release 2, Improvements
    Spain, September 2002                                       to KIVA-3V”, LA-13608-MS, May 1999
[11] Chryssakis, C.A., Assanis, D. N., Lee, J., Nishida,     [17] Schmidt, D.P., Nouar, I., Senecal, P.K., Rutland, C.J.,
    K., “Fuel Spray Simulation of High-Pressure                 Martin, J.K., Reitz, R.D., “Pressure-Swirl Atomiza-
    Swirl-Injector for DISI Engines and Comparison with         tion in the Near Field”, SAE Paper 1999-01-0496,
    Laser Diagnostic Measurements”, SAE Paper                   1999
    2003-01-0007, March 2003                                 [18] Senecal, P.K., Schmidt, D.P., Nouar, I., Rutland, C.J.,
[12] Grover, R.O., Assanis, D.N., “A Spray Wall Im-             Reitz, R.D., Corradini, M.L., “Modeling High-Speed
    pingement Model Based Upon Conservation Princi-             Viscous Liquid Sheet Atomization”, Int. J. of Multi-
    ples,” Fifth International Symposium on Diagnostics         phase Flow, 25, pp. 1073-1097, 1999
    and Modeling of Combustion in Internal Combustion        [19] O’Rourke P.J., Amsden, A.A., “The TAB Method
    Engines, pp. 551-559, 2001                                  for Numerical Calculation of Spray Droplet Breakup”,
[13] Grover, R.O., Assanis, D.N., Lippert, A.M., El Tahry,      SAE Technical Paper 872089, 1987
    S.H., Drake, M.C., Fansler T.D., Harrington D.L., “A     [20] Han, Z., Xu, Z., Trigui, N., “Spray/Wall Interaction
    Critical Analysis of Splash Criteria for GDI Spray          Models for Multidimensional Engine Simulation”,
    Impingement”, 15th Annual Conference on Liquid              International     Journal    of   Engine      Research
    Atomization and Spray Systems, Madison, WI, May             1(1):127-146, 2000
    2002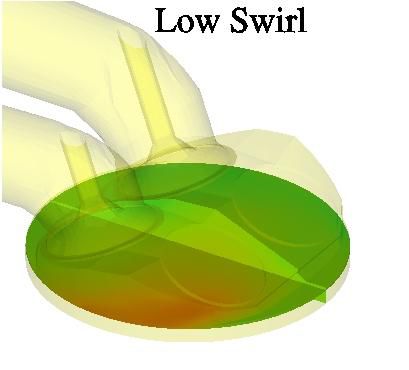
You can also read