Changi plans: building before they come - connecting the world of travel - International Airport Review
←
→
Page content transcription
If your browser does not render page correctly, please read the page content below
connecting the
world of travel

      Changi plans: building
      before they come
Changi plans: building before they come

    Contents
    Singapore Changi plans for doubling capacity                  3
    Building before they come                                     4
    State of play                                                 5
    Evolution of an airport network                               8
    Four brands – one strategy                                   11
    Prospects of growth                                          14
    Something special                                            15
    Good planning?                                               17

2   © 2016 OAG Aviation Worldwide Limited. All rights reserved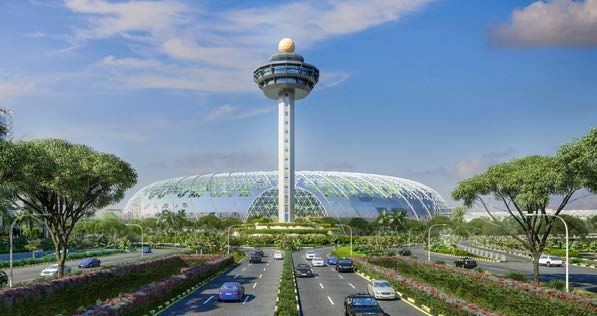
Singapore Changi plans for
doubling capacity
Yet again passengers have voted Singapore Changi Airport the World’s
Best Airport, according to the 2016 SkyTrax awards. The airport has a
well-earned reputation for making the passenger experience as good as
it can and it’s no surprise that passengers whose travel plans require a
connection have been choosing to connect at Changi for years.

Part of the success comes down to good planning. Singapore Airport
has a track record of planning for future needs, building ahead of the
demand curve and delivering a quality product for passengers and airlines.
Passenger numbers have climbed to 54 million passengers per annum
(mppa) while terminal capacity is comfortably ahead of that at 66 mppa.

However in recent years, Singapore’s position as the long-haul connecting
airport of choice has been challenged by rival hubs, in particular Dubai,
and more recently Istanbul. Upon completion, Dubai’s World Central
Airport will be able to handle up to 240m passengers and the new Istanbul
Airport will have capacity for 150m when it opens in 2018. So, as Changi
announces plans to build capacity to allow it to handle 135m passengers
annually, more than double the number passing through the airport today,
we take a closer look at where this traffic might come from. While no-one
expects Changi to develop infrastructure on the basis of ‘build it and they
will come’, the case for a doubling of traffic seems less certain than it
might have done a few years ago.

In this report we analyse the profile of current traffic and draw on OAG
data to understand how traffic might be expected to grow over the next 5
to 10 years in order to understand where future growth will come from.

                                                                              3
Changi plans: building before they come
Building before they come
The three terminals at Singapore Changi have capacity for 66 million
passengers. This is 7 million fewer than a few years ago since the budget
terminal was demolished in 2013 to make room for the new T4, due to
come on-stream in 2017.
SINGAPORE CHANGI AIRPORT – TRAFFIC VS CAPACITY
160 + T5
Mid 2020’s
140
30-50m
120 +T4
2017
100 + T3
Millions
+budget - budget 16m
80 terminal 22m
T1 & T2 terminal
60 21m & 23m 7m
40
20
0
1997
1998
1999
2000
2001
2002
2003
2004
2005
2006
2007
2008
2009
2010
2011
2012
2013
2014
2015
2016
2017
2018
2019
2020
2021
2022
2023
2024
2025
Terminal capacity Passengers
Source: Statistics Singapore, Singapore Changi Airport
The past 10 years have seen traffic at Singapore grow by an average of
5.5% per annum. Another 10 years of growth like this takes traffic to 95m
passengers, a long way short of the capacity T5 is expected to deliver.
Projecting forward, however, is tricky. Passenger bookings for travel to
and from SIN grew by a more modest 2.7% last year. At that rate the new
infrastructure would not fill until close to 2050. In contrast, the first two
months of 2016 saw bookings grow by 9.6%. If passenger growth at SIN
continued at that rate the airport would reach capacity by 2025.
CAPACITY REQUIRED AT SINGAPORE CHANGI AIRPORT – UNDER DIFFERENT
GROWTH SCENARIOS
160
140 +9.6% p.a. +5.5% p.a. +4.2% p.a. +2.7% p.a.
Capacity Required
120
100
80
60 Sched airline
seats grew by
40
Average 4.2% in first
20 Bookings grew by 9.6% passenger growth 6 months of Bookings grew by 2.7%
in first 2 months of 2016 last 10 years 2016 in 2015
0
2016
2017
2018
2019
2020
2021
2022
2023
2024
2025
2026
2027
2028
2029
2030
2031
2032
2033
2034
2035
2036
2037
2038
2039
2040
2041
2042
2043
2044
2045
2046
2047
2048
2049
2050
analyser
Source:
4 © 2016 OAG Aviation Worldwide Limited. All rights reserved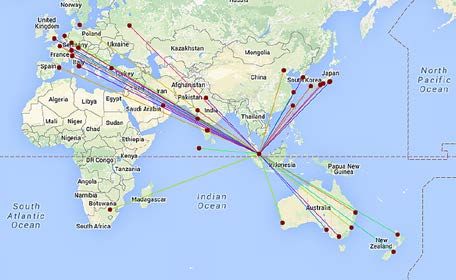
Whilst by no means certain, a more appropriate measure is typically
average growth over recent years. Changi has been growing at an average
of 5.5% per annum for the last 10 years so it could be more likely that the
airport will be reaching the new capacity around 2032. Certainly it appears
that some additional capacity will be required by the mid-2020s, and
assuming the new capacity will be phased in over time, the scale of the
proposed developments appears prudent.

State of play
On top of the potential gap between projected capacity and the demand
trend, the rate of traffic growth may be slowing. Annual scheduled capacity
at Singapore Changi Airport (SIN) was 74.1m seats in 2015, up 1.7% on
the previous year. Capacity has grown at 4.2% in the first six months of
2016 and at this rate SIN might end the year with capacity having risen
above 77m in 2016.

In terms of its global ranking, Changi makes it into the Top 25 biggest
airports in the world for seat capacity, ranked 17th, just ahead of
Guangzhou and Bangkok and just behind Amsterdam and Jakarta. But
its ranking has slipped slightly from five years ago when the airport was in
15th position, ahead of Amsterdam and Jakarta.

  TOP 25 GLOBAL AIRPORTS BY SEAT CAPACITY – JUNE 2016

            6.0

            5.0

            4.0
Seats (m)

            3.0

            2.0

            1.0

            0.0
                  ATL
                        PEK
                              DXB
                                    LAX
                                          HND
                                                LHR
                                                      ORD
                                                            CDG
                                                                  FRA
                                                                        HKG
                                                                              IST
                                                                                    PVG
                                                                                          DFW
                                                                                                JFK
                                                                                                      CGK
                                                                                                            AMS
                                                                                                                  SIN
                                                                                                                        CAN
                                                                                                                              BKK
                                                                                                                                    DEN
                                                                                                                                          DEL
                                                                                                                                                SFO
                                                                                                                                                      ICN
                                                                                                                                                            KUL
                                                                                                                                                                  MAD

                              schedules analyser
Source:

This June there are 72 airlines operating scheduled services in and out of
the airport, with Singapore Airlines the largest operator, offering 31% of the
total scheduled capacity. The four airlines which make up the SIA Group
comprise just under 51.5% of all scheduled capacity at Changi.

                                                                                                                                                                        5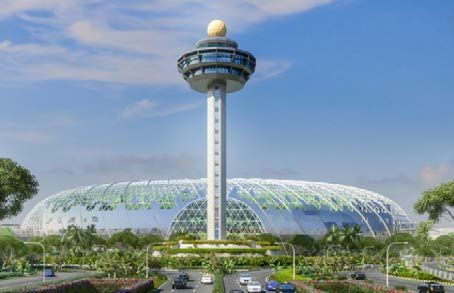
Changi plans: building before they come

      TOP 15 AIRLINES AT SINGAPORE CHANGI – JUNE 2016

                                                                                       Growth
                       Carrier                      Seats          Share
                                                                                June 2016 vs June 2015
        Singapore Airlines                        1,966,618         31%                  0.0%
        Tigerair Singapore                         516,528           8%                 -0.5%
        SilkAir                                    511,734           8%                  8.1%
        Jetstar Asia                               398,700           6%                  0.0%
        Scoot                                      279,170           4%                 57.8%
        AirAsia                                    184,320           3%                 -5.7%
        Cathay Pacific Airways                     179,116           3%                  5.7%
        Garuda Indonesia                           148,576           2%                 16.8%
        Emirates                                   135,360           2%                 -14.7%
        Indonesia AirAsia                          118,800           2%                 -12.5%
        Malaysia Airlines                          103,040           2%                  8.2%
        Thai Airways International                 94,434            1%                  6.9%
        Qantas Airways                             86,834            1%                 22.7%
        Cebu Pacific Air                           82,228            1%                  2.8%
        Other                                     1,551,589         24%                  5.4%
        All airlines                              6,357,047         100%                 3.7%

                            schedules analyser
    Source:

    The low-cost airline penetration of the market appears to have stabilised at
    around 30%, having grown rapidly until just a few years ago.

      AIRLINE CAPACITY TO/FROM SIN

                5,000,000
                4,500,000
                4,000,000
                3,500,000
    Seats (m)

                3,000,000
                2,500,000
                2,000,000
                1,500,000
                1,000,000
                  500,000
                        0
                            Jun-10       Jun-11         Jun-12   Jun-13    Jun-14     Jun-15     Jun-16

                                                                           Low cost   Mainline
                            schedules analyser
    Source:

6   © 2016 OAG Aviation Worldwide Limited. All rights reserved
SCHEDULED SEATS TO/FROM SIN BY REGION, 2015
3% 1%
South East Asia
7%
8% North East Asia
South West Pacific
10% 46% South Asia
Western Europe
Middle East
25%
Other
schedules analyser
Source:
Close to half of all capacity (46%) to and from SIN is destined for, or
arrives from, airports in South East Asia. The next largest market is North
East Asia (25%), followed by South West Pacific (10%). This signals the
strength of SIN’s role primarily as an airport serving Asia, albeit one with a
significant volume of long haul.
7Changi plans: building before they come
Evolution of an airport network
KANGAROO ROUTE – VOLUME OF SEATS AND SHARE VIA SINGAPORE.
SOUTHWEST PACIFIC TO WESTERN EUROPE, JUNE EACH YEAR
16% 1,400,000
14% 1,200,000
12% 1,000,000
Seat share
10%
8000,000
Seats
8%
600,000
6%
4% 400,000
2% 200,000
0% 0
2010 2011 2012 2013 2014 2015 2016
Capacity share Online seats
connections analyser
Source:
For a while the ‘kangaroo route’ connecting passengers between Europe
and Australia via SIN had a high profile and contributed to the airport’s
reputation as the connecting point for travel between the Continents.
While online capacity between the Southwest Pacific and Western Europe
appears not to have changed, the share of seats available, which route
via Singapore, has declined. In June 2010, 15% of available capacity was
via SIN but today it is down to 10%. In contrast, 51% of online seats are
available via Dubai (DXB), up from 32% in June 2010.
So if SIN is losing its role as a long-haul connecting point, where is the real
focus for the network? Today, the majority of routes are regional and exactly a
third of routes are under 3,000km (approximately 4 hours flying, June 2016).
AIRLINE FREQUENCIES BY DISTANCE – ROUTES TO/FROM SIN
June 2016
June 2015
June 2014
0% 10% 20% 30% 40% 50% 60% 70% 80% 90% 100%
up to 1,000km 1,000-2,000km 2,000-3,000km 3,000-4,000km
4,000-5,000km 5,000-6,000km 6,000-7,000km 7,000-8,000km
8,000-9,000km 9,000-10,000km over 10,000km
schedules analyser
Source:
8 © 2016 OAG Aviation Worldwide Limited. All rights reservedThere is a slight but discernible evolution of the route network over the
past three years with a small decline in the number of routes under 1,000
km operating to and from SIN, but also fewer routes over 6,000 km. Back
in June 2010, 29.9% of all routes operated were under 1,000 km and this
has slowly but steadily fallen to 27.6% in June 2016. At the other end of
the market, the proportion of routes over 6,000 km has fallen from 13.0%
in June 2010 to 11.3% in June 2016.
The effect of this is that SIN appears to be focussing more on the Asian
market. With the advent of new long-range aircraft which reduce the need
for connections, as well as the rise of the Middle East hub airports, this
should come as no surprise.
COMPOSITION OF TRAFFIC THROUGH SIN – MARCH 2016
SIN HKG PVG
Beyond 12%
DEL SIN HKG PVG
Bridge 2%
DEL SIN HKG SIN HKG
Local 63%
Behind 23%
traffic analyser
Source:
* airports shown are example routings.
Passenger booking data can show what is actually happening with
connecting traffic. Over the last three years the proportion of local traffic,
i.e. passengers flying directly between SIN and another airport, has
remained static at 63%. This means the proportion of passengers who
are connecting at SIN is 37%, made up of 23% who commenced their
journey at another airport and are connecting at SIN to travel onwards
to their destination. Another 2% of passengers make an additional
onward connection (in addition to the connection at SIN) and 12% start
their journey at SIN but connect onward at another airport to reach their
ultimate destination. So if the proportion of local and connecting traffic
has remained the same but overall traffic has grown, then both local and
connecting traffic have grown.
9Changi plans: building before they come
MIX OF TRAFFIC ON TOP 15 SINGAPORE ROUTES – MARCH 2016
ALL SIN
SIN-CGK
SIN-KUL
SIN-HKG
SIN-BKK
SIN-MNL
SIN-DPS
SIN-SGN
SIN-TPE
SIN-SYD
SIN-PVG
SIN-MEL
SIN-DMK
SIN-SEL
SIN-PER
SIN-LHR
0% 10% 20% 30% 40% 50% 60% 70% 80% 90% 100%
Local Behind Bridge Beyond
traffic analyser
Source:
There is obviously some variation by route with shorter routes typically
having the highest level of local traffic, such as Jakarta, Bangkok, and
Ho Chi Minh. In contrast, fewer than 50% of passengers on planes to
and from Sydney, Melbourne, Perth and London are simply travelling to
or from Singapore.
10 © 2016 OAG Aviation Worldwide Limited. All rights reservedFour brands – one strategy
With airlines operating within the Singapore Airlines Group now making
up over half of Changi’s scheduled airline capacity, the success of the
airport in achieving passenger growth is closely tied to the successful
implementation of the airline group’s strategy. And that strategy appears
to be working. Ten years ago Singapore Airlines operated 46% of seats
at Changi and other airline brands within the SIA group operated a further
5% taking the group share to 50%1. Recognising the problems faced when
legacy carriers compete with low-cost carriers, the group has pursued a
clear strategy which has focussed on aligning specific markets with the
type of air service best suited to market conditions.
So, the SIA group has adopted a multi-brand strategy with four clear
product offerings – Singapore Airlines (SQ) as the full service long-haul
carrier; Silk Air which is the regional full service carrier; Scoot, the long-
haul, low-cost airline; and with the acquisition of Tigerair, the group now
has its own short-haul, low-cost airline. The creation of Budget Aviation
Holdings in May 2016 as a holding company for Tigerair and Scoot is a
step towards the eventual merging of these brands.
Having dipped as low as 40% a few years ago, the SIA Group share of
capacity is now back up above 50%, made up of Singapore Airlines (32%),
Tigerair Singapore (8%), SilkAir (7%) and Scoot (3%).
SINGAPORE AIRLINES GROUP CAPACITY SHARE AT SIN
100%
80%
60%
40%
20%
0%
2005 2006 2007 2008 2009 2010 2011 2012 2013 2014 2015
Singapore Airlines Tigerair Singapore SilkAir Scoot Other
schedules analyser
Source:
1
Tigerair Singapore has only been included since 2014 when parent company Tiger Airways
Holdings became a subsidiary of the SIA Group.
11Changi plans: building before they come
Implementing the strategy has sometimes meant switching the brand
which operates a route. The Singapore-Nanjing market, for instance,
was operated by the full-service Singapore Airlines until 2010 but is now
operated by the medium/long-haul, low-cost carrier, Scoot. Similarly, as
the group makes in-roads into the Indian market, Scoot is taking over
routes there such as Singapore-Chennai, previously operated by the low-
cost airline Tigerair. Now that the Group has full control of Tiger, we should
expect to see more changes to the mix of airlines and routes. There will be
routes where more than one of the SIA brands operates with each other,
competing for different market segments and at different times of day.
The SIA Group also operates a joint venture with India’s Tata Group to run
Vistara, an Indian full-service carrier which started operating in 2015, and
a 23% ownership stake in Virgin Australia although that is now the subject
of scrutiny as Air New Zealand is looking to sell its stake in the carrier. It
also divested its 49% stake in Virgin Atlantic in 2014. Scoot also has a
joint venture with Nok Air to operate NokScoot, a Thai low-cost, long-haul
carrier based in Bangkok.
So what this shows is that the SIA Group has been putting its house in
order over the last few years, focussing on regional brands and matching
the product with the market. They have not gone as far as to actively
facilitate connectivity between the brands although the new Value Alliance,
which includes the SIA Group’s low-cost brands, may be an alternative
way to drive low-cost connectivity.
Singapore Airlines acknowledges that they have not pursued aggressive
growth in long-haul markets in recent years2 but this will change as A350’s
start to arrive into the fleet. There are two A350-900s in the fleet now and
a further 65 on order, 7 of which are the A350-ULR version capable of
flying for up to 19 hours. The airline has already announced the intention
to operate non-stop flights again to the US from 2018. Although a rise in
oil prices will be a challenge, the A350s are undoubtedly more fuel efficient
than the A340s that previously operated on SIN-US routes. A look at the
map of routes operated by Singapore Airlines that are over 3,000 km
shows that there are plenty of long-haul destinations they don’t currently
fly to.
2
https://skift.com/2016/03/14/singapore-airlines-ceo-on-its-multi-brand-strategy-for-
winning-in-asia/
12 © 2016 OAG Aviation Worldwide Limited. All rights reservedSINGAPORE AIRLINES ROUTES FROM SINGAPORE, OVER 3,000 KM (JUNE 2016)
connections analyser
Source:
The airline had been expected to code-share with fellow Star Alliance
member, United Airlines (on its new Singapore operation which started in
June 2016), until it took delivery of new long range A350 aircraft in a few
years. However, rivalry appears to have trumped alliance membership in
this instance. In what is already a very competitive market with multiple
one-stop options, two non-stop flights will really test the staying power
of both carriers unless there is a broader, deeper relationship being
considered.
Singapore Airlines also has 30 B787s on order which seem set to replace
their ageing B777s. Whilst the B787 will not offer them a capacity
increase, the aircraft is more fuel efficient and may allow existing long-haul
routes to be more competitive.
13Changi plans: building before they come
Prospects for growth
So having established that the SIA Group is well positioned to grow, which
markets are most likely to deliver the required growth in demand and
which other airlines will contribute to that growth?
Starting with outbound travel, Singapore itself is a city-state with a
population of 5.5m3 of which 3.9m are residents and 1.6m are non-
residents. In 2015 there were 1.2% more residents than a year earlier but
the rate of population growth has been slowing. As long as the economy
continues to grow, there is every expectation that outbound travel
should continue to increase, enabling residents to travel abroad and the
non-resident population to travel back and forth to their place of origin.
According to OAG Traffic Analyser, in 2015 a third (33%) of all passengers
with an origin or destination in Singapore (i.e. local passengers, which
constitute 63% of all traffic at SIN) also had a point of sale that was
Singapore, which means outbound travellers may only account for a fifth of
all passengers using the airport.
So what of prospects for inbound traffic growth? Again, that will largely
be linked to the state of the economy in source markets. China and
Indonesia are the two most important markets for international visitor
arrivals to Singapore4. Growth in visitor numbers from China have varied
radically year by year but the latest figures, for March 2016, show there
were 84% more visitor arrivals from China than a year earlier. Growth in
Chinese visitors has been facilitated by a steady increase in the number
of air services between Singapore and China. In June 2010 there were
scheduled services to 12 destinations in China; today that number is 25.
The number of airline seats has averaged growth of 10% per annum since
2010. With the next few years likely to see new Chinese low-cost carriers
come to the market and new secondary airports commence services to
Singapore, the prospects for growth in this market are strong.
Visitor arrivals from Indonesia are not growing quite so fast with a ‘mere’
13% increase in March 2016 vs the previous year. Capacity to and from
Jakarta makes up over half of all airline seats between the two nations
but with Jakarta effectively operating beyond design capacity, additional
capacity will need to come from larger aircraft or secondary Indonesian
routes. The number of routes operated to Indonesia has remained
fairly static for over five years so while there is growth potential, airport
infrastructure is a major issue. On the positive side, Indonesian carrier Lion
Air has more aircraft on order than any other airline in Asia just now. Of the
3,960 which are on order in Asia Pacific for the next 10 years, according to
CAPA Fleet database, 464 have been placed with Lion Air.
The third strand of potential traffic growth will come from connecting
traffic. The airport is fortunate to be located conveniently between some
of the largest and fastest growth markets in the world and whilst the SIA
Group strategy appears ready to make the most of the opportunity, it will
have to compete hard with the Gulf carriers who have already secured their
position. Membership of the Star Alliance clearly creates opportunities for
3
Population Trends 2015, Singapore Department of Statistics
4
International Visitor Arrivals Statistics, Singapore Tourism Board
14 © 2016 OAG Aviation Worldwide Limited. All rights reservedgenerating connecting traffic at Singapore, especially if the relationship
with United is to become closer. The greater opportunity for the SIA Group
may be in facilitating connectivity between Scoot and Tiger, so that the
airport becomes a hub for low-cost connections as well as full-service
connections.
Aircraft orders across the region provide supporting evidence for where
growth will come from. After Lion Air, AirAsia has the next largest order with
246 aircraft orders in place, followed by IndiGo with 221. The three largest
Chinese carriers have orders for a further 476 aircraft between them.
Something special
While we are right to be sceptical of the ‘build it and they will come’
mentality that some airport authorities have had in the past, there is no
doubt that Changi has an ability to influence passengers to want to visit,
whether that’s as a tourist spending time in Singapore or just transiting.
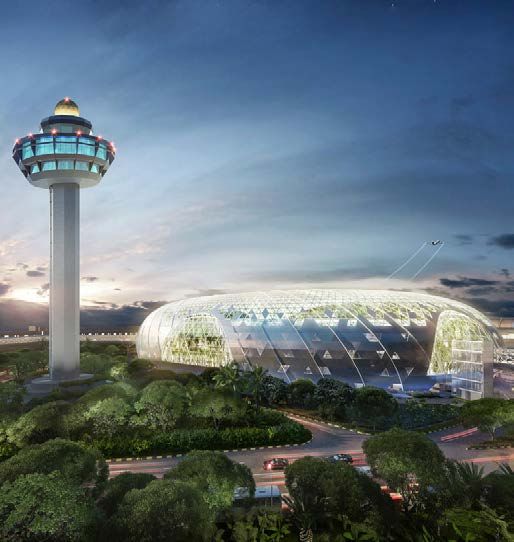
With the new Jewel Changi Airport under construction this may never be
more true. Pitched as a destination in its own right, Jewel Changi Airport
will sit between the three existing terminals, acting as a transfer facility
as well as a shopping mall, hotel, dining venue and visitor attraction. The
glass structure will house Singapore’s largest indoor garden as well as a
‘towering rain vortex’.
ARTIST IMPRESSION OF JEWEL CHANGI
Images © www.jewelchangiairport.com
15Changi plans: building before they come
As Changi has succeeded in doing so in the past, the new development
will firmly place the experience of the traveller at its heart, ensuring the
airport continues to be a destination in its own right. It seems that at
Changi they dream bigger, spend more and give travellers more reasons to
choose Singapore.
Images © www.jewelchangiairport.com
16 © 2016 OAG Aviation Worldwide Limited. All rights reservedGood planning?
Undoubtedly there is a case for significant expansion of Changi to
accommodate future growth – the question remains whether there is a
case for the full expansion to capacity of 135 mppa. Airport infrastructure
development and implementation takes many years and so decisions need
to be based on the best available information. Having reviewed the recent
growth, analysed the served markets and assessed the evolving airline
relationships and business models, it suggests that the full capacity will
indeed be needed. Our estimate is that it will be around 2035 when the
new capacity will be reached.
China, Indonesia and others such as Vietnam and Myanmar will be strong
growth markets for Singapore and alongside the evolving plan of the
SIA group and airline models in general, Changi is well placed to deliver
sustained growth over the next 20 years.
17Changi plans: building before they come 18 © 2016 OAG Aviation Worldwide Limited. All rights reserved
19
For more information, visit www.oag.com
     or email us on contactus@oag.com

     Europe, Middle East & Africa
     1 Capability Green                  Usage and attribution
     Luton                               This information can be reproduced either in whole or in part,
     Bedfordshire LU1 3LU
                                         online or in print, for non-commercial purposes only but must
     United Kingdom
                                         include attribution to OAG and a link to www.oag.com.
     T: +44 (0)1582 695050
                                         Disclaimer
     Americas                            The intended recipient (“The Customer”) acknowledges that
     801 Warrenville Road                all data provided by or available through OAG is owned either
     Suite 555
                                         by OAG Aviation Worldwide Ltd or by a third party provider
     Lisle
     Illinois 60532                      (“The Owners”) and that the customer shall not acquire any
     USA                                 ownership or interest in such data.
     T: +1 800 342 5624
                                         OAG data is solely for the benefit and purposes of the
                                         intended recipient and may not be disclosed to, used by
     Asia
                                         or copied by anyone other than the intended recipient.
     6 Shenton Way
     #24-08A, Singapore                  OAG Aviation Worldwide Ltd has used reasonable efforts in
     OUE Downtown 2                      collecting and preparing data in the report but cannot and
     068809                              does not warrant that the information contained in this report
     T: +65 6395 5888                    is complete or accurate. OAG Aviation Worldwide Ltd hereby
                                         disclaims liability to any person for any loss or damage caused
     China                               by errors or omissions in this report.
     #3710B Jingguang Building
     Hujialou Chaoyang District
     Beijing China 100020
     T: +86 10 5095 5960

     Japan
     Toranomon
     40MT Building 9F5-13-1
     Toranomon Minato-Ku
     Tokyo 105-0001
     T: +813 6402 7301

© 2016 OAG Aviation Worldwide Limited.
All rights reserved
You can also read