The Unfair Tax Plan: Hurting workers and destroying our public services
←
→
Page content transcription
If your browser does not render page correctly, please read the page content below

The Unfair Tax Plan:
   Hurting workers and
   destroying our public
   services

Authorised by S. McManus, ACTU Secretary, 365 Queen St, Melbourne 3000. ACTU D No. 113/2018

                                                                                              Tax
                                                                                              Cuts
Contents

Contents ........................................................................................................................................... 0

The Turnbull Government’s income tax plan erodes the very essence of a progressive taxation
system and increases inequality ...................................................................................................... 1

Context: Australia faces rising inequality and Turnbull’s tax plan will make it worse ...................... 2

It’s the rich elite who really benefit from the tax cuts ...................................................................... 7

Australian workers need wage increases not tax cuts targeted to the rich elite ........................... 13

The costs of these tax cuts are substantial ................................................................................... 15

Australia needs additional tax revenue to Invest and our build our domestic economy ............... 16

Those who can afford to pay more will now pay less ..................................................................... 17

Corporate Tax Cuts: Giving $80 billion to big end of town and new ACTU research ...................... 18

Conclusions .................................................................................................................................... 22
The Turnbull Government’s income tax plan erodes the very
essence of a progressive taxation system and increases inequality

Australia is a prosperous country proudly founded on decent living standards and the fair go.
However, these standards are under threat from the Turnbull Government’s income tax plan. The
idea that a corporate executive on $200,000 dollars a year should pay the same marginal rate of
tax as a worker earning close to the minimum wage on $41,000 destroys the very principles of a
progressive tax system. This is exactly what happens under stage two and three of Government’s
income tax plan which removes the 37 per income cent tax bracket. These changes will lead to a
flat tax for 80% of workers. While the Turnbull Government will try and sell this as a tax cut for
ordinary Australians, the truth is that this tax cut predominately benefits the rich elite. This tax
cut will hand out billions of dollars to high income Australians and make Australia’s tax system
more regressive. A staggering 62% of benefits from the income tax plan will go to high income
earners.

The government has revealed this measure will end up costing extraordinary amounts of revenue
(the Treasurer has indicated the ten-year cost of the plan is $140 billion). The purpose of the tax
system is to generate sufficient revenue to provide the services the community expects and
deserves of governments and to support a fair society with decent living standards for all.
Australia’s tax system is based on the notion of progressive taxation. These changes undermine
the progressive nature of the tax system and will cause income inequality to widen. The ACTU’s
position is that the tax system should support the role of government to provide quality services
and investment in high-skilled, high-wage job creation and do so in a way that is fair for all tax-
payers.

On top of a tax cut for high income earners the Government is giving an $80 billion dollar tax cut
to large corporations further eroding our tax base. As we show later in the this paper, new ACTU
empirical analysis show that over 10 years and across OECD countries that there is no
correlation between reductions in corporate tax cuts and increases in wages. Further new
empirical work by the ACTU, using linear regression analysis, shows countries which cut taxes
actually had worse wage performance than those that did not.

Widening inequality in advanced countries has been detrimental to economic growth. As the real
wages of lower income earners have stagnated and in some cases gone backwards, as
employment has become increasingly insecure and as the middle class has been hollowed out,
consumer demand has weakened and growth has slowed. The world’s most prominent

                                                                                                  1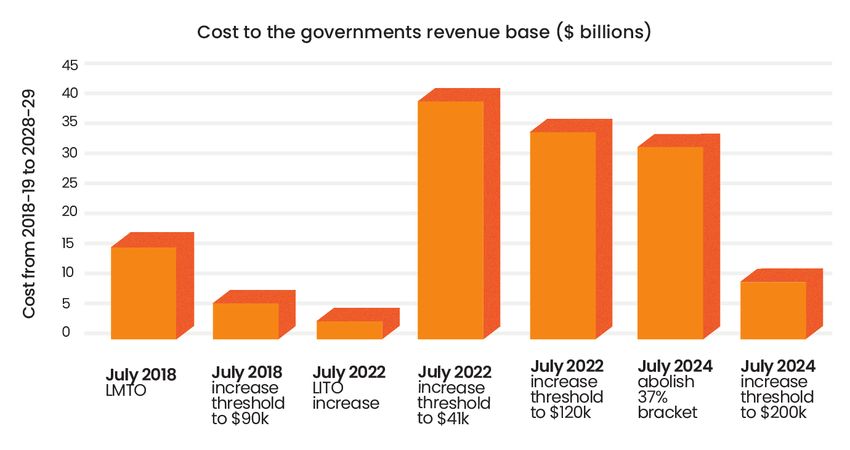
international economic organisations including the World Bank, the IMF and the OECD have all
found that the increase in inequality in many advanced economies in the last three decades has
had a negative effect on growth and prosperity. The IMF has concluded that increasing the
income share of the poor and the middle class actually increases growth while a rising income
share of the top 20% results in lower growth – “that is, when the rich get richer, benefits do not
trickle down.”

Ageing populations and the increasing availability of new life-saving, life-enhancing medical
technologies will continue to cause health costs to rise faster than GDP, even with reforms that
continue to improve efficiencies. Meeting these and other pressing needs- school funding,
investment in infrastructure, innovation and job creation - will require improvements to our
overall budget revenue position. Handing out billions of dollars to high income Australians is a
decision our country cannot afford.

Years of continuous budget cuts and outsourcing has placed an intolerable strain on and
damaged Australia’s public services, producing significant social and economic costs for the
community - including the Census fail, robodebt, 55 million unanswered Centrelink phone calls,
and increased biosecurity failures.

To rebuild our public services and maintain our living standards government needs increased,
not less, revenue. Significant investment is needed in the areas of health, education,
infrastructure and public sector ICT policy and service delivery capacity. Without it, millions of
Australians will end up worse off as they will receive inferior and more expensive public services
in return for a negligible tax cut.

Context: Australia faces rising inequality and Turnbull’s tax plan will
make it worse

By disproportionately increasing the incomes of the rich, this tax cut will lead to a further
widening of the gap in income distribution. Income inequalities are greater than at any time in
the last 70 years. Small elites have amassed vast fortunes and massive political power. For the
vast majority of people, living standards have declined and job security has disappeared.
Inequality is the challenge of our time. If we don’t change course, Australia will be a fully
Americanised society of high inequality and dead end jobs, with long working hours, no holidays,
zero job security and poverty pay levels. Australia must not go any further down this path. Instead

                                                                                                 2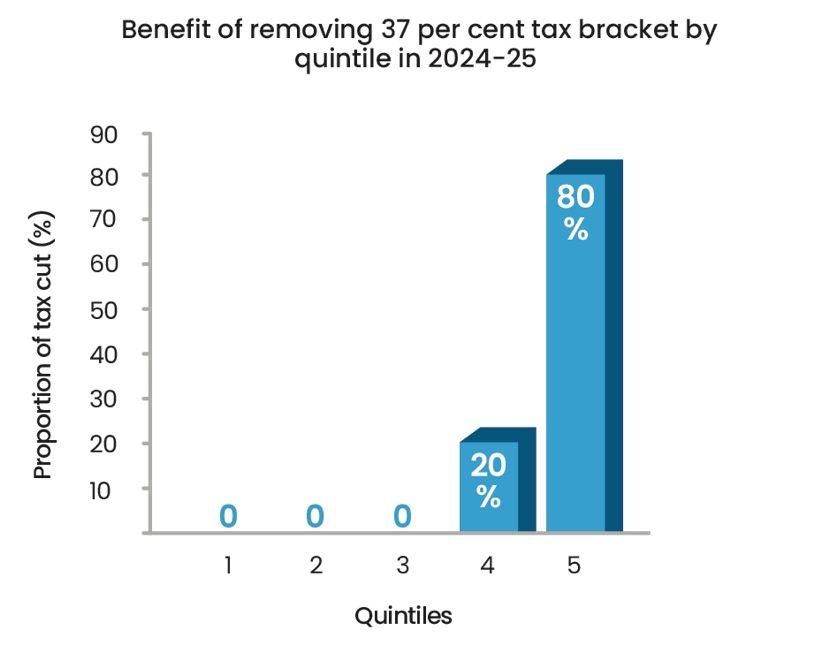
we must return to being a country in which families on a normal income can afford to buy a
home, provide a good education for their kids and have a decent standard of living.

Societies that pay their workers fairly and provide job security tend to have low crime levels, less
social problems and are more inclusive. Treasurer Scott Morrison has denied that inequality is a
problem. However the facts are clear. The distribution of income throughout society is becoming
more unequal. The graph below shows that since the mid-1990s income inequality in Australia
has been getting worse. Despite a blip just after the Global Financial Crisis, when share prices fell
for a short period and those rich enough to make lots of income through their investments took a
hit, it is the clear that the general trend has been towards widening income inequality.

Source: OECD

The last OECD Economic Survey of Australia, released in March 2017, had this to say about
income inequality in Australia:

  “Inclusiveness has been eroded. The Gini coefficient has been drifting up and households in
upper income brackets have benefited disproportionally from Australia’s long period of economic
growth. Real incomes for the top quintile of households grew by more than 40% between 2004
and 2014 while those for the lowest quintile only grew by about 25%.”

                                                                                                   3
The OECD also released the following graphs that show inequality is rising and the top incomes
have benefited disproportionately
Source: OECD
4Source: OECD
The graphs above highlight that Australia has a lower level of inequality than the USA but the
level has been rising over time. If we turn to the share of income held by the top 1%, it is clear
inequality is at a 70 year high.
5Source: World Wealth and Income Database
The share of income held by the richest 1% of the population has been steadily rising since
neoliberal approaches began to dominate economic policy in the 1980’s.
Source: World Wealth and Income Database
Despite the denials of the Turnbull govern income inequality is rising in Australia. The fact that
the Turnbull Government attempts to pretend that inequality is not a problem while the
traditionally conservative global economic institutions, such as the OECD and the IMF, argue that
6rising inequality is among the most pressing issues of our time, demonstrates that the Turnbull
Government is out of touch with reality faced by ordinary Australians.
It’s the rich elite who really benefit from the tax cuts
The Turnbull government income tax plan moves over time to a flat marginal tax rate for all
Australians earning between $41,000 and $200,000 dollars – by removing the current 37 per
cent tax bracket (so there will only be four tax brackets rather than five). Under these plans, all
Australians earning between $41,000 and $200,000 would have a tax rate of 32.5%. This will
affect 1.8 million Australians.
The Australia Institute has produced the following analysis which highlights that the proposed
benefits of tax cuts are clearly concentrated amongst those in upper income deciles. 62% of the
income tax plan will go to high income earners.
Graph One: Benefit of proposed tax cuts by income decile
Source: Australia Institute
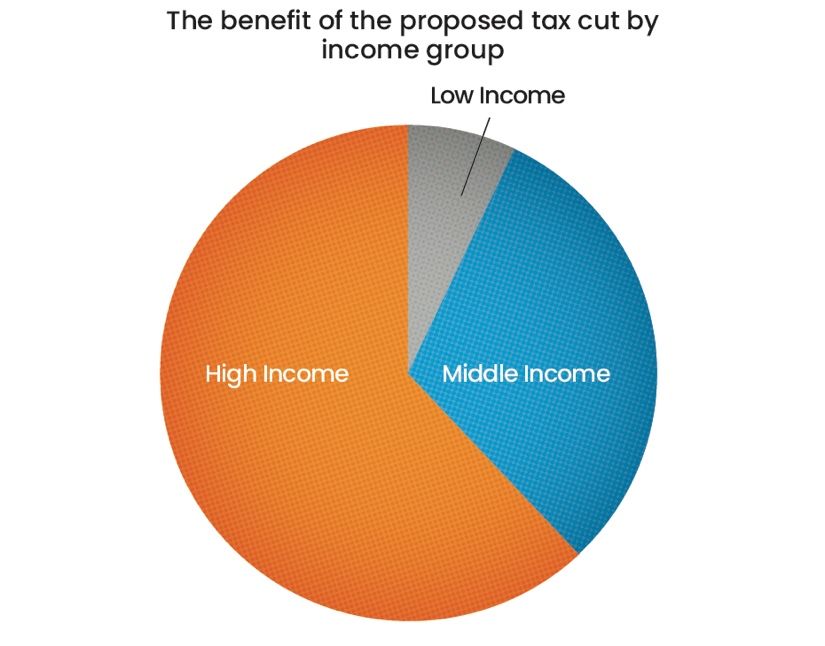
7Table One: Benefit of proposed tax cuts by income group
Low income earners Middle income earners High income earners
Proportion of tax cut 7% 31% 62%
Approximate number of tax
payers 3 million 5 million 2 million
Source Australia Institute
Figure: The benefit of the proposed tax cut by income group
Source: Australia Institute
Matt Grudnoff from the Australia Institute has also modelled just the income distributional
impacts of increasing the 32.5 cent threshold from $90,000 to $200,000 and the removal of the
37 cent bracket1. This represents part of stage two and all of stage three of the Government’s tax
plan.
1Matt Grudnoff ‘ High income earners the big winners from scrapping 37% tax bracket’, The Australia Institute, May
2018
8Graph: Benefit of removing 37 per cent tax bracket by quintile in 2024-25
Source: ATO (2018) Taxation Statistics 2015-2016 and Australia Institute calculations
The Australia Institute research shows that the top quintile of taxpayers (the top 20 per cent) gets
80 per cent of the benefit from removing the 37 per cent bracket. The next 20 per cent of
taxpayers receive the rest of the benefit. The remaining 60 per cent of taxpayers get no benefit.
In dollar terms the Treasury have released estimates of the financial impact of the Turnbull
Government's 7-year income tax plan on taxpayers, broken down into taxable incomes from
$20,000 to over $200,000. We can see below that the impacts for later stages of the tax cuts
will result in a $7,225 annual reduction in tax paid for someone with a taxable income of
$200,000.
9Treasury Analysis of annual financial impact of tax cuts from 2024-25
We can see more clearly in the graph below how the impacts are greater for those with higher
taxable incomes.
10Treasury Analysis of annual financial impact of tax cuts from 2024-25
Source: Treasury
Further analysis by the Grattan Institute shows that once the three-stage plan – including
removing the 37c bracket – is complete, $15 billion of the annual $25 billion cost of the plan will
is attributable to collecting less tax from the top 20% of income earners, who currently have a
taxable income of $87,000 or more2.
2 https://grattan.edu.au/wp-content/uploads/2018/05/Grattan-costing-of-the-Government-Personal-Income-Tax-
plan-for-Web-1.pdf
11Source: Commonwealth Budget Papers 2018-2019, Grattan analysis of ATO sample file 2015-2016
The Grattan institute also show that the majority of the benefits accrue to those in the top
income deciles. This can clearly be seen in the graph below3;
3 https://grattan.edu.au/wp-content/uploads/2018/05/Grattan-costing-of-the-Government-Personal-Income-Tax-
plan-for-Web-1.pdf
12There is a wide body of evidence, including Treasury analysis, that shows the benefits of these
tax cuts are targeted at individuals with higher incomes. This will lead to a continued widening of
income inequality in Australia.
While the Turnbull Government is trying to pitch this as a tax cut for middle Australia, the real
median wage for all workers (part time and full time) is just $52,988. Half of all Australian
workers earn less than this4.
Even if we just consider full time workers, the median annual income for a full-time worker is just
$65,5775. While the Government tries to claim ‘middle Australia’ earns between $150,000 and
$200,000 a year – Australian workers know the reality.
Australian workers need wage increases not tax cuts targeted to
the rich elite
Dr Jim Stanford, from the Centre for Future Work, has analysed the difference between the gains
for workers from the Government’s tax plans and those that would result if wage growth were to
return to normal levels of 3.5%. This analysis shows that for a worker earning $60,000 per year
(above the median income of Australians), the Coalition tax plan will increase disposable income
by $530 by the last year of the budget period (2021-22). In contrast, annual normal wage
increases (of 3.5 percent per year) would boost disposable income by almost $6000 – 11 times
as much.
4 https://www.theguardian.com/business/grogonomics/2018/may/31/tax-cuts-are-awful-for-middle-australia-to-
pretend-otherwise-is-misleading
5 Ibid
13Wage Increases are better: Boost to Annual Disposable Income in 2020-21 from different
sources
Current Earnings Coalition tax plan Annual 3.5% Wage Increases
20,000 $0 $2,950
40,000 $290 $4,780
60,000 $530 $5,975
80,000 $530 $7,435
100,000 $515 $9,294
125,000 $135 $11,617
Source: Dr Jim Stanford, from the Centre for Future Work
What working Australians really need is a plan to return the country to normal levels of wage
growth rather than income tax cuts targeted at the rich. Unfortunately the Government’s support
for cuts to penalty rates for 700,000 workers and ongoing attacks on unions will continue to
leave wage growth at close to record lows.
14The costs of these tax cuts are substantial
The cost in terms of lost revenue is significant at $144bn to the end 2028-296.
Graph: Cost to the governments revenue base ($ billions)7
Furthermore new ACTU calculations reveal that the costs of $24 billion per year (as calculated by
the independent Parliamentary Budget Office) could pay for;
1. More than 25 million emergency ward patient admissions or8
2. Funding for 1.9 million secondary school students or9
3. Provide 496,730 people with a disability with individualized support in the first year on the
National Disability Scheme10
6 https://www.theguardian.com/business/grogonomics/2018/may/31/tax-cuts-are-awful-for-middle-australia-to-
pretend-otherwise-is-misleading
7 ibid
8 Based on emergency ward admissions costing $956 per patient. Independent Hospital Pricing Authority. (2016).
National Hospital Cost Data Collection: Australian Public Hospitals Cost Report 2013–14 Round 18. Available at:
https://www.ihpa.gov.au/sites/g/files/net636/f/publications/nhcdc–round18.pdf
9 Based on Australian government funding of $12,193 per secondary school student as stipulated in the School
Resourcing Standard. National Commission of Audit. (2017). Schools funding. Available at:
http://www.ncoa.gov.au/report/appendix–vol–1/9–7–schools–funding.html
15Australia needs additional tax revenue to Invest and our build our
domestic economy
Faster economic growth requires investment in our country’s greatest resource – our people.
Growth and higher living standards require investment in schools, TAFE, and universities, as well
as major new investments in public infrastructure – including roads, rail transport and a first rate
National Broadband Network. These investments provide opportunities for all our people to be
part of our economic success. We can see below Australia is the eight lowest taxing country in
the OECD (2015). Australia has a revenue crisis and we need to improve not diminish the tax
base.
Graph: Tax Revenue as a Share of GDP in OECD nations
Source: Cameron and Murray (2018): Australia the low tax country, Australia Institute, OECD taxation statistics
10At full scheme, about 475 000 people with disability will receive individualised supports, at an estimated cost of
$22 billion in the first year of full operation (Productivity Commission. (2017). National Disability Insurance Scheme,
position paper). This leads to an average of $46,316 per person in the first year of NDIS
16We need an economic plan that tackles growth and fairness simultaneously. The IMF has also
become an outspoken supporter of fiscal stimuli in countries where governments have low levels
of deficit and debt, through investments in infrastructure and skills. Despite the hyperbole so
prevalent in our national economic debate, Australia has a very low fiscal deficit and, compared
to other countries, a low level of public debt. It makes sense to invest in critical areas for the long
term, such as clean energy technologies, public transport, and better communication
infrastructure. This will create jobs in the short run and expand our potential long term growth.
This will encourage higher levels of private investment. An increase in Government investment
now will see us reap the benefits through more, higher paid jobs and increased government
revenues in the future.
By contrast the Liberal Party remains stuck in the bygone era of Ronald Reagan and the
discredited theory of “trickledown economics”. Tax cuts for large corporations and wealthy
individuals are not an economic plan. Increasing corporate welfare only leads to more corporate
rent-seeking and tax cuts primarily targeted at the rich creates a more unequal society.
Those who can afford to pay more will now pay less
This personal income tax plan is targeted at those in the higher income deciles. A staggering 62%
of the income tax plan will go to high earners. This will further increase income inequality in
Australia and destroy the progressive nature of our tax system.
17Corporate Tax Cuts: Giving $80 billion to the large multinationals
Not only is the Government cutting personal income taxes for the rich they are giving an $80
billion tax cut to large corporations.
The government has repeatedly claimed that cutting corporate tax rates will increase wages..
However new ACTU empirical analysis of OECD data for 34 countries on corporate income tax
rates and wage growth rates from 2003 to 2016 does not suggest any association between
corporate tax rates and wage growth.
• for the 26 other countries that could be analysed the association of corporate tax
changes to wage rates was weak at best, for all countries, and other factors are much
more important
• For 15 OECD countries a fall in the corporate tax rate is associated with slower wages
growth, but the effect is slight and is statistically significant in only 7 cases.
• For the other 13 countries, the results were negative but were close to zero, and only 4
were statistically significant.
• The results are just as likely to be random.
• 6 countries had no change in the corporate tax rate between 2003 and 2016 but at the
same time showed wide variation in wages growth
• the findings from this limited statistical analysis must be treated with caution but do
suggest that more detailed analysis including investigation of causality would not change
them dramatically
Nineteen countries had falls on trend in both tax rates and wage growth between 2003 and
2016, in some cases very small.
18Table 1: Statutory corporate tax rates and real wage growth trends 2003-2016
Corporate tax rate trends
up down
Wage growth trends
up Iceland, Belgium (≈0), Germany, Luxembourg
(≈0), Poland,
down Chile, France (≈0), Hungary, Austria, Canada, Czech Republic,
Portugal (≈0), Slovak Republic, Denmark, Estonia, Finland, Italy,
Japan, Korea S, Latvia, Mexico (≈0),
Netherlands, New Zealand, Norway,
Slovenia, Spain, Sweden, Switzerland
(≈0), United Kingdom,
Source: OECD and ACTU calculations
Notes: No change in corporate tax rate: Australia (wage growth down), Ireland (wage growth down)
Bigger percentage point increases in growth of wages are also positively associated with bigger
increases in corporate tax rates, but again the association is very weak.
Too many other factors are significant in determining wage growth. The following chart indicates
the lack of relation between percentage point changes in corporate tax rates and in wage rates.
19Chart: Percentage point changes in corporate tax rates, ranked, and in real wage growth,
2006-2016
Source: OECD statistics, ACTU calculations
20A linear regression of the data above shows a (non-significant) positive relationship between
changes in corporate taxes and changes in wages (that is, countries which cut corporate taxes
actually had worse wage performance than those that did not)
Chart: Linear regression analysis on tax cuts and real wage growth across OECD countries for
2006-2016
It is clear that the Government’s claims on wage growth and corporate tax cuts does not match
the international evidence.
21Conclusions
“Trickledown economics” has failed. Tax cuts for large corporations and wealthy individuals harm
us all. Fewer public services, roads, bridges, nurses and teachers are just some of the costs
And new ACTU empirical research indicates that the Governments main justification for corporate
taxes doesn’t conform with the experiences of most OECD countries and the international
evidence.
To address inequality and move to a more even playing field it is essential that corporations pay
their fair share of tax. Our tax base remains less than optimal because we have allowed
multinational companies and the very wealthy far too many opportunities to avoid contributing
their fair share to the public purse
In the end it is working people and the vulnerable that have to carry the burden of handing out
billions of dollars to the rich and large corporations
.
22address
ACTU
Level 4 / 365 Queen Street
Melbourne VIC 3000
phone
1300 486 466
web
actu.org.au
australianunions.org.au
ACTU D No.
113/2018
23You can also read