2018 Results PHARMA SECTOR - Laboratorio Reig ...

Page created by Floyd Aguilar
 
CONTINUE READING
2018 Results PHARMA SECTOR - Laboratorio Reig ...
PHARMA
SECTOR

                       2018 Results

         ANNIVERSARY
2018 Results PHARMA SECTOR - Laboratorio Reig ...
ANNIVERSARY

DISCLOSURE
This presentation contains no confidential material and may include publicly    risk management practices. Readers are cautioned not to place undue
available market information which has not been independently verified by       reliance on these forward looking statements. Reig Jofre does not
Reig Jofre.                                                                     undertake any obligation to publicly release the result of any revisions to
This information is given in summary form and does not purport to be            these forward looking statements to reflect the occurrence of unanticipated
complete. Information in this presentation should not be considered as          events. While due care has been used in the preparation of forecast
advice or a recommendation to investors or potential investors in relation to   information, actual results may vary in a materially positive or negative
holding, purchasing or selling Reig Jofre shares and does not take into         manner. Forecasts and hypothetical examples are subject to uncertainty
account your particular investment objectives, financial situation or needs.    and contingencies outside Reig Jofre’s control.

This presentation may contain forward looking statements including              Past performance is not a reliable indication of future performance.
statements regarding Reig Jofre’s intent, belief or current expectations with
respect to the businesses and operations, market conditions, results of
operation and financial condition, capital adequacy, specific provisions and
2018 Results PHARMA SECTOR - Laboratorio Reig ...
ANNIVERSARY

                                               CONTENTS
  01. REIG JOFRE TODAY                    03   05. BALANCE SHEET                           18

  02. EVOLUTION OF THE BUSINESS AREAS     06   06. NOTES FOR THE FUTURE                    27
       PHARMACEUTICAL TECHNOLOGIES AREA   07     ESTRATEGIA EN TECNOLOGÍAS FARMACÉUTICAS   30
       SPECIALTY PRODUCTS AREA            08     ESTRATEGIA EN PRODUCTOS DE ESPECIALIDAD   35
       CONSUMER HEALTHCARE AREA           09     ESTRATEGIA EN CONSUMER HEALTHCARE         38
                                                 DESARROLLO CORPORATIVO                    39
  03. INTERNATIONAL PROGRESS              10
       INTERNATIONAL PRESENCE             11   07. SHAREHOLDERS BASE                       40
       SALES BY GEOGRAPHIC AREA           12
                                               08. LINKS TO ADDITIONAL INFORMATION         42
  04. PROFIT AND LOSS ACCOUNT             13
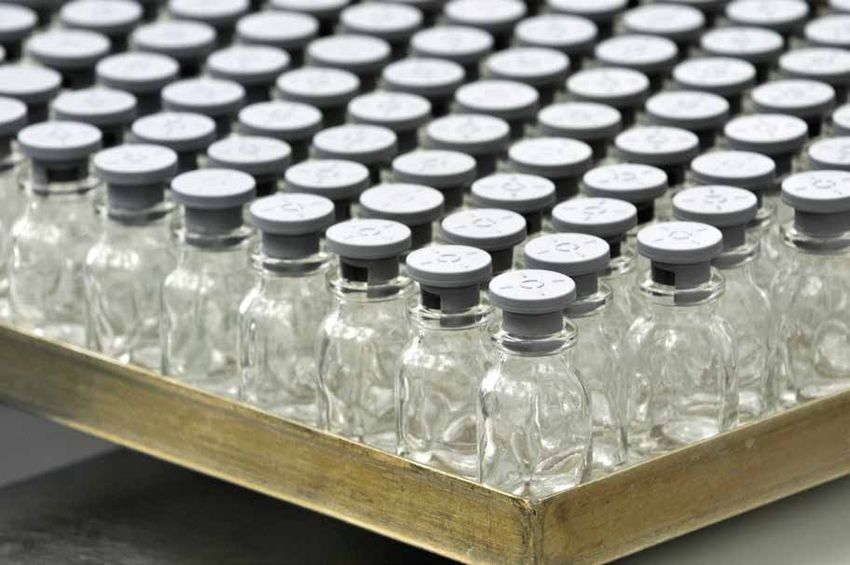
2018 Results PHARMA SECTOR - Laboratorio Reig ...
01
REIG JOFRE TODAY

          PHARMA
          SECTOR
2018 Results PHARMA SECTOR - Laboratorio Reig ...
PHARMACEUTICAL COMPANY FOCUSED ON THE RESEARCH, DEVELOPMENT,
MANUFACTURE AND MARKETING OF PHARMACEUTICAL PRODUCTS AND
NUTRITIONAL SUPPLEMENTS

                             3 GENERATIONS AT THE HEAD OF THE BUSINESS

                             1929                           1970                          2006
                             Ramon Reig Jofre               Joan M. Biosca                Ignasi Biosca
                             Founder                        Founder’s son-in-law          Founder’s grandson and current CEO

     PHARMA

                            90                                        1056                                              RJF
                             YEARS SINCE FOUNDING                       ASSOCIATES                                       TICKER

     SECTOR

                                                                              606
                                                                                                                         Quoted on the Spanish stock
                             Founded in Barcelona in 1929                                       450                      exchange’s main market since 2015

MAIN FIGURES
                            SALES                     EBITDA                       NET PROFIT                  Debt/                     EXPANSION
                                                                                                               EBITDA                   INVESTMENTS

     Closed 2018           181 M€                 16.4M€                           9.3M€                     1.5 X                    15.9 M€
      *Variation vs 2017    +7%                      +4%                           +5%

04
2018 Results PHARMA SECTOR - Laboratorio Reig ...
Reig Jofre today

SALES EVOLUTION BY
                                                                                                                 ANNIVERSARY

BUSINESS AREA 2018                         180.5 M€
                                              +7%

     PHARMACEUTICAL                       SPECIALTY                                    CONSUMER
     TECHNOLOGIES                         PRODUCTS                                     HEALTHCARE
     Antibiotics                          Dermatology                                  Nutritional Supplements
     Injectables / lyophilized            Gynecology                                   OTC

     54%                    97.4 M€       20%                36.8 M€                   26%                  46.3 M€
                                 +6%                              -3%                                        +22%

                                                    22%  CDMO

                                                                  CDMO services
                                                                  (Contract Development & Manufacturing
                                                                  Organization / Development and

                                                        5%
                                                         Others
                                                                  Production to third parties), driven by
                                                                  value-added products (derma in Sweden,
                                                                  injectables, biotech and antibiotics
                                                                  derived from penicillin)

                      73 %  Own
                            development
                                                                                                                               05
2018 Results PHARMA SECTOR - Laboratorio Reig ...
02
EVOLUTION OF THE
BUSINESS AREAS

PHARMA
SECTOR
2018 Results PHARMA SECTOR - Laboratorio Reig ...
Evolution of the business areas

                                                                                                                                                    ANNIVERSARY

PHARMACEUTICAL TECHNOLOGIES AREA

                                                                              PERFORMANCE OF THE AREA
                     PHARMACEUTICAL
                     TECHNOLOGIES                                             Good evolution of the pharmaceutical technologies area (54% of total
                                                                              sales), increased by 6% and contributed € 97.4 million in 2018.
                     Antibiotics                                              Second year of strong of the antibiotic line and continued growth of the
                     Injectables / lyophilized                                injectable and/or lyophilized products line

                     54%                       97.4 M€
                                                                              • Restoration of raw material supply in the antibiotic line that increased
                                                                                by 7% in 2018
                                                                              • Good progression of the sterile injectable product line that grew by 4%

                                                  +6%                         • Investments for the expansion of production lines amounting to € 16
                                                                                million in 2018 at the plants of Toledo (antibiotics) and Barcelona
                                                                                (injectables)

                                                                                  • After the opening of the markets of Japan in 2016 and the
                                                                                    Philippines in 2017, Reig Jofre goes a step further in its strategic
                                                                                    internationalization plan with the opening of the Indonesian
                                                                                    market in 2018, for the marketing of Remikaf, an innovative
                                                                                    anesthetic in Indonesia

                In 2018, 3 new dossiers of products have been presented in the USA and 32 new product approvals have been obtained in new markets, including
                RemiKaf in Indonesia.

                                                                                                                                                                  07
2018 Results PHARMA SECTOR - Laboratorio Reig ...
Evolution of the business areas

     ANNIVERSARY

SPECIALTY PRODUCTS AREA

                                           • The specialty products area decreases by 3% due to the impact of
                   SPECIALTY                 weighted reference prices in Spain, despite the increase in the units
                                             sold of these references
                   PRODUCTS                • During 2018 the Swedish Krona depreciated more than 3% against
                   Dermatology               the Euro, which impacted consolidated sales expressed in Euros from
                   Gynecology                the Dermatology area, mainly

                   20%
                                           • Additional compensation established by the Ministry of Health and
                                             Finance of Spain in compliance with the Agreement on the Expenditure

                                 36.8 M€     Ceiling in the Innovative Pharmaceutical Industry to guarantee the
                                             sustainability of the National Health System (SNS) linked to the
                                             evolution of the Gross Domestic Product (GDP)
                                  -3%
                                               • The business in the United Kingdom maintains its stability despite
                                                 the possible consequences of BREXIT and no significant effects are
                                                 foreseen

08
2018 Results PHARMA SECTOR - Laboratorio Reig ...
CONSUMER HEALTHCARE                                          FOCUSSING ON FORTÉ PHARMA
AREA                                                              • Excellent year, of consecutive growth with new developments, accompanied by
                                                                    investment in marketing and advertising (reinvesting margins)
                                                                  • Reorganization of business management after integration

       CONSUMER                                                    - Rethinking ranges in both product strategy and marketing

       HEALTHCARE                                                  - Working for a better balance of the product portfolio and greater geographical
                                                                     diversification
      Nutritional Supplements                                     • FP France: highlighted the good performance of its main market (+71% of the
      OTC                                                           sales of this line), which represented 35% growth

       26%                      46.3 M€
                                                                  • FP Iberia (Spain and Portugal) transferred under Reig Jofre Spain management
                                                                    to improve synergies and optimize growth in Spain

                                    +22%                    DISTRIBUTION OF PRODUCT
                                                            RANGES 2006-2018
                                                                                                                DISTRIBUCIÓN DE VENTAS
                                                                                                                POR PAÍSES 2018

 • The Consumer Healthcare area is integrated by:
                                                             76 %
                                                                                                                                4 1%
                                                                                                                                     1%
                                                                                                                                      %
                                                                                                                                      Africa
                                                                                                                                               Austria   Others

  - Reig Jofre's line of nutritional supplements, FORTÉ
    PHARMA marketed mainly in France, Belgium, Spain
                                                                  43%
                                                                                            2006    2018         10%       Iberia
                                                                                                                 (Spain & Portugal)
    and Portugal
  - OTCs marketed mostly in Spain                                                25%        19%
                                                                                                        13  %
                                                                                                                13%    Belgium
                                                                            10%        10%
                                                                                                   4%
                                                           Weight control   Energy      Health     Beauty             71%      France

                                                      NEW
                                                      DEVELOPMENTS
03
INTERNATIONAL PROGRESS

PHARMA
SECTOR
INTERNATIONAL PRESENCE
Sales 2018                                                41% Spain
                                                                                   48%Rest of
                                                                                                 11%
                                                                                                 Rest of
                                                                                      Europe     the world

                                             SWEDEN

                                   BELGIUM

                         UNITED KINGDOM

                             FRANCE

                         PORTUGAL

 70
 world countries
                           SPAIN

                                                                      SINGAPORE

   7 96M€
 Direct

                                                                      9.5%
 sales
                                                                          France
            countries
                                                                            Benelux
                                                                             Portugal 3   %

 130
                                                                               United Kingdom
                                      GEOGRAPHIC                                Singapore

 commercial partners
                                     DISTRIBUTION
                                       ASSOCIATES                              9.5%     Sweden

                                                78%   Spain
                                                                                                     11
International progress

     ANNIVERSARY

SALES BY GEOGRAPHICAL AREA

SALES DISTRIBUTION BY GEOGRAPHICAL AREA
IN 2018 181 M€

 11                                       41
                                                   • 3 new markets in 2018: Indonesia, Panama and South Korea

         %     REST OF THE
               WORLD                       %
                                           SPAIN
                                                   • The top 10 markets outside Spain in 2017 were:

         7% Asia                                    - France (17%)
                                                    - Sweden (7%)
         2% Africa
                                                    - United Kingdom and Ireland (5% respectively)
         1% America
                                                    - Benelux (3%)
         1% Oceania
                                                    - Japan, Germany and Greece (2% respectively)
                                                    - Portugal, Vietnam and Switzerland (1% respectively)

48
                                                   • Major growth in France (+52%), Benelux (+54%), Ireland (+36%)

       %     REST OF
             EUROPE
                                                     and Portugal (+16%)
                                                   • Spain grew by 2%, while sales in the rest of Europe grew
        17% France                                   by 25%
        7% Sweden
        5% Ireland                                 • It highlighted the significant evolution of Africa, which grew
        5% United Kingdom                            by 39% thanks to the sale of antibiotics and contributed 2%
                                                     in 2018
        3% Belgium
        11% Others                                 • Asia, Oceania and America accounted for 7%, 1% and 1% of total
                                                     sales, respectively

12
04
PROFIT AND LOSS ACCOUNT

                   PHARMA
                   SECTOR
Profit and loss account

     ANNIVERSARY

P&L                      PROFIT AND LOSS

                         Turnover

                         Procurements
                                                                                   2017

                                                                                 167.983

                                                                                 -63.971
                                                                                              2018

                                                                                            180.468

                                                                                            -70.267
                                                                                                          var 18/17

                                                                                                                 7%

                         Changes in inventories                                    -108       2.648              6%

SALES              +7%   Work carried out for fixed assets                         3.743      4.824            29%

180.5 M€
                         Other operating income                                    2.437        839           -66%

                         Personnel expenses                                      -49.355    -52.140              6%
                         Other operating expenses                                -44.941    -49.979             11%
                         Depreciation and amortization                            -6.829     -7.605             11%
                         Government grants for non-financial assets and others        65          40          -38%
EBITDA             +4%   Impairment and results on disposals                          -11      1.192

16.4 M€                  Operating Income
                         Financial income
                         Financial expenses
                                                                                   9.011
                                                                                      69
                                                                                  -1.077
                                                                                             10.020
                                                                                                  84
                                                                                                -776
                                                                                                                11%

                         Financial Result                                         -1.008       -692            -31%
PROFIT             +5%   Results from entities accounted by the equity method                   155
AFTER TAX                Profit before taxes                                      8.003       9.483             18%

9.3M€
                         Income Tax                                                 808        -231

                         Net Result                                                8.811      9.253              5%

                         EBITDA                                                   15.787     16.393              4%

14
Profit and loss account

                                                                                                                      ANNIVERSARY

Revenues
                                        PROFIT & LOSS ACCOUNT                                     2017       2018         var 18/17

                                        Turnover                                                167.983    180.468                  7%

                                        Procurements                                            -63.971    -70.267
                                        Changes in inventories                                    -108       2.648                  6%
TURNOVER
Growth in Consumer Healthcare + 22%     Work carried out for fixed assets                         3.743      4.824              29%
boosts Total Sales                      Other operating income                                    2.437        839             -66%

                                        Personnel expenses                                      -49.355    -52.140                6%
                                        Other operating expenses                                -44.941    -49.979               11%
R+D CAPITALISED                         Depreciation and amortization                            -6.829     -7.605               11%
                                        Government grants for non-financial assets and others        65          40            -38%
Growth in Development costs of
                                        Impairment and results on disposals                          -11      1.192
Innovative Products, 50% of total R+D
expenditures are capitalised
                                        Operating Income                                          9.011     10.020                  11%
                                        Financial income                                             69          84
                                        Financial expenses                                       -1.077        -776
OTHER OPERATING INCOME
                                        Financial Result                                         -1.008       -692              -31%
Accessory Income, Royalties and         Results from entities accounted by the equity method                   155
others are reduced because of new
distribution agreements terms           Profit before taxes                                      8.003       9.483              18%
                                        Income Tax                                                 808        -231

                                        Net Result                                                8.811      9.253                  5%

                                        EBITDA                                                   15.787     16.393                  4%

                                                                                                                                     15
Profit and loss account

      ANNIVERSARY

OPEX                                    PROFIT & LOSS ACCOUNT

                                        Turnover

                                        Procurements
                                                                                                  2017

                                                                                                167.983

                                                                                                -63.971
                                                                                                             2018

                                                                                                           180.468

                                                                                                           -70.267
                                                                                                                         var 18/17

                                                                                                                                7%

PERSONNEL EXPENSES                      Changes in inventories                                    -108       2.648              6%
Growth of +6%, main impact comes
from the strengthening of Salesforce    Work carried out for fixed assets                         3.743      4.824            29%
and Structure in Consumer Healthcare    Other operating income                                    2.437        839           -66%
and higher variable compensation
linked to sales performance.            Personnel expenses                                      -49.355    -52.140               6%
                                        Other operating expenses                                -44.941    -49.979              11%
OTHER OPERATING EXPENSES                Depreciation and amortization                            -6.829     -7.605              11%
                                        Government grants for non-financial assets and others        65          40           -38%
Increase of Marketing Expenses
                                        Impairment and results on disposals                          -11      1.192
associated to the Consumer Healthcare
line, growth of R+D expenses, and
                                        Operating Income                                          9.011     10.020             11%
containment in the rest of business.
                                        Financial income                                             69          84
                                        Financial expenses                                       -1.077        -776
DEPRECIATION
Impact of investment volume in          Financial Result                                         -1.008       -692            -31%
2017-2018, this effect will keep its    Results from entities accounted by the equity method                   155
impact in 2019-2020
                                        Profit before taxes                                      8.003       9.483             18%
                                        Income Tax                                                 808        -231
EMPLOYEES

        1056
                                        Net Result                                                8.811      9.253              5%

                               +82      EBITDA                                                   15.787     16.393              4%

16
Profit and loss account

                                                                                                                   ANNIVERSARY

Other
                                     PROFIT & LOSS ACCOUNT                                     2017       2018         var 18/17

                                     Turnover                                                167.983    180.468                  7%

Results                              Procurements
                                     Changes in inventories

                                     Work carried out for fixed assets
                                                                                             -63.971
                                                                                               -108

                                                                                               3.743
                                                                                                        -70.267
                                                                                                          2.648

                                                                                                          4.824              29%
                                                                                                                                 6%

                                     Other operating income                                    2.437        839             -66%
RESULTS FROM TANGIBLE
ASSETS                               Personnel expenses                                      -49.355    -52.140                6%
                                     Other operating expenses                                -44.941    -49.979               11%
Impact of +1,2 M€ due to the         Depreciation and amortization                            -6.829     -7.605               11%
reversion of Impairment losses on    Government grants for non-financial assets and others        65          40            -38%
industrial properties in Barcelona   Impairment and results on disposals                          -11      1.192

                                     Operating Income                                          9.011     10.020                  11%
                                     Financial income                                             69          84
FINANCIAL RESULT                     Financial expenses                                       -1.077        -776
Improvement +0,3 M€ as a result of
better financing costs, and less     Financial Result                                         -1.008       -692              -31%
impact of currency variations.       Results from entities accounted by the equity method                   155

                                     Profit before taxes                                      8.003       9.483              18%
                                     Income Tax                                                 808        -231
INCOME TAX EXPENSE
Significant impact of the R+D        Net Result                                                8.811      9.253                  5%
deduction on the effective rate,
which is around 14%                  EBITDA                                                   15.787     16.393                  4%

                                                                                                                                  17
05
BALANCE SHEET

PHARMA
SECTOR
Balance sheet

                                                                                 ANNIVERSARY

Assets
TOTAL CAPEX
                        ASSETS

+21.7 M€
                                                               2017      2018        var 18/17

                        Goodwill                             27.745    27.598              -146
                        Other Intangible assets              32.521     39.121           6.600
                        Property, plant and equipment        46.749    54.728            7.980
                        Non-current investments                605       1.167              561
INVENTORIES             Non-current financial investments       716       732                16

+7.0 M€
                        Deferred tax assets                  13.763    14.469               706

                        Total Non-Current Assets            122.099    137.815           15.716

                        Inventories                          27.509    34.563             7.053
TOTAL WORKING CAPITAL   Trade and other receivables           35.161   33.856            -1.305
                        Other current financial assets         3.273    2.687              -586

-1.5 M€                 Other current assets
                        Cash and cash equivalents

                        Total Current Assets
                                                              3.606
                                                             11.689

                                                             81.238
                                                                        2.485
                                                                        8.269

                                                                       81.860
                                                                                          -1.121
                                                                                         -3.419

                                                                                               622

CASH POSITION           Total Assets                        203.337    219.675          16.338

-3.4 M€
                                                                                                19
Balance sheet

       ANNIVERSARY

Investments
 INVESTMENTS 2018 +21.7M€                          ASSETS                                 2017      2018     var 18/17

             1,0 M€  Other
                                                   Goodwill
                                                   Other Intangible assets
                                                                                        27.745
                                                                                        32.521
                                                                                                  27.598
                                                                                                   39.121
                                                                                                                  -146
                                                                                                                6.600
4,8 M€R+D
                                                   Property, plant and equipment
                                                   Non-current investments
                                                                                        46.749
                                                                                          605
                                                                                                  54.728
                                                                                                    1.167
                                                                                                                7.980
                                                                                                                   561
                                                   Non-current financial investments       716       732            16
                                                   Deferred tax assets                  13.763    14.469           706

                                                   Total Non-Current Assets            122.099    137.815       15.716

                             15,9M€   Industrial
                                                   Inventories
                                                   Trade and other receivables
                                                                                        27.509
                                                                                         35.161
                                                                                                  34.563
                                                                                                  33.856
                                                                                                                 7.053
                                                                                                                -1.305
                                                   Other current financial assets         3.273    2.687          -586
                                                   Other current assets                  3.606     2.485         -1.121
 MAJOR PRODUCTIVE                                  Cash and cash equivalents            11.689     8.269        -3.419
 INVESTMENTS                                       Total Current Assets                 81.238    81.860          622
 • New Injectable Plant 7.5 M€
 • Serialization Directive Investment 3.2 M€       Total Assets                        203.337    219.675      16.338

 DEFERRED TAX ASSET
 Tax credits and deductions not posted
 amounts to more than 10 M€
Balance sheet

                                                                                                      ANNIVERSARY

Current Assets
CURRENT ASSETS                               ASSETS                                 2017      2018        var 18/17
Increase of 4M€ without considering
the reduction of Treasury, basically for     Goodwill                             27.745    27.598              -146
the increase of raw materials                Other Intangible assets              32.521     39.121           6.600
                                             Property, plant and equipment        46.749    54.728            7.980
                                             Non-current investments                605       1.167              561
                                             Non-current financial investments       716       732                16
CASH                                         Deferred tax assets                  13.763    14.469               706
Reduction of liquidity in -3,4 M€, keeping
                                             Total Non-Current Assets            122.099    137.815           15.716
a surplus of 8,3 M€
                                             Inventories                          27.509    34.563             7.053
                                             Trade and other receivables           35.161   33.856            -1.305
                                             Other current financial assets         3.273    2.687              -586
                                             Other current assets                  3.606     2.485             -1.121
                                             Cash and cash equivalents            11.689     8.269            -3.419

                                             Total Current Assets                 81.238    81.860                  622

                                             Total Assets                        203.337    219.675          16.338

                                                                                                                     21
Balance sheet

      ANNIVERSARY

Working Capital
WORKING CAPITAL                             Working Capital M€
40,6 M€, improvement of 1,5 M€
Represents 82 days of sales vs 92 days in
2017                                        2017                                       42.1
                                                                                                             -1.5 M€
INVENTORIES                                 2018                                      40.6
Increase in stocks due to the increase of
manufacturing levels previous to entry
into force European Directive UE 2011/62
on February 9, 2019                         Working Capital Breakdown M€

                                                          34.6     35.2
                                                   27.5                    33.9
TRADE RECEIVABLES
Improvement of receivables management,
despite of the sales increase
                                                                                                            3.4
                                                                                      Trade Payables
                                                                                                                    2.1

                                                    Inventories   Trade Receivables                    Others Curr. Assets/Liab
SUPPLIERS
Increase as a consequence of inventories
raise on Q4, allows to balance working       2017          2018
capital needs                                                                         -24.0
                                                                                              -29.9
Balance sheet

                                                                                         ANNIVERSARY

Liabilities        EQUITY AND LIABILITIES

                   Total Equity
                                                                      2017

                                                                    141.559
                                                                                 2018

                                                                               149.740           8.180

                   Capital grants                                       145        105             -40
CAPITAL INCREASE
                   Provisions                                          682         803              121

0.5 M€             Financial liabilities with credit institutions
                   Financial lease leabilities
                   Other financial liabilities
                   Deferred tax liabilities
                                                                     9.479
                                                                      7.613
                                                                     6.098
                                                                     3.294
                                                                                 7.020
                                                                                14.036
                                                                                 5.683
                                                                                 3.242
                                                                                                -2.459
                                                                                                 6.423
                                                                                                  -416
                                                                                                    -51

FINANCIAL DEBT     Total Non-Current Liabilities                     27.311    30.889            3.578

32.7 M€            Provisions
                   Financial liabilities with credit institutions
                   Financial lease leabilities
                                                                        245
                                                                      4.729
                                                                       1.351
                                                                                    45
                                                                                3.649
                                                                                 1.536
                                                                                                   -199
                                                                                                -1.079
                                                                                                    185
                   Other financial liabilities                           717      808                91
                   Trade and other payables                          23.975     29.911           5.936
                   Current tax liabilities                              972        902              -70
                   Other Current liabilities                          2.478      2.194            -284

                   Total Current Liabilities                        34.467     39.047            4.580

                   Total Equity and Liabilities                     203.337    219.675          16.338

                                                                                                       23
Balance sheet

      ANNIVERSARY

Scrip Dividend 2018
CAPITAL INCREASE                                 EQUITY                                                        2017      2018
Issuing and subscription of 896.889 new
shares against reserves, 1,5% of total capital   Share Capital                                               32.077     32.525          448
                                                 Reserves                                                   102.482    110.183         7.701
                                                 Treasury stock                                                -703       -900          -197
                                                 Other equity instruments                                         19         34           14
CASH DIVIDEND PAYMENT                            Profit attributable to the parent company                    8.811      9.266           455
Option chosen by 12,9% of Capital                Exchange differences                                         -1.110     -1.193          -83
                                                 Other comprehensive income for assets available for sale         12       -115         -127

                                                 Equity attributable to parent company                      141.588    149.799         8.211
TREASURY STOCK                                   Non-controlling interests                                      -28        -59            -31
Stock purchase of 80.000 shares in 2018
accordingly Flexible Compensation Plan           Total Equity                                               141.559    149.740         8.180
for Managers.
Self owned shares: 0,45% of total

24
Balance sheet

                                                                                                                 ANNIVERSARY

Financial Debt
INCREASE OF FINANCIAL DEBT                 EQUITY AND LIABILITIES                             2017       2018

+2.7 M€                                    Total Equity

                                           Capital grants
                                                                                            141.559

                                                                                                145
                                                                                                       149.740

                                                                                                           105
                                                                                                                         8.180

                                                                                                                           -40
                                           Provisions                                          682         803              121
TOTAL FINANCIAL DEBT                       Financial liabilities with credit institutions    9.479       7.020          -2.459

32.7M€
                     Long-term             Financial lease leabilities                        7.613     14.036           6.423
                     Financial Debt 26,7   Other financial liabilities                       6.098       5.683            -416
                     Short-term            Deferred tax liabilities                          3.294       3.242              -51
                     Financial Debt 6,0
                                           Total Non-Current Liabilities                     27.311    30.889            3.578

DEBT SERVICING 2018                        Provisions                                           245         45             -199

-3.4 M€
                                           Financial liabilities with credit institutions     4.729     3.649           -1.079
                                           Financial lease leabilities                         1.351     1.536              185
                                           Other financial liabilities                           717      808                91
                                           Trade and other payables                          23.975     29.911           5.936
                                           Pasivos por impuestos corrientes                     972        902              -70
                                           Current tax liabilities                            2.478      2.194            -284
INCREASE IN FINANCIAL LEASES
debt, linked to the new Barcelona Plant    Total Current Liabilities                        34.467     39.047           4.580
and Investments in Compliance with the
Serialization Directive                    Total Equity and Liabilities                     203.337    219.675         16.338

                                                                                                                               25
Balance sheet

     ANNIVERSARY

Net Debt/
EBIDTA
                                        Financial Debt M€

                                                    32.7
                                            30.0
                                                                                     24.5           2017
TOTAL NET DEBT                                                                18.3

24.5 M€                                      Financial Debt
                                                                  Cash

                                                                             Net Financial Debt
                                                                                                    2018

                                                                      -8.3
DEBT/EBITDA                                                   -11.7

1.5 X                  NET FINANCIAL DEBT

                       Financial Debt
                                                                                    2017

                                                                                 29.986
                                                                                                   2018

                                                                                                  32.732
                                                                                                                  var

                                                                                                               2.746
                       Treasury                                                  -11.689          -8.269       3.419
AVERAGE TIME OF DEBT

3.3 YEARS
                       Net Debt                                                  18.297           24.462       6.165

                       Net Debt / EBIDTA                                             1,16           1,49

26
06
NOTES FOR THE FUTURE

               PHARMA
               SECTOR
Balance sheet

     ANNIVERSARY

STRATEGIC FOCUS BY
BUSINESS AREA                                                             PHARMACEUTICAL   SPECIALTY   CONSUMER
                                                                          TECHNOLOGIES     PRODUCTS    HEALTHCARE

                   Historical commitment to development.
 R&D               Investment of 5% of the turnover.
                   Developments in medicines or medicines,
                   Innovators or Generics Chemical or
                   Biological

                   Industrial commitment in specialized
 PRODUCTION        technologies.
                   4 production plants (3 in Spain -Antibiotics,
                   injectables and lyophilized- and 1 in Sweden -
                   Topical dermatological products).

 MARKETING         Direct presence in 7 markets (Spain, France,
                   Portugal, Benelux, United Kingdom, Nordic
 & SALES           countries, Singapore).
                   Indirect presence through distributors and licensees
                   (+130 partners) in more than 60 countries.

28
Balance sheet

                                                                                                  ANNIVERSARY

                             STRATEGY IN THE MANAGEMENT
                             OF THE BUSINESS CYCLE
                             Reig Jofre has the ambition to develop innovative

                   1
                             specialty products that add value to the patient’s health,
                             to the doctor or to the health systems and that could be
                             marketed worldwide.

                                        2
                 CONSUMER
                HEALTHCARE

                               PHARMACEUTICAL
                                TECHNOLOGIES
                                                                                          3
                                                                                      SPECIALTY
                                                                                      PRODUCTS
STRATEGY IN PHARMACEUTICAL TECHNOLOGIES
Antibiotics and Injectables / freeze-dried

1        DEMAND CREATION
         (products, markets,
                                                     2    CONSTRUCTION
                                                          OF PRODUCTIVE
                                                                                                 3    SALES AND
                                                                                                      PROFITABILITY
         distributors)                                    CAPACITY
    Systematic focus during the last years           Industrial investments                      Profitability phase following RJF business
                                                                                                 models
    Product:                                         Capacity:
    • Alliances with biotech startups in             • Increasing available capacity             Own markets:
      development phase                              • Maintaining flexibility in batch sizes    • Capturing 100% of the value
    • Multinationals with specific needs             Quality:                                    • Synergies with sales networks and local
      (injectables)                                                                                structures
                                                     • Compliance with quality standards
    • Investment in project for the development        beyond Agency and customer                Distribution:
      of Biosimilars (gateway to access other          requirements                              • Sale with RJF brand
      companies in this field)
                                                     • Minimize human intervention in critical   • Margin on transfer price including
    • Systematic development of products that          phases                                      manufacturing cost
      lose patent
                                                     • Access a product with a higher price      Licensees:
    Markets:                                           and added value                           • Sale with own or partner's brand
    • Regulatory approvals in Europe, Japan          Productivity:
      (2017), Indonesia (2018), USA, Asia Pacific,                                               • Industrial margin over manufacturing price
      Africa.                                        • Automated processes                       • Trade margins in the shared destination
    • Own registration team                          • Large lots, economies of scale,             market
                                                       cost efficiency
    Partners:
                                                     • Margins
    • Investment in continuing to grow in the
      more than 130 international partners

30
Balance sheet

INVESTMENT PLAN
                                                                                                                                ANNIVERSARY

IN RJF BARCELONA 2018-2020
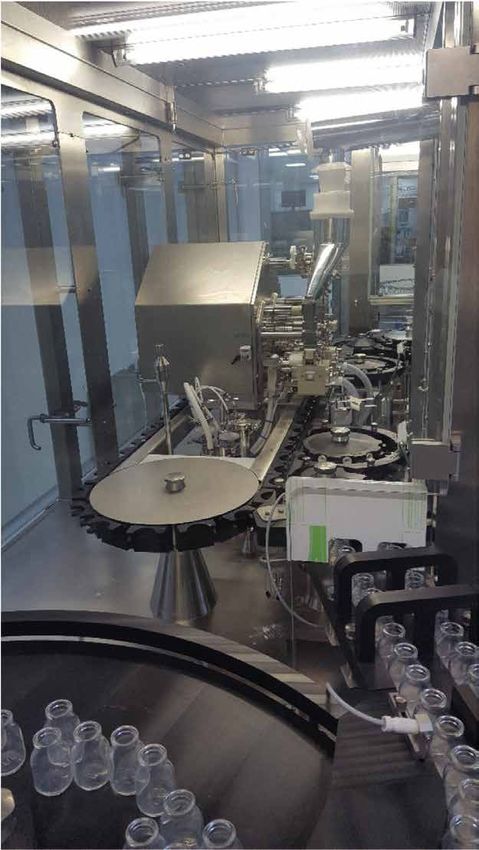
    EXTENSION PLANT OF STERILE
    INJECTABLES
    · Investment: € 30M
    • Financing: bank debt (80% max.), rest own
      resources
    • Operational plant in S2-2020

                                                  Increasing aseptic production capacities     Quality
                                                  · +50 M vials at full capacity (vs. 15M in   · Isolator technology and automatic loading
                                                    2016 and 3.5M in 2008)                       / unloading of lyophilizers guarantees the
                                                  • Access to large volume markets               critical phases of aseptic production
                                                    (USA, Indonesia, Korea ...)                  without human contact
                                                                                                - Minimizes contamination risk
                                                  Productive efficiencies
                                                  • 20% increase in expected global            • Products possibility of
                                                    productivity                                - biological or chemical basis
                                                                                                - innovative or out of patent
                                                  Demand created
                                                                                                - research or comercial purposes
                                                  • Products in international registration
                                                    process
                                                                                               Energy Efficiencies
                                                  • Direct distribution or under closed
                                                                                               • Contribution to a cleaner and more
                                                    distribution agreements
                                                                                                 sustainable economy thanks to the design
                                                                                                 of the new plant with energy efficiency
                                                                                                 criteria
                                                                                                                                              31
INVESTMENT PLAN
IN RJF TOLEDO 2016-2018
  INVESTMENT
  · € 10M for new sterile injectable antibiotic line
    and expansion space for a future second line
  • Operational in 2019.

                                                       · Current plant close to 100% capacity (produces 15%
                                                         of the antibiotics units consumed in Spain and 25%
                                                         of the penicillin derivatives - beta-lactam -)

                                                       • Investment needed to access new markets that are
                                                         in registration process

                                                       • 33% increase capacity of (sterile injectable
                                                         penicillin), to reach 25M vials per year

                                                       • Greater volume allows absorbing expenses of both
                                                         quality and administrative structure and optimizing
                                                         unit margins

                                                       • The cutting-edge technology of the new line allows
                                                         access to markets with higher profitability

                                                       • RJF entry model in the USA will allow the capture of
                                                         industrial (similar to Europe) and commercial (above
                                                         Europe) margins

32
Balance sheet

                                                                                                    ANNIVERSARY

R&D INVESTMENTS                                           PHARMACEUTICAL
                                                          TECHNOLOGIES

                                           56     %
                                                              Injectables / Lyophilized
                                                              Antibiotics

                                         R&D Investment

                 SPECIALTY
                                           5   %
                                               sales
                                                                                      CONSUMER
                 PRODUCTS                                                             HEALTHCARE

                  Dermatology
                                    30
                                     %                           14        %
                                                                                      Forté Pharma
                Skin, Hair, Nails                                                     ENT
                   Gynecology                                                         Topical disinfection
                Women's Health

                                                                                                                  33
PHARMACEUTICAL TECHNOLOGIES
PIPELINE

                               PRODUCT                             DESCRIPTION

                                                                   Syna Therapeutics
             INNOVATIVE        Biosimilar                          (Joint Venture: RJF & LeanBio)
              + Innovation
                     + Risk    Acinetoclinic Vaccine               First vaccine against resistance to
                               injectable lyophilized              A. Baumannii
          + Collaborations
                + Potential    P0512                               Mucoadhesive nanoformulation
                    return     beta-lactam antibiotic              of antibiotic against H.Pylori

                 GENERIC       6 projects of freeze-dried antibiotics, injectables and injectables under
              - Innovation     development in 2018.
                      - Risk   • 4 in phase of registration at the year-end
                  + Specific
             opportunities     Aseptic production specialist
                 by market
                 + In-house
            developments
         = Potential return

34
Balance sheet

STRATEGY IN SPECIALTY PRODUCTS
                                                                                                                                     ANNIVERSARY

Dermatology and Gynecology

 1       PORTFOLIO
         GENERATION
                                               2       INVESTMENT IN R&D
                                                       Development with scientific
                                                                                                    3      SALES AND
                                                                                                           PROFITABILITY
         Innovation                                    evidence                                            Value proposal

 Balanced portfolio:                           Areas of expertise:                                  Medical-marketing proposal
 • Risk / Investment / Time                    • Skin / nails / hair                                • Strategy adapted to each market / Country
 • Radical / Incremental                       • Gynecology / women's health
                                               • With special focus on infections                   Commercial teams in 7 markets:
 • Science / Value proposition
                                                                                                    • Visit to medical specialists
 • Internal / External
                                               Prescription-Recommendation:                         • Pharmacies
                                               • Medicines with indication                          • Key Account Managers, hospitals
 Regulatory strategy and Market Access:
                                               • Borderline products between specialist and
 • Medical-marketing proposal                    consumer                                           Markets:
 • Medicines, health products, cosmetics and   • Solid value proposition                            • International sales with RJF brand in its
   nutritional supplements.                                                                           own markets
                                               Flexible team oriented to create value:              • Distributors in non-owned markets
 Open and collaborative innovation:
                                               Specialized development in all sites
 • Connection with the health ecosystem        • Galenica and analysis
 • Collaborations with academic centers,       • Clinical and pre-clinical
   hospitals and Start-Ups Biotech allow       • Regulator
   different models of co-development.
 • International innovation hubs               Investments in concept tests:
                                               • In vitro and in vivo assays to validate activity
                                               • Clinical trials
                                                                                                                                                   35
Balance sheet

       ANNIVERSARY

SPECIALTY PRODUCTS
KEY R&D EVENTS IN 2018
Dermatology / Gynecology

MILESTONES IN CLINICAL TRIALS

Clinical trials started in 2018:
· P0285: Nail regenerator
• P0283: Nutritional Supplement for
  men to improve the fertility ratio
  and prevent repeated abortions

Finalized Recruitment:
· P0265: Treatment for skin
  infections

Clinical trials in progress:

36
SPECIALTY PRODUCTS
PIPELINE
                                                       PRODUCT AND DESCRIPTION

                                      MEDICINES        3 projects

                                       + Innovation
                                                       Skin, hair and nail conditions
                                              + Risk
                                   + Collaborations
                                 + Potential return    3 in collaboration

               MEDICAL DEVICE, NUTRITIONAL
                                                       8 projects
                  SUPPLEMENTS, COSMETICS
                                       + Innovation
                                              + Risk   3 women's health and reproduction
                                    + Collaboration
                                 + Potential return
                                                       4 Skin, hair and nail conditions

                           GENERIC MEDICINES           5 collaborations
                                       - Innovation
                                              - Risk   3 projects
                + Specific opportunities by market
                          + In-house developments
                                 = Potential return    Skin conditions

                                                                                           37
Balance sheet

     ANNIVERSARY

STRATEGY IN CONSUMER HEALTHCARE
Nutritional supplements / OTC

      SITUATION                                    WHAT RJF SHOULD OFFER IN THE CONSUMER HEALTH MARKET
      • Health market vs. market of the disease    • Trusted brands for the consumer                · Ability to identify trends and launch
      • Consumers are well informed and            • Product with scientific-technical basis          products quickly
        concerned about health care and              (clinical support, whether regulatory or        - Natural alternative to medicines:
        prevention                                   not)                                              efficacy without any risk of side
      • The scientific / technical knowledge we    • Clear value proposition for the consumer          effects
        have of both the disease market and the     - and eventually also for a possible
        prescriber opens the opportunity for RJF      prescriber - physicians or new health
        to transfer that model to the health and      prescribers, physiotherapist, osteopath ...
        consumption market

38
Balance sheet

                                                                                                   ANNIVERSARY

CORPORATE DEVELOPMENT

     · Active policy to identify non-organic   · Search in areas of specialty products and Consumer
       growth opportunities                      Healthcare

     • Incorporation of businesses with          - Consolidation of presence in existing markets (Spain,
       strategic fit and adequate cash             France, Nordic countries and United Kingdom)
       generation avoiding overpricing           - Opportunities in other strategic markets

                                               · Second priority: acquisition of industrial businesses
                                                 specialized in other pharmaceutical technologies

                                                                                                                 39
07
SHAREHOLDERS BASE

PHARMA
SECTOR
Shareholders base

                                                                                                                                                  ANNIVERSARY

SHAREHOLDERS                              REIG JOFRE
                                          INVESTMENTS, S.L.
BASE
                                                                                                                                                    72%
                                          Investment company of the Reig family

at 31/12/2018

                                                                    11.8%
                                          NATRA, S.A.*

                                                                      15.7%
                                          FREE-FLOAT

                                                                    0.5%
                                          TREASURY STOCK
                                                                                              *Food company, quoted on the main market of the Spanish stock Exchange.
                                                                                               Former controlling shareholder in Natraceutical.

RJF initiatives to increase the   3,500

free float:
                                  3,250
· During 2018 the free float
  increased by 6.4% (from 14.7%   3,000
  to 15.7%)
• During 2017, the free float     2,750

  increased by 8.2% (from 13.5%
                                  2,500
  to 14.7%)
                                  2,250

                                  2,000
                                          JAN       FEB       MAR        APR      MAY   JUN    JUL        AUG        SEP       OCT        NOV      DEC      JAN ‘19

                                                                                                                                                                41
ANNIVERSARY

LINKS TO ADDITIONAL INFORMATION

                   Last news:
                   www.reigjofre.com/en/news

                   Webcast of results:
                   www.reigjofre.com/en/investors/webcasts

                   Subscription Center:
                   www.reigjofre.com/en/subscription-center

42
ANNIVERSARY

Av. de les Flors
08970 Sant Joan Despi
Barcelona, Spain
T. +34 93 480 67 10
www.reigjofre.com
Relationship investors
investors@reigjofre.com
You can also read