CREATING THE WORLD'S PREMIER DEVELOPER AND OPERATOR OF FLAGSHIP SHOPPING DESTINATIONS - DECEMBER 12, 2017
←
→
Page content transcription
If your browser does not render page correctly, please read the page content below
CREATING THE WORLD’S PREMIER DEVELOPER AND OPERATOR
          OF FLAGSHIP SHOPPING DESTINATIONS
                  D E C E M B E R 1 2, 2 0 1 7
4

    UNIBAIL-RODAMCO TO ACQUIRE WESTFIELD

        TO CREATE THE WORLD’S PREMIER
           DEVELOPER AND OPERATOR
      OF FLAGSHIP SHOPPING DESTINATIONS

                                          2
TRANSACTION HIGHLIGHTS

                         3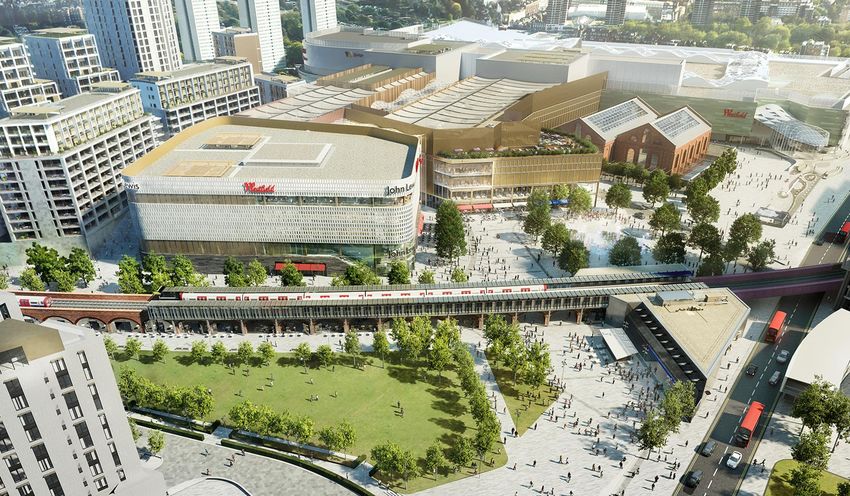
WESTFIELD: A NATURAL EXTENSION OF UNIBAIL-RODAMCO’S STRATEGY
OF CONCENTRATION, INNOVATION AND DIFFERENTIATION

Adds attractive                                                              Provides a unique                                                            Strong cultural                                                    Adds €4.9 Bn(2)
new markets:                                                                 platform                                                                     and strategic                                                      development pipeline
London and                                                                   of iconic shopping                                                           similarities                                                       of iconic projects
the wealthiest                                                               destinations
markets in the US

• Extends footprint with flagship                                            • 35 shopping centres, of which                                              • Successful history as                                            • Embedded long-term organic
  assets in the most dynamic                                                   17 flagships (85% of GMV(1))                                                 developer and investor                                             growth potential:
  and attractive markets                                                                                                                                                                                                       projects to add 1 Mn m² GLA
                                                                             • Highly experienced                                                         • Focused on concentration,
• Expansion into London                                                        management team in place                                                     innovation and differentiation                                   • Flexibility: 20% of projects
  enhances Unibail-Rodamco’s                                                                                                                                                                                                   committed
  European leadership position                                               • Acclaimed developer of iconic                                              • Great talent pool
                                                                               and innovative retail destinations                                                                                                            • New leading market: Milan
• Creates the world’s leading
  platform for global retailers                                              • Best fit with Unibail-Rodamco’s                                                                                                               • Extends London leadership:
                                                                               strategy                                                                                                                                        Croydon

                                                                                                                                                                                                                             • Target 7 to 8% yield on cost

(1) Proportionate GMV (Unibail-Rodamco definition) of €18.1 Bn as of June 30, 2017. See glossary for definition
(2) Proportionate total investment cost (Unibail-Rodamco definition) as of June 30, 2017 adjusted for deliveries achieved in H2-2017. Based on Unibail-Rodamco’s view of Westfield’s pipeline. See glossary for definition                              4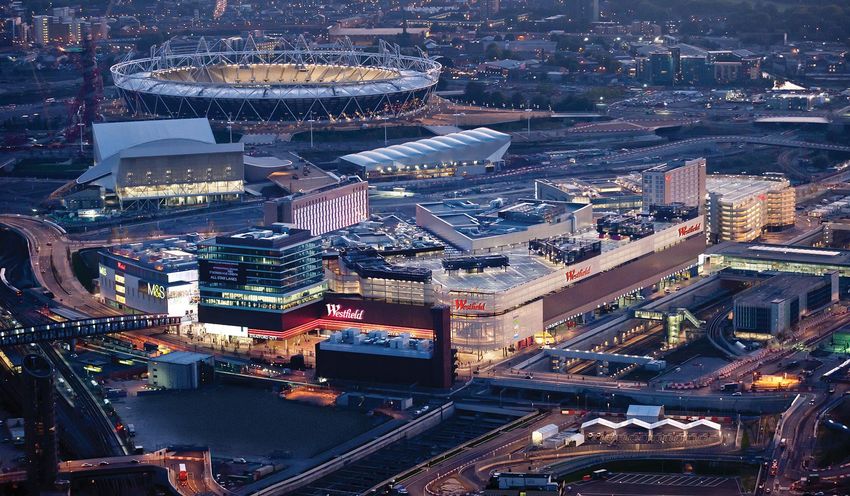
CREATING THE WORLD’S PREMIER DEVELOPER AND OPERATOR
OF FLAGSHIP SHOPPING DESTINATIONS

                      One brand :                                                                                                                        One platform for brand ventures

                      One strategy                                                                                                                       €12.3 Bn(2) flexible pipeline
                      flagship shopping destinations

                                                                                                                                                         3,700 professionals
                      €61.1 Bn combined GMV(1)
                                                                                                                                                         REPS accretive(3)
                      56 flagship assets                                                                                                                 from first full year

                      27 capital cities                                                                                                                  “A” category rating expected(4)

                      1.2 Bn+ visits annually                                                                                                            Strong balance sheet
(1) Proportionate GMV (Unibail-Rodamco definition) as at June 30, 2017. €43.0 Bn for Unibail-Rodamco and €18.1 Bn for Westfield, respectively
(2) Proportionate total investment cost as per Unibail-Rodamco’s definition. Figures as of June 30, 2017, adjusted for deliveries achieved in H2-2017. €7.4 Bn for Unibail-Rodamco and €4.9 Bn for Westfield, based on Unibail-Rodamco’s view
    on Westfield’s pipeline
(3) For Unibail-Rodamco shareholders. Source: Unibail-Rodamco
(4) Source: Unibail-Rodamco                                                                                                                                                                                                                     5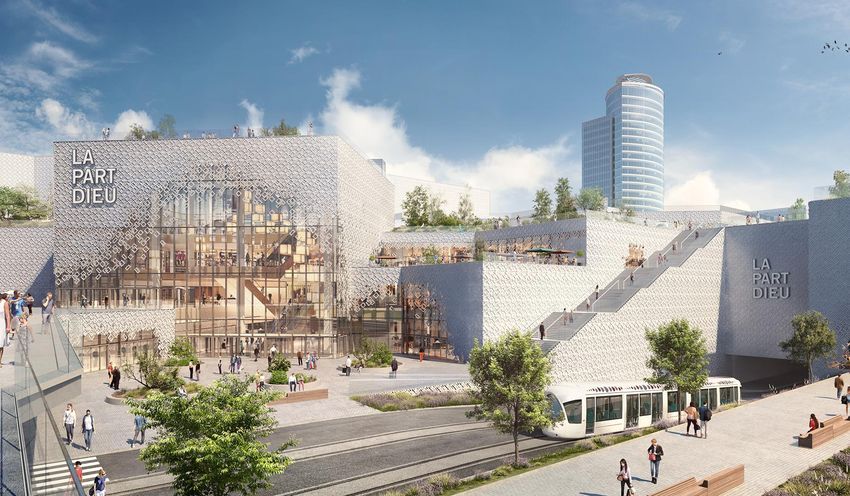
CREATING THE WORLD’S PREMIER DEVELOPER AND OPERATOR
OF FLAGSHIP SHOPPING DESTINATIONS

                United States                                                                                             Continental Europe and London

                                                     Unibail-Rodamco and Westfield
                                                     shopping centres in leading capital cities
     Unibail-Rodamco regions                              Standing flagship assets
     Westfield regions                                    Brownfield developments

                                                         104 shopping centres(1) - 84% of combined GMV(2) in flagships
(1) Based on number as of June 30, 2017, adjusted for disposals and deliveries achieved until December 1, 2017
(2) Proportionate GMV of flagships as a percentage of total shopping centres of the combined entity as of June 30, 2017                                   6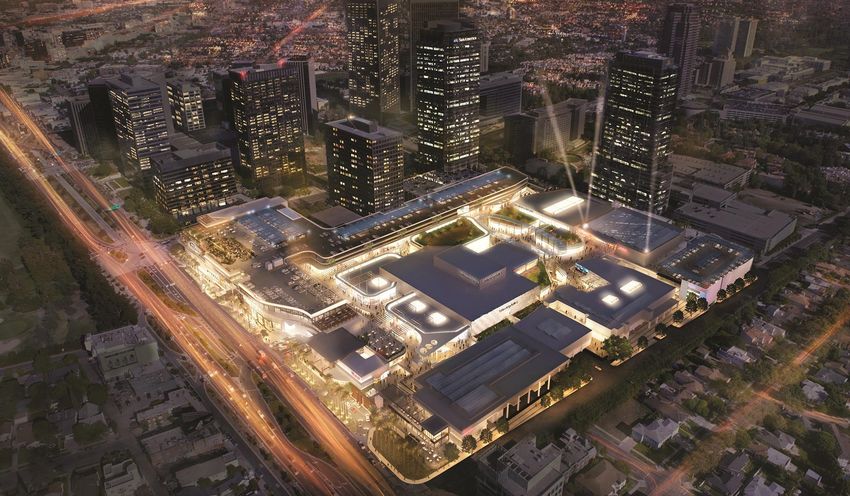
KEY TRANSACTION TERMS

                                             • For each Westfield security:                                                                                                                         • Lowy family fully supportive, intends to maintain a
                                                                                                                                                                                                      substantial investment in Unibail-Rodamco
                                                    0.01844x Unibail-Rodamco shares(1)                                                                     FRIENDLY
                                                    + US$2.67 in cash                                                                                        AND                                    • Unanimous recommendation by Unibail-Rodamco’s
                                                                                                                                                         RECOMMENDED                                  Supervisory Board and Westfield’s Board of Directors(5)
                                             • Implied mix: 65% scrip, 35% cash
     OFFER TERMS                                                                                                                                             DEAL                                   • Two Westfield representatives to join Unibail-Rodamco’s
                                             • Implied price per security: US$7.55                                   (AU$10.01)(2)                                                                    Supervisory Board, including Peter Lowy
                                                    • 17.8% premium(2) to spot price
                                                    • 22.7% premium(2) to 3-month US$ VWAP

                                             • Implied Westfield enterprise value(3): US$24.7 Bn                                                                                                    • Listing on Euronext Amsterdam and Paris
                                                                                                                                                                  LISTING                           • Secondary listing in Australia: CDIs(6)

                                             • 38.7 Mn Unibail-Rodamco shares(1) to be
                                               issued + US$5.6 Bn in cash
        FINANCING                            • Cash portion to be refinanced with senior bonds,                                                                                                     • Westfield’s retail technology platform to be spun-off
                                               hybrid debt securities and proceeds                                                                                                                    to Westfield security holders prior to Transaction closing
                                               from disposals
                                                                                                                                                                                                    • Group to retain a 10% interest in OneMarket

        Increased Unibail-Rodamco stock appeal: enlarged pro forma market cap of €31.1 Bn(4) and increased liquidity

(1) Comprising Unibail-Rodamco shares and shares in a new Dutch REIT to be formed which, at closing, will be stapled together and will trade as a single security. Refer to structure details further in the presentation
(2) Based on exchange rates and share prices as of December 11, 2017 closing. Unibail-Rodamco share price reference is €224.1 (US$ 264.5). Reference Westfield price and 3 month VWAP of US$6.41 (A$ 8.50) and US$ 6.15 (A$ 7.94), respectively. VWAP: Volume Weighted Average Price
(3) One a proportionate basis
(4) Based on 38.7 Mn shares issued to Westfield securityholders and Unibail-Rodamco closing price of December 11, 2017
(5) In the absence of a Superior Proposal and subject to an Independent Expert concluding that the Transaction is in the best interests of Westfield securityholders
(6) Chess Depository Interests                                                                                                                                                                                                                                              7
WESTFIELD: UNPARALLELED PLATFORM
 OF ICONIC SHOPPING DESTINATIONS

                                   8
PLATFORM OF ICONIC SHOPPING DESTINATIONS IN WEALTHY MARKETS

 Seattle                                                    Chicago                           Connecticut
Southcenter                                                Old Orchard*                       Trumbull
                                                                                              Meriden

 San Francisco Area
Roseville                                                                                     New York Area
San Francisco*
Valley Fair*                                                                                  World Trade Center*
Oakridge*                                                                                     Garden State Plaza*
                                                                                              South Shore
                                                                                              Sunrise

 Los Angeles Area                                                                             Washington Area
Century City                                                                                  Annapolis*
Culver City                                                                                   Montgomery*
Fashion Square                                                                                Wheaton                    London                                   Milan
Santa Anita
Topanga*                                                                                                                Westfield London*                        Westfield Milan
Palm Desert                                       San Diego Area                 Florida                                Westfield Stratford City*
Valencia*                                        UTC*                           Brandon                                 Croydon
                                                 Horton Plaza                   Broward
                                                 Mission Valley*                Citrus Park
                                                 North County*                  Countryside
                                                 Plaza Bonita                   Sarasota*                           Flagship assets                 *Extension planned(1)
                                                                                Siesta Key*                         Regional assets                 Greenfield / brownfield

                                                              35 assets with GMV(2) of €29.3 Bn, of which 17 flagships
(1) Excluding residential projects
(2) At 100% as of June 30, 2017, based on Unibail-Rodamco definition of GMV                                                                                                   9
IN THE WEALTHIEST CITIES

 GDP / Capita as % of national average

         175%
                                         154%                            146%                            144%                            142%                          141%                 133%              126%       117%

       San Jose                   San Francisco                          Seattle                        London                 Washington D.C.                       New York             Los Angeles        San Diego   Chicago
                                                                                                                                    Area                               Area

         VALLEY FAIR                     SAN FRANCISCO                   SOUTHCENTER                    STRATFORD CITY                   ANNAPOLIS                   WORLD TRADE CENTER     CENTURY CITY      UTC        OLD ORCHARD
                                         CENTRE

         OAKRIDGE                                                                                       LONDON                           MONTGOMERY                  GARDEN STATE PLAZA     CULVER CITY

                                                                                                                                                                                            FASHION SQUARE

                                                                                                                                                                                            SANTA ANITA

                                                                                                                                                                                            TOPANGA
                                                                                                                                                                                            & THE VILLAGE

                                                             85% of GMV(1) in flagship assets in the most affluent cities
Sources: OECD, Brookings and JPMorgan Chase. US national average of GDP per capita (in €’000) of 47.3 and UK national average of GDP per capita (in €’000) of 35.0
(1) On a proportionate basis                                                                                                                                                                                                    10
WORLD FAMOUS, ICONIC SHOPPING DESTINATIONS
LONDON
Opened
2008
Footfall
28 Mn
GLA
172,000 m²
Extension GLA
82,000 m²
Westfield share
50%
Total retail sales
€1,215 Mn
Anticipated
completion
Q1-2018
Note: all data as of December 31, 2016 11WORLD FAMOUS, ICONIC SHOPPING DESTINATIONS
STRATFORD CITY
Opened
2011
Footfall
46 Mn
GLA
175,000 m²
Westfield share
50%
Total retail sales
€1,400 Mn
Note: all data as of December 31, 2016 12WORLD FAMOUS, ICONIC SHOPPING DESTINATIONS
CENTURY CITY
Re-Opened
2017
Footfall(1)
18 Mn
GLA
127,000 m²
Expected
retail sales(1)
€1,000 Mn
(1) Estimated data for completed centre 13WORLD FAMOUS, ICONIC SHOPPING DESTINATIONS
WORLD TRADE CENTER
Opened
2016
GLA
27,000 m²
Extension GLA
7,000 m²
Anticipated
completion
2019
14TOP QUALITY FLAGSHIP ASSETS IN THE US AND LONDON
Portfolio by geography(1) Portfolio by asset type(1)
15%
25%
GMV at 100%:
€18.1 Bn €29.3 Bn €18.1 Bn
75%
85%
United States Flagship
United Kingdom(2) Regional
(1) Proportionate GMV. Includes investments in shopping centres, assets under construction, assets held for redevelopment and inventory
(2) Includes project in Milan at cost 15ATTRACTING DIFFERENTIATING RETAILERS
Luxury Dining E-Tailers
16STRONG OPERATING PERFORMANCE
Key figures as of June 30, 2017(1) Like-for-like NPI CAGR since 2014(2)
L12M Net Property Income (€ Mn) 763
4.8%
L12M FFO (€ Mn) 643
4.0%
Specialty retail sales (€/m2) – Flagship 8,863
Specialty retail sales (€/m2) – Group 7,164
Small Units OCR (%) – Flagship 15.3
Small Units OCR (%) – Group 15.0
Vacancy (%) – Flagship 4.7
Vacancy (%) - Group 6.1
Flagship Group
Source: Company’s filings
(1) Based on Westfield disclosure. Proportionate, unless otherwise stated
(2) Year of implementation of the restructure. CAGR computed based on disclosed like-for-like growth for each interim period until H1-2017 17GROWTH POTENTIAL FROM FLAGSHIP DEVELOPMENT PIPELINE
By commitment level(1) By region(1)
20%
28%
39% 38%
€4.9 Bn €4.9 Bn
41%
34%
Committed projects United Kingdom
Controlled projects United States(2)
Secured exclusivity projects Italy
Note: proportionate total investment cost as per Unibail-Rodamco’s definition as of June 30, 2017, adjusted for H2 deliveries (UTC and Century City)
(1) Breakdown based on proportionate total investment costs, as per Unibail-Rodamco's definition
(2) Extension and renovation only 18RECENT SUCCESSFUL DELIVERIES
Extensions and renovations
UTC CENTURY CITY
Additional GLA Additional GLA
37,400 m² 45,700 m²
Westfield share Westfield share
50% 100%
Opened(1) October 14, 2017 Opened October 3, 2017
(1) Nordstrom opening. Other retailers progressively opening through Q4-2017 19UNIBAIL-RODAMCO + WESTFIELD:
CREATING THE WORLD’S PREMIER
DEVELOPER AND OPERATOR
OF FLAGSHIP SHOPPING DESTINATIONS
20CREATING THE WORLD’S PREMIER DEVELOPER AND OPERATOR
OF FLAGSHIP SHOPPING DESTINATIONS
1 2 3 4 5
Global leader, Governance
Significant value
strategically Unique portfolio Rental growth and management
creation through
positioned of iconic shopping and pipeline to combine the
operating and cost
in the world’s best centres to drive earnings best of two industry
synergies
cities leaders
211 GLOBAL LEADER WITH PREMIUM QUALITY PORTFOLIO
As of June 30, 2017 Unibail-Rodamco Westfield Pro forma
GMV(1) €43.0 Bn €18.1 Bn €61.1 Bn
Pipeline(2) €7.4 Bn €4.9 Bn €12.3 Bn
# of countries(3) 11 2 13
# of shopping centres(4) 69 35 104
Average footfall per flagship asset (Mn)(5) 15.2 16.9 15.7
6% United States
Portfolio by segment(1) 7% Portfolio by region(1) 22%
United
€61.1 Bn France €61.1 Bn Kingdom(7)
7%
Shopping centres 37%
Offices Central
Europe
C&E(6) 87% 8%
The Netherlands
(1) Proportionate GMV. Includes investments in shopping centres, assets under construction, assets held for redevelopment and inventories 3% Germany
(2) Proportionate total investment costs (Unibail-Rodamco’s definition) as of June 30, 2017 adjusted for deliveries. Westfield: Unibail-Rodamco’s view of Westfield’s pipeline.
Austria Spain Nordics 6%
(3) Standing assets only, excluding assets under development as of June 30, 2017
(4) Based on H1-2017 number, adjusting for disposals and deliveries occurred until December 1, 2017 4% 6% 6%
(5) Excluding Wroclavia and Westfield World Trade Center
(6) Including services
(7) Includes Milan project at cost
221 THE BEST SHOPPING CENTRES IN THE WORLD’S BEST CITIES
GDP/Capita as % Top 3 GDP/Capita as % Top 3
City(1) of national average shopping centres City(1) of national average shopping centres
Warsaw 195% Stockholm 142%
New York 141%
Paris 176% WORLD TRADE CENTER
Los Angeles 133%
San Jose 175% VALLEY FAIR OAKRIDGE
CENTURY CITY
Barcelona 128%
San
Francisco 154% SAN FRANCISCO
CENTRE
San Diego 126% UTC
Prague 153%
Vienna(2) 122%
Madrid 146%
Lyon 120%
London 144% Ruhr
STRATFORD CITY LONDON
region(3)(4) 111%
Sources: Green Street Advisors, OECD, Brookings and JPMorgan Chase, World’s Richest Countries
Note: Shopping centres ranking based on Green Street shopping centres grades (for shopping centres with similar grades, ranking based on
footfall for European shopping centres and on sales/sqf for American shopping centres) Shopping centres in color are owned by Unibail-Rodamco and Westfield
(1) City defined as MSA (i.e metropolitan statistical area): geographical region with a relatively high population density and close economic ties
throughout the area
(2) GDP/Capita based on Vienna-Bratislava GDP/Capita on Brookings and JPMorgan Chase report
(3) GDP/Capita based on Köln-Düsseldorf GDP/Capita on Brookings and JPMorgan Chase report
(4) Top 3 shopping centres based on Düsseldorf Metropolitan Statistical Area as per Green Street Advisors database 231 A UNIQUE PORTFOLIO OF FLAGSHIP SHOPPING DESTINATIONS
2
Footfall of top 20 assets(1) (Mn)
46
42
36
34
28
25
22 21 21 20 20 19 19
17 16 15 15 15 14 13
STRATFORD LONDON VALLEY FAIR GARDEN STATE
SAN FRANCISCO UTC
CITY PLAZA
CENTRE
Unibail-Rodamco assets Westfield assets
(1) Based on Top 20 A++ and A+ rated malls as per Green Street Advisors with highest footfalls 242 THE WORLD’S PREMIER OWNER OF ICONIC QUALITY SHOPPING DESTINATIONS
Number of A++ assets(1) Average GMV at 100% per asset(2)
15
€599 Mn(3)
13
€516 Mn
€418 Mn
4
3 €147 Mn
+ +
Note: benchmark against top 3 other shopping centre REITs
(1) Source: Green Street Advisors. Including 8 assets for Unibail-Rodamco and 7 assets for Westfield
(2) Based on a 100% GMV of €63.5 Bn (shopping centres only) and the total number of shopping centres of the combined entity as of June 30, 2017. Based on estimated GMV at 100% divided by number of malls for US peers (source: Green Street Advisors and Unibail-Rodamco analysis to
restate GSA mall values to 100%). Based on reported GMV at 100% for Klépierre, divided by total number of assets
(3) Based on the number of assets as of June 30, 2017 252 A MUST HAVE PARTNER FOR BRANDS AND RETAILERS
Providing
brands
Eataly, Westfield Century City
with the Uniqlo, Glòries
greatest
locations
to express their
best concepts
Zara, Westfield London Samsung promotion, Vélizy 2
262 THE LARGEST PIPELINE
3
Proportionate pipeline in € Bn
12.3
7.4
4.9
2.8
1.3
0.8 0.6 0.4
(1)
+
Provides superior long-term potential
Source: Companies’ filings
Note: Development pipeline for global retail peers (€ Bn). As of June 30, 2017 for European peers and Westfield and September 30, 2017 for US peers
(1) Unibail-Rodamco’s view of Westfield’s pipeline. Proportionate total investment costs, excluding H2-2017 deliveries, as per Unibail-Rodamco’s definition 273 €12.3 BN OF PROJECTS TO CREATE VALUE
By segment(1) By region(1)
The Netherlands
€1.1 Bn United Kingdom
Central Europe
€0.4 Bn
4% 4%
9% Belgium
15%
3% 5%
€1.5 Bn Spain
€4.7 Bn 6%
12% 38%
14% United States
Germany 9%
€12.3 Bn €12.3 Bn
15% 11%
Italy
€2.2 Bn France
Offices
38%
€4.7 Bn committed 17%
France Retail
RETAIL OFFICES RESIDENTIAL
Greenfield / Brownfield
Extension / Renovation
Numbers may not add up due to rounding
(1) Breakdown based on proportionate project Total Investment Cost as per Unibail-Rodamco’s definition as of June 30, 2017, adjusted for H2-2017 deliveries 283 WESTFIELD LONDON
Additional GLA
82,000 m²
Westfield share
50%
Total investment
cost at 100%
€688 Mn
Anticipated
completion
Q1-2018
EXTENSION
293 WESTFIELD VALLEY FAIR
Additional GLA
48,200 m²
Westfield share
50%
Total investment
cost at 100%
€896 Mn
Anticipated
completion
2019
EXTENSION AND RENOVATION
303 LA PART-DIEU
Additional GLA
28,000 m²
Total
investment cost
€310 Mn
Anticipated
completion
H1-2020
EXTENSION AND RENOVATION
313 WESTFIELD MILAN
GLA
185,000 m²
Westfield share
75%
Total investment
cost at 100%
€1,318 Mn
Anticipated
completion
Post 2021
SHOPPING CENTRE BROWNFIELD
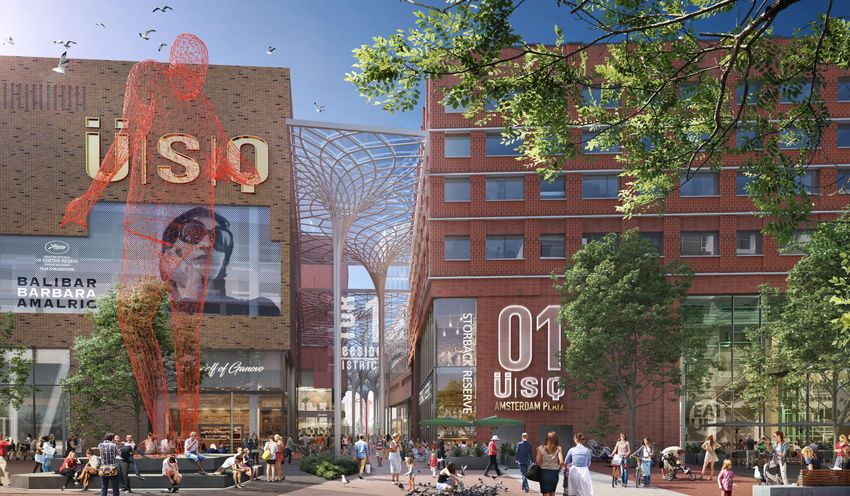
323 ÜBERSEEQUARTIER
GLA
209,600 m²
Total
investment cost
€1,014 Mn
Anticipated
completion
H2-2021
SHOPPING CENTRE BROWNFIELD
333 MALL OF EUROPE
GLA
126,300 m²
Total
investment cost
€566 Mn
Anticipated
completion
Post 2021
SHOPPING CENTRE BROWNFIELD
343 CROYDON
Future GLA
155,000 m²
Westfield share
50%
Total investment
cost at 100%
€1,481 Mn
Anticipated
completion
Post 2021
SHOPPING CENTRE BROWNFIELD
353 OFFICES, PARIS
TRINITY SISTERS TRIANGLE
GLA GLA GLA
48,900 m² 89,400 m² 85,100 m²
Total Total Total
investment cost investment cost investment cost
€317 Mn €629 Mn €522 Mn
Anticipated Anticipated Anticipated
completion completion completion
H1-2019 Post 2021 Post 2021
363 VALUE CREATION THROUGH EXPECTED REVENUE AND COST SYNERGIES
4
Expected revenue synergies: €40 Mn Expected cost synergies: €60 Mn
One branded • Westfield brand to be deployed across the group’s
platform flagship assets
• Combined group a “must-have” partner for global • Identified savings in corporate cost structure
retailers
• Sharing of operational best practices
Leasing • Cross fertilization of retailer relationships between Cost
Unibail-Rodamco and Westfield synergies • Procurement, marketing expenses, etc.
synergies
• Leveraging Westfield brand and specialty & advertising
income expertise across the group
• Rolling-out Unibail-Rodamco best practices
Revenue in asset management and digital innovation
synergies
• Capture reversionary potential
Expected run-rate synergies of €100 Mn p.a.(1), 4%+ of combined NRI(2)
Synergies as estimated by Unibail-Rodamco
(1) Full quantum of annual synergies
(2) Based on L12M as of June 30, 2017 374 WESTFIELD BRAND TO BE DEPLOYED ACROSS FLAGSHIP ASSETS
384 WESTFIELD BRAND TO BE DEPLOYED ACROSS FLAGSHIP ASSETS
394 WESTFIELD BRAND TO BE DEPLOYED ACROSS FLAGSHIP ASSETS
404 LEASING SYNERGIES ACROSS PORTFOLIO
Number of shops Transatlantic cross-fertilisation potential
186
21
88 83
165
29
27
4 76
59 14 10 6
23
7
Unibail-Rodamco Westfield
414 1.2 BN VISITS: UNIQUE PLATFORM FOR BRAND VENTURES AND ROADSHOWS
Lady Gaga concert, Westfield London Pokemon Go European partnership events, Les Quatre Temps
Digital Wall, Westfield World Trade Center Digital Dream®, Les Quatre Temps
424 DIGITAL INNOVATION CONNECTING WITH VISITORS
Fostering communities
Preparing the visit During the visit Direct engagement
Building
Facebook + the largest visitor
Instagram community
Website: Online product Click Partnership in the industry
50 Mn visits p.a. catalogue & Services 10 Mn fans
Smart Parking
Restaurant Opening Smart Loyalty cards Direct
menus hours map 4 Mn activation
Connecting with visitors: maximising the value of each of the 1.2 Bn visits
434 GOVERNANCE TO OFFER THE BEST OF TWO INDUSTRY LEADERS
5
• Two-tier board structure: Supervisory • Align strategy and corporate functions
Governance and Management Boards Operations (e.g. leasing, marketing, operations, development,
principles & strategy investment, etc.)
• Comply with highest standards
• Group to continue its best in class CSR agenda
• Unibail-Rodamco SB Chairman to be Group Chairman
• Sir Frank Lowy AC to chair new Advisory Board
Board • Two Westfield Board members, including Peter Lowy,
Continued
to join Unibail-Rodamco’s SB(1)
focus on CSR
• Unibail-Rodamco CEO to be Group CEO
Senior • Senior Management Committee to capitalise on
management strength and talent of both Companies
• Corporate HQs in Paris and Schiphol
• US HQ in Los Angeles
HQ & • UK HQ in London
management
• Organisation to match international scope
of the Group
• Bringing together two industry leading teams
(1) Subject to shareholder approval 44UNIBAIL-RODAMCO + WESTFIELD
A STRONG VALUE PROPOSITION
FOR BOTH SETS OF SHAREHOLDERS
45TRANSACTION STRUCTURE PRESERVES EXISTING REIT STATUS
Dutch Newco to hold the US assets
Unibail-Rodamco / Westfield
Unibail-Rodamco and US operations to continue to operate securityholders
as REITs(2). Newco to be a Dutch REIT
Stapled
Cross-guarantees create one single credit
100% 60%
Unibail-Rodamco to hold a 40% stake in Newco 40%
Unibail- Newco(3)
and two Supervisory Board seats
Rodamco REIT
Cross guarantees
Unibail-Rodamco to fully consolidate Newco
Shareholders of Unibail-Rodamco and Westfield
to hold(1) stapled securities consisting of
one Unibail-Rodamco share + one Newco share
European
Stapled shares to be traded as a single security Services US assets
assets
(1) Upon closing of the transaction
(2) SIIC in France and REIT in the US
(3) Newco to also own selected Netherlands assets 46FINANCING STRUCTURE LEVERAGES UNIBAIL-RODAMCO’S STRENGTH
All in € Bn
Fully committed €6.1 Bn bridge facility
• Covers cash in offer, select debt refinancing
and transaction costs
5.6
• Foreign exchange risk management strategy
in place to cover cash portion of the offer
• To be refinanced with unsecured senior debt
13.4
and subordinated hybrid securities (€2 Bn)
• Disposals pursuant to ongoing portfolio review:
approximately €3 Bn over the next several years
8.7
Strong balance sheet and financial flexibility
• “A” category credit rating expected
• Ample liquidity post transaction (€8 Bn)(3)
0.9
Total Uses Total Sources • Westfield debt to remain in place
Equity purchase price(1) Cash
• Assets rotation to continue
Other uses(2) Shares
(1) Including estimated Westfield performance rights dilutive effect
(2) Including potential refinancing of certain indebtedness and estimated transaction costs
(3) Committed credit lines of Unibail-Rodamco and Westfield as at December 1, 2017 47CONTINUED STRONG BALANCE SHEET
All figures as of June 30, 2017 Unibail-Rodamco Westfield Pro forma
Proportionate GMV (€ Bn)(1) 43.0 18.1 61.1
Proportionate net financial debt(2) (€ Bn) 14.6 7.7 25.3
Consolidated LTV(2) 33% 34% 39%
Consolidated ICR(3) 6.9x 5.7x > 5x
“A” category credit rating expected
(1) Based on Unibail-Rodamco assumptions for Westfield
(2) Based on Unibail-Rodamco’s methodology for Consolidated Loan To Value (LTV) computation, applied to both Unibail-Rodamco and Westfield. Pro forma assumes a take-out financing of €5.1 Bn (excluding potential refinancing requirements), including €2 Bn of
hybrid accounted for as shareholder’s equity under IFRS. Does not include impact of announced disposal program. Based on consolidated net financial debt of €23.1 Bn and consolidated GMV of €59.8 Bn. Proportionate LTV: 41%
(3) Based on Unibail-Rodamco’s methodology for Consolidated Interest Coverage Ratio (ICR) computation, applied to both Unibail-Rodamco and Westfield. Proportionate ICR > 4.5x 48ACCRETIVE TO RECURRING EARNINGS AND NAV
All figures proportionate, L12M as of June 30, 2017 Unibail-Rodamco Westfield(3) Pro forma
L12M NRI (€ Mn)(1) 1,594 710 2,344
L12M RNR (€ Mn) 1,153 587
Accretive transaction
from first full year(4)
L12M REPS(2) (€ p.s.) 11.6 0.28
EPRA NAV(2) (€ p.s.) 206.2 5.97 Accretive(5)
(1) Pro-forma includes estimated revenue synergies of €40 Mn
(2) Individual number of shares used for each company
(3) Westfield’s NRI, RNR, REPS, and EPRA NAV as computed by Unibail-Rodamco applying its own accounting policies and estimates, based on financial information provided by Westfield during due diligence
(4) For Unibail-Rodamco shareholders, taking into account expected run-rate synergies. Source : Unibail-Rodamco
(5) For Unibail-Rodamco shareholders, taking into account NPV of expected synergies and assuming no goodwill depreciation. Source : Unibail-Rodamco 49CONCLUSION
50NEXT STEPS AND SUMMARY TIMETABLE
Key milestones Timing
Signing of the implementation agreement Done
Consultation of Unibail-Rodamco’s works council Q1-2018
Regulatory approvals and other customary closing conditions Q2-2018
Unibail-Rodamco and Westfield shareholder meetings Q2-2018
Closing Q2-2018
51UNIQUE OPPORTUNITY TO CREATE SIGNIFICANT VALUE FOR SHAREHOLDERS
The world’s premier developer and operator of flagship
Driving significant value creation for shareholders
shopping destinations
Unique platform Adds Substantial
Synergies
of flagship assets new markets value creation
104 shopping destinations London c. €100 Mn REPS and NAV accretion(1)
56 flagships US wealthiest cities expected run-rate synergies
Milan
13 countries
World’s largest Best-in-class Robust Attractive
development pipeline management balance sheet dividend policy
Significant growth Great talent pool LTV(2): 39% 85-95% payout of REPS
from new flagship projects
“A” category rating(3)
Statements with regards to expected synergies, expected accretion and expected rating outcome of the transaction have been prepared by Unibail-Rodamco after performing due diligence on Westfield’s business and financial information
(1) For Unibail-Rodamco shareholders, including expected run-rate synergies impact and assuming no goodwill depreciation
(2) Consolidated LTV, Unibail-Rodamco‘s definition and computation
(3) Expected pro forma rating. Source: Unibail-Rodamco 52UNIBAIL-RODAMCO + WESTFIELD:
CREATING THE WORLD’S PREMIER
DEVELOPER AND OPERATOR
OF FLAGSHIP SHOPPING DESTINATIONS
53APPENDICES
54GLOSSARY
List of assets and projects
Terms Meaning and corresponding cities
Barcelona, Berlin, Bratislava, Chicago, Copenhagen, Helsinki, Lille, London, Los Angeles, Lyon, Madrid, Munich,
CentrO Oberhausen
Capital cities New York City, Nice, Paris, Prague, Randstad region, Ruhr region, San Diego, San Francisco / San Jose, Seattle,
Stockholm, Valencia, Vienna, Warsaw, Washington DC, Wroclaw
Croydon London
FFO (funds from Net property income (+) management income (+) project income (-) overheads costs (-) net interest excluding
operations) capitalized interest (-) minority interest (-) current tax
La Part-dieu Lyon
• 39 Unibail-Rodamco shopping centres: Aéroville, Arkadia, Aupark, Bonaire, Carré Sénart, Carrousel du Louvre,
CentrO, Centrum Cerny Most, Centrum Chodov, CNIT, Donauzentrum, Euralille, Fisketorvet, Galeria Mokotów,
Glòries, Gropius Passagen, Jumbo, La Maquinista, La Part-Dieu, La Vaguada, Le Forum des Halles, Leidsenhage, Les Quatre Temps Paris region
Les Quatre Temps, Lyon Confluence, Mall of Scandinavia, Parly 2, Parquesur, Pasing Arcaden, Polygone Riviera,
Flagship Rosny 2, Ruhr-Park, Shopping City Süd, Splau, Stadshart Amstelveen, Täby, Vélizy 2, Villeneuve 2, Wroclavia, Mall of Europe Brussels
Zlote Tarasy
• 17 Westfield shopping centres: Annapolis, Century City, Westfield London, Culver City, Fashion Square, Garden Mall of Scandinavia Stockholm region
State Plaza, Montgomery, Old Orchard, Roseville, San Francisco Centre, Santa Anita, Southcenter, Stratford City,
Topanga, UTC, Valley Fair, World Trade Center
Überseequartier Hamburg
Gross market value of investment property, including assets under construction and held for redevelopment, and
inventories. For Westfield, GMV has been computed by Unibail-Rodamco and its financial due diligence advisor,
GMV Vélizy 2 Paris region
based on the net market value disclosed by Westfield in H1-2017, adjusted for estimated transfer taxes and
transaction costs
NPI Net property income as per Westfield reporting, gross of lease incentive amortizations Westfield Century City Los Angeles
Net rental income, equivalent to net property income, net of lease incentive amortizations, including share of JVs net
NRI Westfield London London
property income in Westfield’s disclosures
Including 100% of the assets and liabilities fully consolidated and share of assets and liabilities accounted for under
Proportionate Westfield Milan Milan
equity method
REPS Recurring earnings per share
Recurring net result defined as net result before revaluations and related deferred taxes, mark to market of financial Westfield Stratford City London
RNR instruments and other exceptional gains / losses
Equivalent to Specialty retail store in Westfield‘s disclosures. Specialty stores consist of mini-majors (stores between Westfield UTC San Diego
Small Units
1,858 m² and 7,432 m² GLA) and specialty shops (less than 400 m² GLA)
Sales generated by retailers in Westfield centres specialty stores, including VAT in the UK, and excluding any sales Westfield Valley Fair San Jose
Specialty retailer sales
tax in the US
Total investment cost Sum of all project capital expenditures and lease incentives, excluding capitalised interests and loss of rent Westfield World Trade Center New York City
Westfield’s Retail Technology Platform that aims to connect retailers, consumers and brands both physically and
OneMarket digitally by creating a network that supports the retail industry with products and services that elevate shopper
experiences
55FOREIGN EXCHANGE RATES
Period Rate Used for
L12M as of June 30, 2017 EUR / USD: 1.09
P&L and cash flow data for relevant period
L12M as of December 31, 2016 EUR / GBP: 0.82
Spot as of June 30, 2017 EUR / USD: 1.14 H1-2017 Balance sheet figures
Spot as of September 30, 2017 EUR / USD: 1.18 Q3-2017 Balance sheet figures
EUR / USD: 1.19 Future normalized annual retail sales
Spot as of December 1, 2017
EUR / GBP: 0.88 Total investment cost for pipeline assets
EUR / USD: 1.180
Spot as of December 11, 2017 Offer value computations
USD / AUD: 1.327
EUR / USD: 1.179
L3M as of December 11, 2017 US$ VWAP computations
USD / AUD: 1.291
56DISCLAIMER
57You can also read