The impact of spikes in handgun acquisitions on firearm-related harms
←
→
Page content transcription
If your browser does not render page correctly, please read the page content below
Laqueur et al. Injury Epidemiology    (2019) 6:35
https://doi.org/10.1186/s40621-019-0212-0

 ORIGINAL CONTRIBUTION                                                                                                                         Open Access

The impact of spikes in handgun
acquisitions on firearm-related harms
Hannah S. Laqueur*† , Rose M. C. Kagawa†, Christopher D. McCort, Rocco Pallin and Garen Wintemute

  Abstract
  Background: Research has documented sharp and short-lived increases in firearm acquisitions immediately
  following high-profile mass shootings and specific elections, increasing exposure to firearms at the community
  level. We exploit cross-city variation in the estimated number of excess handgun acquisitions in California following
  the 2012 presidential election and the Sandy Hook school shooting 5 weeks later to assess whether the additional
  handguns were associated with increases in the rate of firearm-related harms at the city level.
  Methods: We use a two-stage modeling approach. First, we estimate excess handguns as the difference between
  actual handgun acquisitions, as recorded in California’s Dealer Record of Sales, and expected acquisitions, as predicted by
  a seasonal autoregressive integrated moving-average (SARIMA) time series model. We use Poisson regression models to
  estimate the effect of city-level excess handgun purchasing on city-level changes in rates of firearm mortality and injury.
  Results: We estimate there were 36,142 excess handguns acquired in California in the 11 weeks following the election
  (95% prediction interval: 22,780 to 49,505); the Sandy Hook shooting occurred in week 6. We find city-level purchasing
  spikes were associated with higher rates of firearm injury in the 52 weeks post-election: a relative rate of 1.044 firearm
  injuries for each excess handgun per 1,000 people (95% CI: 1.000 to 1.089). This amounts to approximately
  290 (95% CI: 0 to 616) additional firearm injuries (roughly a 4% increase) in California over the year. We do
  not detect statistically significant associations for shorter time windows or for firearm mortality.
  Conclusion: This study provides evidence for an association between excess handgun acquisitions following
  high-profile events and firearm injury at the community level. This suggests that even marginal increases in
  handgun prevalence may be impactful.
  Keywords: Firearm injury, Elections, Mass shootings, Handguns

Background                                                                          gain a deeper understanding of the relationship between
Firearm ownership is a well-established risk factor for                             firearm acquisition and firearm-related harm.
interpersonal, self-directed, and unintentional firearm                                Research has documented large and short-lived in-
harm (Anglemyer et al., 2014; Kellermann et al., 1993;                              creases in firearm acquisitions immediately following
Kellermann et al., 1992; Wiebe, 2003). At the ecological                            high-profile mass shootings (Liu & Wiebe, 2019) and the
level, the prevalence of firearm ownership has also been                            election and reelection of President Obama (Depetris-
found to be associated with higher firearm homicide and                             Chauvin, 2015). Studdert el al. (2017) find significant
suicide rates (Miller et al., 2002; Miller et al., 2007; Siegel                     spikes in handgun purchasing in California in the six
et al., 2013). Given increasing rates of firearm purchas-                           weeks following the widely publicized mass shooting at
ing in the United States over the last decades, and the                             Sandy Hook elementary school in Newtown, Connecticut
rising burden of firearm harm (the rate of firearm deaths                           (2012) and in San Bernardino, California (2015), totaling
reached a 20-year high in 2017 (National Center for                                 53 and 41% more purchases than expected. The California
Injury Control and Prevention, 2019)), it is important to                           trends correspond with national reports. While there is no
                                                                                    national database of firearm purchasing records, Levine
* Correspondence: hslaqueur@ucdavis.edu                                             and McKnight (2017) show a proxy for purchases -
†
 Hannah S. Laqueur and Rose M.C. Kagawa are co-first authors.
Violence Prevention Research Program, Department of Emergency Medicine,             National Instant Criminal Background Check System
University of California, 2315 Stockton Blvd., Sacramento, CA 95817, USA

                                      © The Author(s). 2019 Open Access This article is distributed under the terms of the Creative Commons Attribution 4.0
                                      International License (http://creativecommons.org/licenses/by/4.0/), which permits unrestricted use, distribution, and
                                      reproduction in any medium, provided you give appropriate credit to the original author(s) and the source, provide a link to
                                      the Creative Commons license, and indicate if changes were made. The Creative Commons Public Domain Dedication waiver
                                      (http://creativecommons.org/publicdomain/zero/1.0/) applies to the data made available in this article, unless otherwise stated.
Laqueur et al. Injury Epidemiology (2019) 6:35 Page 2 of 6
(NICS) checks performed on individuals seeking to pur- of exposure to each event across California is arguably
chase a firearm through a licensed dealer - increased in uniform, while the handgun purchasing behavior follow-
the months immediately following the Sandy Hook ing the events is not. If true, this limits the potential for
mass shooting. The elections of President Obama in confounding bias due to factors correlated with firearm
2008 and 2012 were also followed by spikes in NICS purchasing. Since 1953, California has required licensed
checks (Depetris-Chauvin, 2015). retailers to generate a separate record for every handgun
Based on previous research linking firearm ownership transfer. These dealer’s records of sale are stored by the
and firearm prevalence with increased risk of firearm California Department of Justice and were made available
harm, the sudden and unanticipated influx of firearms in for use in this study. As all legal transfers of firearms in
a concentrated area such as a city could result in in- California must be conducted through a licensed retailer
creases in firearm harm. Levine and McKnight found with few exceptions, the database of sales records consti-
increases in firearm purchasing following the Sandy tutes a nearly complete record of legal handgun transfers
Hook school shooting were associated with increases in in the state.
the number of unintentional firearm deaths at the state Our outcomes include firearm mortality, firearm injury,
level, Levine & McKnight (2017). Another study found and each broken down by type (interpersonal, self-directed,
states with larger purchasing spikes following the 2008 unintentional, and undetermined). Firearm fatalities are
presidential election were 20% more likely to experience measured using death records from the California
a mass shooting event (Depetris-Chauvin, 2015). Associ- Department of Public Health Vital Records. Nonfatal
ations with firearm injury, far more common than fire- firearm hospitalizations and emergency department
arm mortality, have not been tested. visits are provided by the Office of Statewide Health
In the present study, we estimate whether the spike in Planning and Development (OSHPD).
handgun acquisitions in California following the 2012 We define excess handguns as the difference between
presidential election and the Sandy Hook school shoot- actual handgun acquisitions and expected acquisitions,
ing that took place five weeks after was associated with as predicted by seasonal autoregressive integrated mov-
increases in fatal and non-fatal firearm injury. Assuming ing-average (SARIMA) time series models, over an 11-
these historical events do not influence community-level week period beginning from the election on November 6,
firearm violence by avenues other than increasing hand- 2012 until 6 weeks post Sandy Hook. The length of our
gun purchasing, variation in the degree of excess handgun spike period is based on Studdert et al’s (2017) finding that
purchasing across cities offers an opportunity to estimate handgun acquisitions were higher than expected following
independent associations between firearm acquisition and the 2012 election, increased sharply again immediately fol-
firearm-related harms at the community level. lowing Sandy Hook, and then reverted to expected levels
approximately 6 weeks later. We fit SARIMA models to
Methods each city’s purchasing time series using the Hyndman and
Our estimation strategy exploits cross-city variation in Khandakar algorithm (Hyndman & Khandakar, 2008). We
the increase in handgun purchasing from the election of tested for residual autocorrelation using the Box-Ljung
President Obama until six weeks post Sandy Hook to test (Ljung & Box, 1978), with the false discovery rate
estimate the within-city change in the rate of firearm-re- multiple test correction of Benjamini and Hochberg
lated harm associated with the additional handguns (Benjamini & Hochberg, 1995). One city was found to
acquired during this period. have residual autocorrelation, which was corrected by in-
Our unit of analysis is the city, defined as localities cluding a seasonal differencing term. Using time binned in
with a population of 10,000 or greater. Because injury 73-day periods (approximately 11 weeks), the training
data are only available at the zip code level, to maintain period for the SARIMA models covers January 1, 2004 –
geographic parity across our measures, all data were col- November 5, 2012.
lected at the zip code level and aggregated to corre- We then use Poisson regression models to estimate
sponding cities. Our sample includes a total of 499 the effects of city-level excess handgun acquisitions on
California cities. city-level changes in rates of firearm mortality and injury
Our exposure of interest is the estimated number of and by type in 11-week, 6-month, and 1-year windows
city-level excess handguns purchased beginning with the following the election, as compared with the same time
election of President Obama until six weeks following periods directly before the election. Outcomes were not
Sandy Hook. The spike (defined below) in firearm pur- assessed until 10 days after the election, the first day an
chasing following both events is well-documented, nation- election-day purchaser could legally aquire the handgun
ally and specifically in California (Levine & McKnight, by California law. We include fixed effects for time to
2017; Liu & Wiebe, 2019; Studdert et al., 2017; Wallace, account for temporal trends in firearm violence and
2015). Both events were highly publicized so that the level for city to adjust for time-fixed differences across place.Laqueur et al. Injury Epidemiology (2019) 6:35 Page 3 of 6
We thereby estimate the impact of acquisitions on fire- interpersonal injury is the main driver of the overall dif-
arm-related harm based on within-city variation above ference in firearm injury.
and beyond city averages for the dependent and ex- We do not detect a statistically significant difference
planatory variables. for the shorter time periods or firearm mortality.
To test the robustness of our results, we estimate sev- Using the base rate of the 1-year injury estimate,
eral alternative specifications including binning pur- scaled to 11 weeks, 6 months, and 1 year, we conduct
chases in shorter time periods (1-week and 6-week bins) post hoc simulations to evaluate our power to detect
in our SARIMA models. We also incorporate uncer- statistically significant associations. Running 1,000
tainty from the first stage model (the estimate of the simulations we find our power to detect an associ-
spike size) in our second stage models by estimating ation in the 11 week window is only 0.16, as com-
effects using the minimum and maximum bounds of the pared to 0.52 for the 1-year period. Simulation results
95% prediction interval for the spike size. Finally, we im- are presented in the Additional file 1: Figure S2.
plement several falsification tests, estimating models The results from all of our robustness checks support
with a set of outcomes that should not be affected by the the finding of an association with firearm injury, with
exposure (handgun purchasing). Specifically, we test for one exception. Results are substantively similar using ex-
an “effect” on bicycle injury (involving a hospitalization) cess purchasing estimates from the 1-week and 6-week
and machinery injury, both of which have a similar state- bins for the first stage SARIMA models, but are only
wide base rate to firearm injury, and on motor vehicle statistically significant for the 6-week bins (Additional
crash injury, often cited in the firearm literature as an ex- file 1: Table S2). Incorporating uncertainty from the first
ample of a successful application of the public health ap- stage SARIMA models (upper and lower bound confidence
proach to reducing injury and mortality (Hemenway, interval), results for firearm injury remain statistically sig-
2010; Hemenway, 2001). Because the base rate for motor nificant (Additional file 1: Table S3). The falsification test
vehicle crashes is 33 times greater than firearm injuries, outcomes all have risk ratios that are not significantly differ-
we scale the outcome so as to have the same power to de- ent from 1 (Table 1).
tect statistical significance.
Discussion
Our results suggest that cities that experienced substan-
Results tial increases in the rate of handgun purchasing in the
Using SARIMA model predictions of excess purchasing wake of Obama’s reelection and the Sandy Hook school
at the city level, we estimate a total of 36,142 (95% shooting were more likely to see an increase in the rate
prediction interval: 22,780 to 49,505) excess handgun of firearm injury the following year. We estimated an in-
acquisitions in California from the election through crease in injuries of 4% over the following year for the
the 6-week period following Sandy Hook, representing entire state. This 4% represents an important increase in
an increase of more than 55% over expected volume. the total number of people injured – approximately 290
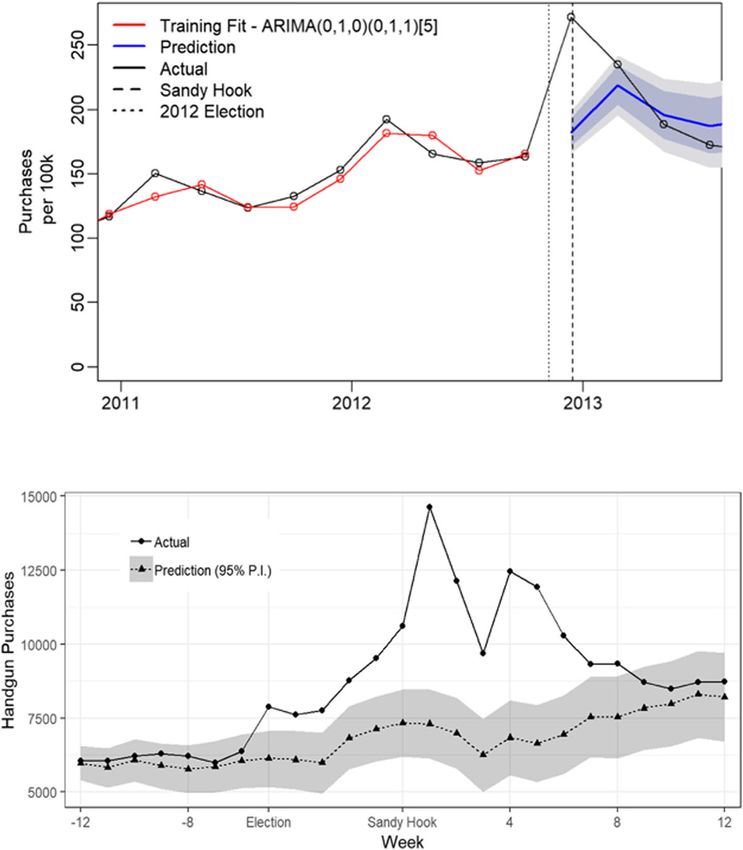
Figure 1 shows the statewide handgun acquisition additional firearm injuries in California. A similar study
spike. Importantly, expected acquisitions closely ap- of effects of the post-Sandy Hook purchasing spike on
proximate actual acquisitions during the pre-election firearm mortality in the United States estimated there
period. Additional file 1: Figure S1 shows the size and were approximately 137 additional accidental firearm
locations of estimated purchasing spikes. deaths in the entire country associated with the excess
The Poisson regression models show city-level pur- firearms (Levine & McKnight, 2017).
chasing spikes are statistically significantly associated Results were somewhat dependent on the length of
with higher rates of firearm injury in the year following time used to bin purchases, which influenced the esti-
the election. Specifically, we estimate one additional ex- mate of the number of excess handgun purchases across
cess handgun purchase per 1,000 people is associated cities. Final results were not significant for the models
with 1.044 times the injury rate (1.044; 95% CI: 1.000, that used 1-week bins to estimate the spike size. These
1.089) (Table 1). Using model predictions, we estimate a estimates were less stable, particularly for small cities.
total of approximately 290 (95% CI: 0 to 616) additional The magnitude of the estimated association between
firearm injuries occurred in California over a year in purchasing spikes and firearm harm was largest for
connection to the excess handguns purchased in the 11 models using the 6-weeks bin estimates (1.066; 95% CI:
weeks following the election, a statewide increase of 1.024, 1.110), though these bins included some post-
nearly 4% (95% CI: 0, 8%). We also find a statistically spike time beyond the ~ 11 week spike period.
significant association specifically with interpersonal in- We do not see effects for firearm mortality or for
jury (1.092; 95% CI: 1.003, 1.189) (Additional file 1: shorter time periods (11 weeks and 6 months). The only
Table S1). Exploratory analysis suggests the difference in other study to estimate the effects of purchasing spikesLaqueur et al. Injury Epidemiology (2019) 6:35 Page 4 of 6
Fig. 1 Statewide handgun purchasing. Weekly handgun acquisitions per 100,000, 2011- 2015 top figure. Number of handgun acquisitions per
week October 2014 – January 2015 bottom figure
on firearm mortality also did not find associations for associations was due to a true lack of association or low
firearm suicide or homicide (Levine & McKnight, power to detect an association.
2017). Given the baseline prevalence of firearm owner- This is the first study to use a direct measure of hand-
ship is already high and the mortality outcomes are gun purchasing to estimate the association between fire-
relatively rare, we would not expect to see a large arm acquisitions and firearm-related harm. It is also the
population level effect of the spike in handgun acquisitions. first to assess impacts on firearm injury. Additionally, the
Though the purchasing spike was substantial, it accounted use of spikes in purchasing following the 2012 presidential
for less than 10% of annual handgun acquisitions, and is a election and the Sandy Hook school shooting to identify
tiny fraction of the more than 30 million estimated privately city-level influxes of handguns is a novel approach that
owned firearms in California (Okoro et al., 2005). We also minimizes the potential for confounding. To bias the asso-
found our power to detect associations for shorter time pe- ciation, the presidential election, Sandy Hook, or another
riods and the rarer outcomes was quite low. As a result, we closely timed historical event would need to influence fire-
cannot confirm whether the failure to identify additional arm purchasing behavior and, independently from
Table 1 Association between excess handguns (per 1,000 population) acquired during the 11 week period following the 2012
election and Sandy Hook and firearm violence rates (per 1,000 Population)
outcome window all firearm violence firearm injury firearm mortality machinery injury bicycle injury motor vehicle injury
(falsification test) (falsification test) (falsification test)
Poisson Regression Risk Ratios†
12 Month 1.033 1.044 * 0.993 1.014 0.956 0.988
(0.997, 1.070) (1.000, 1.089) (0.932, 1.058) (0.998, 1.031) (0.897, 1.019)) (0.954, 1.023)
* P ≤ 0.05
†
Results for injury and mortality by type and for shorter time windows are included in the Additional file 1Laqueur et al. Injury Epidemiology (2019) 6:35 Page 5 of 6
purchasing behavior, rates of firearm harm in the same Authors’ contributions
geographic areas. Finally, three falsification tests using HL and RK conceptualized and designed the study, supervised the statistical
analyses, and interpreted the results. HL and RK drafted and revised the
outcomes that we would not expect to be associated with manuscript. CM performed the primary statistical analysis. RP contributed
firearm purchasing or the events preceding the purchasing additional statistical analyses and assisted with manuscript revisions. All
spike showed no association with the number of excess authors reviewed manuscript drafts. GW contributed to the interpretation of
results and the writing and editing of the manuscript. All authors read and
handguns. approved the final manuscript.
An important limitation to be noted is that we can
only empirically test for relatively short-term (≤1 year) Funding
associations: moving further in time from the event of We gratefully acknowledge funding from the University of California Firearm
Violence Research Center and the Robertson Fellowship in Violence
interest raises the possibility that other factors drove the Prevention Research.
witnessed differences in city-level firearm harm. Yet the
risks associated with having a handgun in the home are Availability of data and materials
The data that support this study are not publicly available, but can be
clearly not temporally limited. As such, there may be
obtained from the California Department of Justice and the State Office of
cumulative and long-term effects of excess handgun pur- Statewide Health Planning and Development.
chases that are simply not detectable with this data and
design. Similarly, while our finding of increased injury is Ethics approval and consent to participate
Not Applicable
credibly the result of increased exposure to handguns
generated by the purchasing spike, the study design does Consent for publication
not rule out the possibility that cities that had more pur- Not Applicable
chasing following the election and Sandy Hook were also
cities that have done less to reduce community level vio- Competing interests
The authors declare that they have no competing interests.
lence in the post-spike period. Finally, injury data are
available at the zip code but not city level and there may Received: 26 March 2019 Accepted: 10 July 2019
have been some misattribution to place in our conver-
sion from zip code to city data. However, the same geo-
References
graphic areas were used to measure both our exposure Anglemyer A, Horvath T, Rutherford G. The accessibility of firearms and risk for
and outcomes so this should not have biased our results. suicide and homicide victimization among household members: a systematic
review and meta-analysis. Ann Intern Med. 2014;160(2):101–10.
Benjamini Y, Hochberg Y. Controlling the false discovery rate: a practical and
Conclusion powerful approach to multiple testing. J R Stat Soc Ser B Methodol.
1995;57(1):289–300.
Firearm ownership is consistently associated with an Centers for Disease Control and Prevention, National Center for Injury Control
increased risk of firearm harm at the individual and and Prevention. Fatal injury data. Available from: https://www.cdc.gov/injury/
population levels (Siegel et al., 2013; Wiebe, 2003). Here, wisqars/fatal.html. Accessed 31 May 2019.
Depetris-Chauvin E. Fear of Obama: An empirical study of the demand for guns
we find evidence that cities with larger spikes in hand- and the U.S. 2008 presidential election. J Public Econ. 2015;130:66–79.
gun acquisitions following the 2012 presidential election Hemenway D. The public health approach to motor vehicles, tobacco, and
had relatively higher rates of firearm-related injury the alcohol, with applications to firearms policy. J Public Health Policy.
2001;22(4):381–402.
following year. This suggests that even marginal in- Hemenway D: Private guns, public health: University of Michigan Press; 2010.
creases in handgun prevalence may be impactful. These Hyndman RJ, Khandakar Y. Automatic time series forecasting: the forecast package
results require replication elsewhere and an assessment for R. J Stat Softw. 2008;27(3):1–22. https://doi.org/10.18637/jss.v027.i03
Kellermann AL, Rivara FP, Rushforth NB, Banton JG, Reay DT, Francisco JT, Locci
of threshold effects in the relationship between firearm AB, Prodzinski J, Hackman BB, Somes G. Gun ownership as a risk factor for
prevalence and firearm harm. homicide in the home. N Engl J Med. 1993;329(15):1084–91.
Kellermann AL, Rivara FP, Somes G, Reay DT, Francisco J, Banton JG, Prodzinski J,
Fligner C, Hackman BB. Suicide in the home in relation to gun ownership. N
Additional file Engl J Med. 1992;327(7):467–72.
Levine PB, McKnight R. Firearms and accidental deaths: evidence from the
aftermath of the Sandy Hook school shooting. Science. 2017;358(6368):
Additional file 1: Figure S1. Heat map of city spikes. Figure S2. Power
1324–8.
calculation simulations. Table S1. All time periods and all outcomes.
Liu G, Wiebe DJ. A time-series analysis of firearm purchasing after mass shooting
Table S2. Risk Ratios from SARIMA models using 1-week and 6-week
events in the United States. JAMA Netw Open. 2019;2(4):e191736–6.
bins (52 week results). Table S3. Risk ratios calculated from lower and
Ljung GM, Box GE. On a measure of lack of fit in time series models. Biometrika.
upper bounds of first stage estimates. (PDF 490 kb)
1978;65(2):297–303.
Miller M, Azrael D, Hemenway D. Rates of household firearm ownership and
homicide across US regions and states, 1988–1997. Am J Public Health.
Abbreviations
2002;92(12):1988–93.
CI: Confidence Interval; NICS: National Instant Criminal Background Check
Miller M, Lippmann SJ, Azrael D, Hemenway D. Household firearm ownership
System; SARIMA: Seasonal autoregressive integrated moving-average
and rates of suicide across the 50 United States. J Trauma Acute Care Surg.
2007;62(4):1029–35.
Acknowledgements Okoro CA, Nelson DE, Mercy JA, Balluz LS, Crosby AE, Mokdad AH. Prevalence of
Not Applicable household firearms and firearm-storage practices in the 50 states and theLaqueur et al. Injury Epidemiology (2019) 6:35 Page 6 of 6
District of Columbia: findings from the behavioral risk factor surveillance
system, 2002. Pediatrics. 2005;116(3):e370–6.
Siegel M, Ross CS, King C III. The relationship between gun ownership and
firearm homicide rates in the United States, 1981–2010. Am J Public Health.
2013;103(11):2098–105.
Studdert DM, Zhang Y, Rodden JA, Hyndman RJ, Wintemute GJ. Handgun
acquisitions in California after two mass shootings. Ann Intern Med.
2017;166(10):698–706.
Wallace LN. Responding to violence with guns: mass shootings and gun
acquisition. Soc Sci J. 2015;52(2):156–67.
Wiebe DJ. Firearms in US homes as a risk factor for unintentional gunshot fatality.
Accid Anal Prev. 2003;35(5):711–6.
Publisher’s Note
Springer Nature remains neutral with regard to jurisdictional claims in
published maps and institutional affiliations.You can also read