How Is COVID-19 Impacting the Sustainability of Microfinance Institutions? - CGAP Presenters Discussants
←
→
Page content transcription
If your browser does not render page correctly, please read the page content below
How Is COVID-19 Impacting the Sustainability of
Microfinance Institutions?

CGAP Presenters
Peter Zetterli and Alexander Sotiriou

Discussants
Momina Aijazuddin, IFC
Andrée Simon, FINCA Impact Finance
Jérôme Savelli, Symbiotics              August 5, 2020
Speakers

CGAP Moderators

                                             Peter Zetterli                       Alexander Sotiriou
                                   Senior Financial Sector Specialist       Senior Financial Sector Specialist

Panelists

                      Momina Aijazuddin                         Jérôme Savelli                          Andrée Simon
                          Global Head:                         Chief Risk Officer                     President and CEO
              Microfinance and Financial Inclusion                Symbiotics                         FINCA Impact Finance
            International Finance Corporation (IFC)                                                                    2
                                                                                                                        © CGAP 2019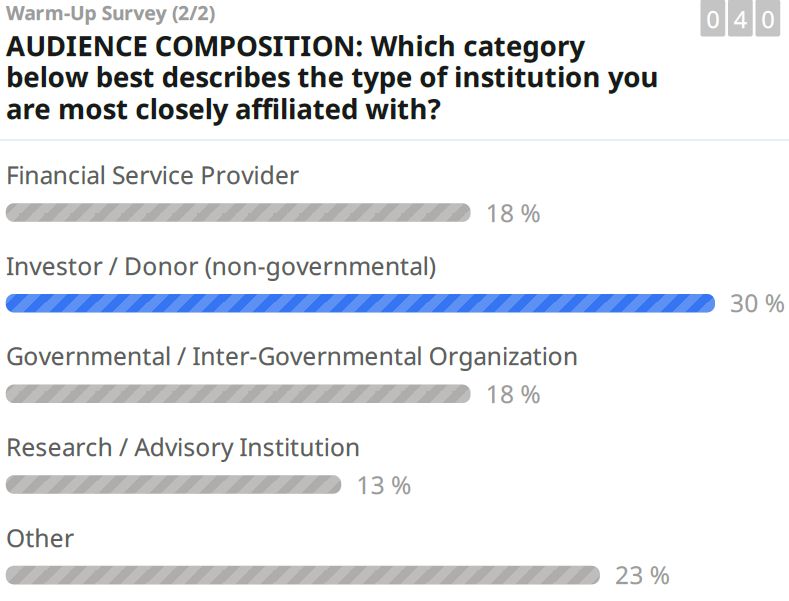
Logistics

       Slido Polls            WebEx Q&A/Chat              Other Logistics

• Go to: www.slido.com     • Q&A: Post specific      • Audience mics will
• Enter event code: CGAP     questions                 remain muted

                           • Chat: Have open ended   • Webinar will be recorded
                             conversations             and shared

                                                     • Presentation will be
                                                       shared
                                                                                  3

                                                                                  © CGAP 2019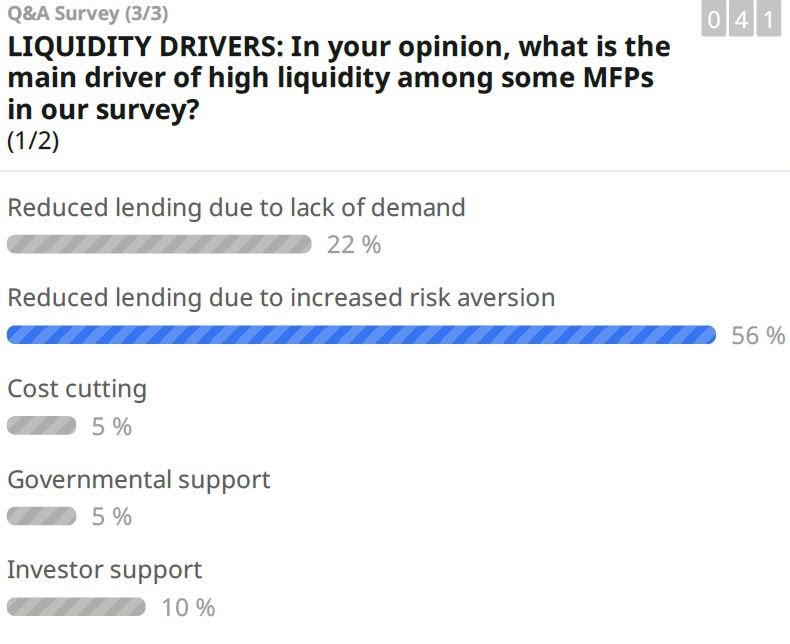
Go to
Agenda                   slido.com
                          #CGAP
• Introduction

• Survey Highlights

• Respondent Reactions

• Open Q&A

                                   4

                                   © CGAP 2019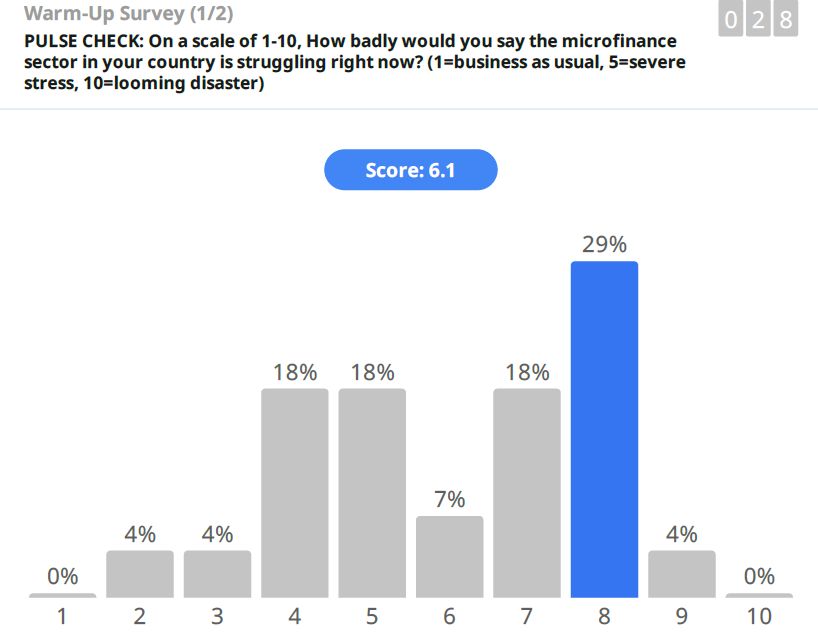
CGAP’s MFI Crisis Response Efforts: 4 Focus Areas
    CGAP’s efforts are intended to help the MFI sector survive and recover from the economic shock
    precipitated by the COVID-19 pandemic.

          1                                2                                 3                               4
                 Funder Alignment                  MFI Resilience                 Policy / Regulation                Common Data

           Facilitate more effective       Assist MFIs in managing          Produce guidance for             Create a common set of facts
Focus      collective action among various through the crisis and improving policymakers/regulators in how   for stakeholders to ground their
           funder constituencies           resilience to future shocks      to confront the crisis           decision-making

                                           Roadmaps for Crisis              Regulatory Response               Global Pulse Survey
Outputs                  ?                 Management, Recovery,            Framework                         Public Data Dashboard
                                           Digitization                     Country Deep Dives                Analysis of Results

                                                                                                                                          5

                                                                                                                                          © CGAP 2019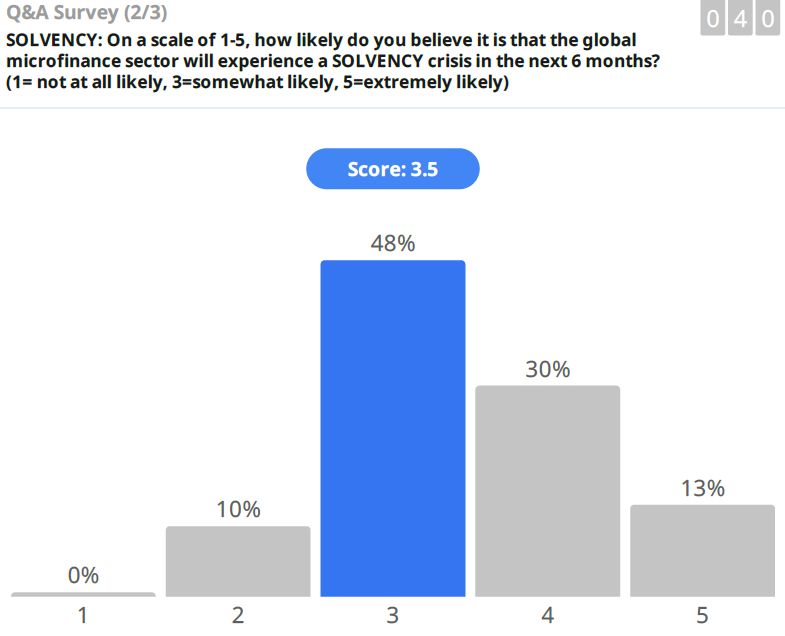
The CGAP Global Pulse Survey of MFIs
The survey was created in response to repeated needs for comprehensive data voiced by stakeholders

• Meant to get a quick reading across the globe
• Funders & policy makers get a full picture of the sector
• Participating MFIs get private benchmarking tools

• Short, digital survey that works well on mobile
• Initially every two weeks, now switched to monthly

• Implemented with MFR and hosted on ATLAS
• Wave 3 has just closed and Wave 4 is now open
• Data at www.cgap.org/pulse-survey-results

                                                                                                     6

                                                                                                     © CGAP 2019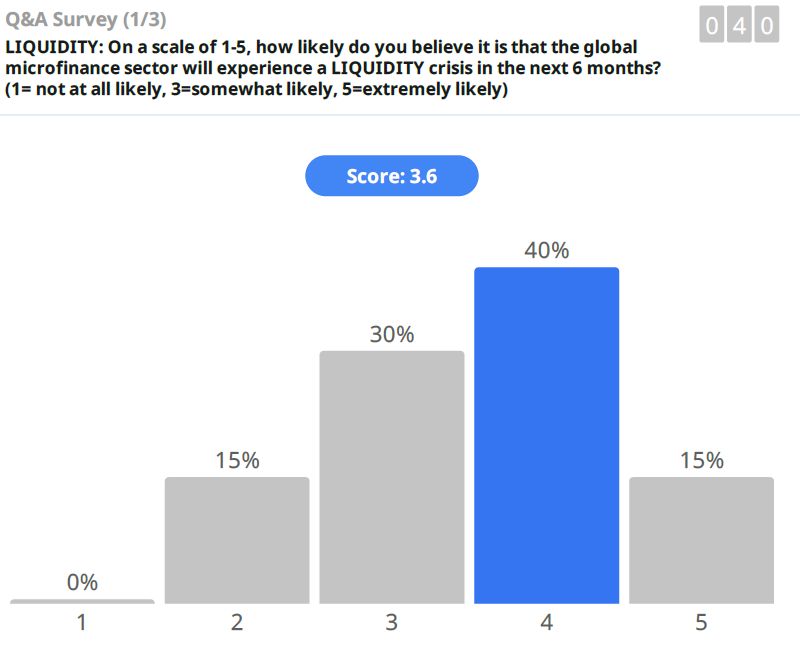
www.cgap.org/pulse-survey-results
 The CGAP Global Pulse Survey of MFIs

 • Response to stakeholder ask for comprehensive data
 • Meant to get a quick reading across the globe

 • Short, digital survey run every two weeks
 • Indicators spread over different waves
 • Only a small core is repeated in each wave

 • Implemented with MFR and hosted on ATLAS
 • Wave 2 has just closed and Wave 3 is now open
 • Data at www.cgap.org/pulse-survey-results

                                                        7

                                                        © CGAP 2019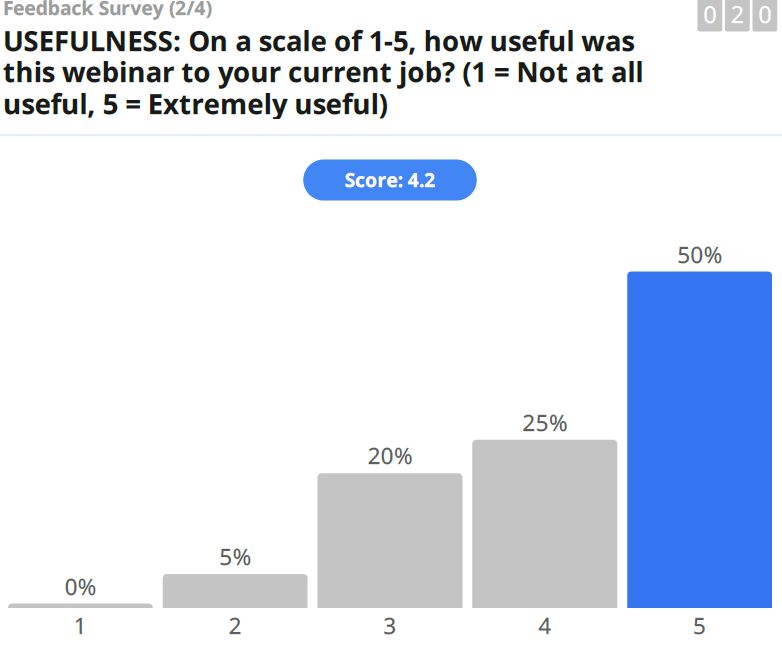
Go to
Agenda                   slido.com
                          #CGAP
• Introduction

• Survey Highlights

• Respondent Reactions

• Open Q&A

                                   8

                                   © CGAP 2019
The current sample
The 314 MFIs in our sample have a total of ~USD 18.7 billion in assets (those providing asset data and
excluding outliers), and an average of ~USD 73 million.
Region # of MFIs % Total Assets % Average Assets
Europe and Central Asia 17 5% 581,136,645 3% 41,509,760
Latin America and the Caribbean 83 26% 8,189,296,017 44% 120,430,823
Middle East and North Africa 24 8% 1,170,546,737 6% 65,030,374
South and South East Asia 42 13% 5,078,900,053 27% 130,228,206
Sub-Saharan Africa 148 47% 3,700,929,890 20% 31,904,568
Grand Total 314 18,720,809,344 73,414,938
Asset figures denominated in USD 9
© CGAP 2019The general level of stress is relatively high
Most participating MFIs report at least “severe stress” among the MFIs in their countries, with LAC
experiencing the most and ECA experiencing the least stress.
8.0
We asked, “How badly would
you say the microfinance
sector in your country is 6.5 6.3
6.2 6.2 6.2
struggling right now?” 6.0 6.0
6.0 5.8
5.4 5.5
5.3
Respondents answer on a 4.7
scale ranging from:
4.0
• (1) “business as usual”
• (5) “severe stress”
• (10) “looming disaster” 2.0
Europe and Latin America Middle East South and Sub Saharan Total
Central Asia and the and North South East Africa
Caribbean Africa Asia
6/19/2020 7/22/2020
N=
6/19/2020 17 80 23 42 145 307
7/22/2020 13 36 12 19 61 141
10
© CGAP 2019Liquidity
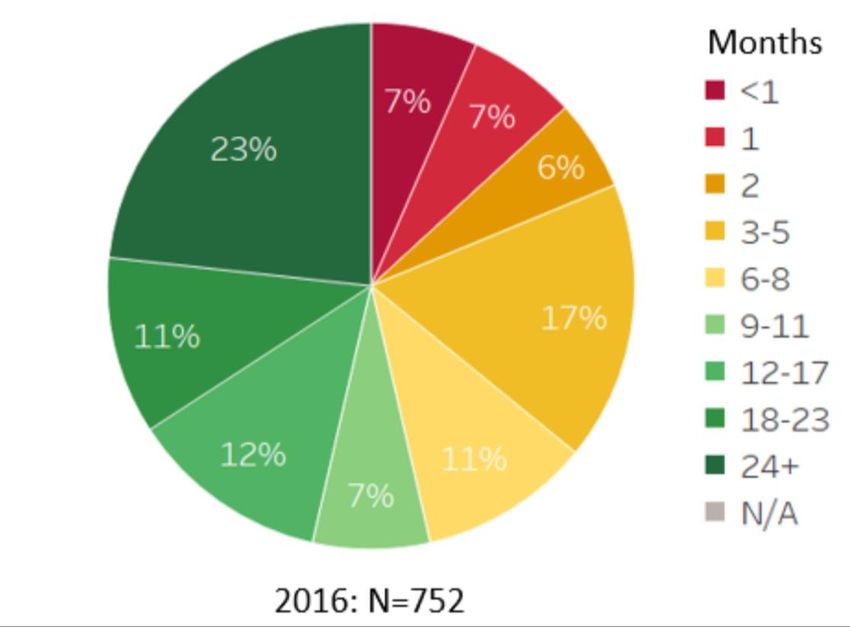
11Liquidity is overall better than feared
MFIs in our sample report adequate liquidity needs (as of May) with no evidence of a generalized liquidity crunch—at least
for now. The picture is quite similar to the analysis of pre-crisis data done by Daniel Rozas recently.
2016 2020
17%
20%
5%
Months
5%Liquidity looks tightest in LAC, followed by SSA and MENA
Roughly a fifth (19%) of MFIs 100%
in Latin America and the
Caribbean have less cash 11%
80% 16%
than their quarterly opex. 19%Unsurprisingly, larger MFIs tend to have deeper cash reserves
Comparing MFIs by total assets on how many months of operational expenses they can cover with cash and
(90 day) liquid assets on hand
Just 6% of MFIs with over 100%
$100m in total assets have less
6%
cash than opex for the next
three months. 70% of them can 80% 15%
carry on for a year or more 23%
without any additional liquidity.Upcoming debt repayments add to the liquidity pressure
35% MFIs have less cash and liquid assets on hand than their quarterly opex (at pre-crisis levels) plus the
debt repayments scheduled for the next quarter
Cash + liquid assets vs OPEX Cash + liquid assets vs OPEX + 90-day debt
17% 31% Months
5% Months
5% 12% 10%How do MFIs feel about their own liquidity and solvency?
We simply asked MFIs directly whether they expect a liquidity or solvency problem in the near future.
Anticipate liquidity shortage in next 90 days Anticipate solvency issue in next 6 months
Data as of 22 July 2020
29% 35%
No Yes No Yes
N=142 N=142 16
© CGAP 2019Nearly 60% of MFIs have had discussions with their funders
about debt moratoria, rescheduling, or a capital increase
This shows the share of MFIs 42%
who have had discussions
with their funders about at
least one of these topics.
16% of all MFIs say they have
Data as of 22 July 2020
had such conversations about 24%
more than of these one topics. 22%
20%
42% of MFIs say they have
not had discussions with their
funders about any them.
Again this is early data from a
smaller sample, so should be
assessed accordingly.
Moratorium Restructuring Capital Increase None of the Above
N=147 17
© CGAP 2019Most of those conversations have already led to agreements
with funders around moratoria and restructuring
Agreement with funders on debt moratorium Agreement with funders on debt restructuring
7% 10%
Data as of 22 July 2020
19% 16%
73% 74%
No Yes N/A No Yes N/A
N=147 N=147 18
© CGAP 2019About half of discussions have led to agreements on capital
increases and around 1 in 8 to cancellation of some debt
Agreement with funders on debt cancellation Agreement with funders on capital increase
13%
22%
Data as of 22 July 2020
10%
3%
74% 78%
No Yes N/A No Yes N/A
N=147 N=147 19
© CGAP 2019Operational Responses
202 in 3 MFIs report reducing lending due to COVID-19
More than two thirds of those MFIs say they have cut disbursements by more than half, with 10% having
stopped lending altogether due to the pandemic.
Have reduced lending due to COVID-19 Reduction in lending vs normal levels
10%
Data as of 22 July 2020
33%
69%
57%
Reduced by less than half
Reduced by more than half
Yes No Completely stopped
N=147 N=103 21
© CGAP 201985% of MFIs are giving lenience to their clients
Nearly two thirds of MFIs are offering customers repayment moratoria, restructuring of loans, or both. But
only 1 in 10 MFIs say they have started writing off more loans due to COVID.
MFI measures for borrowers
63% 64%
Data as of 22 July 2020
15%
10%
Repayment moratoria (deferrals) Restructuring loans Writing off non-performing loans No measures
N=147 22
© CGAP 2019Rules and practices vary on implementation of moratoria
Among the 63% of our MFIs that are issuing moratoria, a third of them say it is mandatory. The most
common approach is to extend moratoria to all clients who ask for it, but a range of practices exist.
Repayment moratoria mandatory Repayment moratoria applicability
1%
14%
28%
Data as of 22 July 2020
35%
64% 12%
46%
To all borrowers (100%)
Yes To all borrowers who request it
No To some borrowers, as defined by the authorities
Not Sure To some borrowers, as defined by us (the MFI)
N=91 N=90 23
© CGAP 2019Branch closures are not very extensive
16% of MFIs have reported branch closures, of which most have shut down less than 20% of their branches.
Very few (2%) report closing part of agent networks.
Any branches closed Proportion of branches closed
9%
Data as of 22 July 2020
16%
9%
80%
N=147 N=23 24
© CGAP 2019Most MFIs implement WFH and many have time reductions
Few MFIs report large scale home-based work arrangements and reduced working hours for staff
Home-based work and reduced working hours Extent of HBW and reduced hours
60%
54%
50%
41%
Data as of 22 July 2020
40%
30%
20%
10%
0%
80%
Staff is working from home Staff is working reduced
hours or placed on leave
% staff working from home
% staff on reduced hours or paid/unpaid leave
N=147 N=79 & 60 25
© CGAP 2019MFIs are expanding the use of voice and digital channels
Call centers are most the common response. Around 30 percent of MFIs are adopting new digital channels
and expanding existing ones. But only around 1 in 7 MFIs currently have more than 30% digital transactions.
Operational changes made on channels Current digital share of all transactions
35%
31%
29%
25%
Data as of 7 July 2020
No transactions
35%
30%
13%
Call center Existing digital New digital 9% No answer
operations have customer channels customer channels
been scaled up have been have been
expanded implemented
N=147 26
© CGAP 2019Overview of MFI responses to the crisis
102
92 94
79
60
51
46
42
Data as of 7 July 2020
23
18 15
2
N=147 27
© CGAP 2019Portfolio Quality / Solvency
28PAR30 nearly doubled across global MFI portfolio
The weighted average PAR30 across our sample nearly doubled by May 15, 2020, compared to a June
2019 baseline.
PAR30 by Region (Weighted Averages, by assets)* PAR30 by Region
(Simple Average)
15.9% 16.3%
14.7%
12.4%
12.0% 12.1% 12.5% 12.3%
11.8%
10.5%
8.1% 9.1% 8.8%
7.7% 8.1% 8.5%
6.2%
5.3% 5.4%
4.5%
2.7%
ECA LAC MENA SSA SSEA Total PAR30 Simple
6/30/2019 4/30/2020 5/15/2020 Average
N=
PAR30@6/30/2019 14 63 17 108 39 241 252
@4/30/2020 14 68 18 116 39 255 267
@5/15/2020 8 16 6 38 9 77 101
29
© CGAP 2019All regions have seen increases in PAR30
All regions have seen a material increase in PAR30 compared to the June 2019 baseline. LAC and SSA
data here are likely more reliable, given sample sizes.
PAR30 by Region (Weighted Averages, by assets)* PAR30 by Region
(Simple Average)
15.9% 16.3%
14.7%
12.4%
12.0% 12.1% 12.5% 12.3%
11.8%
10.5%
8.1% 9.1% 8.8%
7.7% 8.1% 8.5%
6.2%
5.3% 5.4%
4.5%
2.7%
ECA LAC MENA SSA SSEA Total PAR30 Simple
6/30/2019 4/30/2020 5/15/2020 Average
N=
PAR30@6/30/2019 14 63 17 108 39 241 252
@4/30/2020 14 68 18 116 39 255 267
@5/15/2020 8 16 6 38 9 77 101
30
© CGAP 2019Simple average PAR30 is higher than weighted
Simple average PAR30 approximates how the average MFI’s portfolio is doing, and shows lower portfolio
quality. Weighted average approximates how the global portfolio of MFI loans is performing.
PAR30 by Region (Weighted Averages, by assets)* PAR30
(Simple Average)
15.9% 16.3%
14.7%
12.4%
12.0% 12.1% 12.5% 12.3%
11.8%
10.5%
8.1% 9.1% 8.8%
7.7% 8.1% 8.5%
6.2%
5.3% 5.4%
4.5%
2.7%
ECA LAC MENA SSA SSEA Total PAR30 Simple
6/30/2019 4/30/2020 5/15/2020 Average
N=
PAR30@6/30/2019 14 63 17 108 39 241 252
@4/30/2020 14 68 18 116 39 255 267
@5/15/2020 8 16 6 38 9 77 101
31
© CGAP 2019Smallest MFIs most affected
Smaller MFIs started off with higher PAR levels and are likely under the most severe stress as a result of the
pandemic.
PAR30 by MFI Size (Simple Averages)
22.2%
15.9% 16.3%
14.9%
12.2% 12.4%
11.4% 11.2%
8.0% 8.7% 8.8%
6.2%
Assets < US$ 10MM US$ 10MM - US$ 100MM > US$ 100MM Total
N= 6/30/2019 4/30/2020 5/15/2020
PAR30@6/30/2019 89 108 49 252
@4/30/2020 97 111 52 267
@5/15/2020 32 44 23 101
32
© CGAP 2019Women-focused MFIs are experiencing higher PAR
MFIs with mostly women borrowers tend to have higher PAR30 levels. This is at least in part driven by the
fact that such MFIs tend to be smaller, with ~3/4 having less than US$100mm in assets.
PAR30 by MFI Gender Focus (Simple Averages)
18.9%
16.3%
13.7%
13.0% 12.4%
12.2%
9.7%
8.8%
8.1%
Women < 60% Borrowers Women > 60% Borrowers Total
N= 6/30/2019 4/30/2020 5/15/2020
PAR30@6/30/2019 127 119 252
@4/30/2020 136 125 267
@5/15/2020 50 51 101
33
© CGAP 2019High levels of restructured and moratoria driving risk
MFIs have large restructured portfolios, driven in part by the moratoria put in place as a result of the
pandemic.
“Troubled Portfolio” = PAR30 + Restructured + Moratorium
(% of Loan Portfolio, Simple Averages)
75%
55%
50% 45%
35% 32%
30%
30% 48%
25% 22%
24% 14% 20%
13%
11% 15% 16% 12%
9% 7%
0%
ECA LAC MENA SSA S&SEA TOTAL
PAR30 @ 4/30/20 Restructured + Moratoria @ 4/30/20
N=
PAR30 15 70 18 124 40 267
Rest. + Morator. 15 66 18 114 35 248
34
© CGAP 2019MFIs entered the crisis with strong capitalization
MFIs in our sample have a total equity / assets ratio of ~28%, with smaller MFIs having more (~32%) and
larger MFI’s having less (~23%) equity.
Equity / Assets by Region Equity / Assets by MFI Size
(%, Simple Averages, as of 4/30/20) (%, Simple Averages, as of 4/30/20)
44%
33% 32%
28% 28% 28% 27% 28%
22% 23%
ECA LAC MENA SSA S&SEA TOTAL $100m TOTAL
13 62 17 100 37 N = 229 79 102 48 N = 229
35
© CGAP 2019Comparing equity to troubled portfolio is essential
The MFIs in our sample that provided all the requisite data have (on average) more equity than troubled
portfolio, indicating a low risk of insolvency (as of May 15, 2020).
Troubled Portfolio Vs Equity* Solvency Scenarios*
(Simple Average) The chart below illustrates how much equity would remain, under four scenarios of losses
from the troubled portfolio
34%
27%
% of Total Assets
17%
(% of Total Assets)
Remaining Equity
29%
10% 23%
18%
12%
Troubled Portfolio 0%
Equity
N=
78 Equity/Assets
75 (Restr.+ Morat.)/Assets 20% 40% 60% 80%
78 PAR30/Assets Assumed Losses from Troubled Portfolio
(% Written Off)
*Note: The analysis here mixes data from different dates, piecing together what is available from the survey. To calculate these figures, we used , and all from 5/15/20. And we used and
36
from 4/30/20. We used these to calculate , , and for each institution that
shared the data for each of those figures, and are presenting the averages here. © CGAP 2019Solvency will depend on losses from troubled portfolio
In a scenario where only 20% of the trouble portfolio results in losses (80% recovery), capitalization would
remain strong (~29% equity/assets). However, if 80% is lost (20% recovery), solvency would be at risk.
Troubled Portfolio vs Equity* Solvency Scenarios*
(Simple Average) The chart below illustrates how much equity would remain, under four scenarios of losses
from the troubled portfolio
34%
27%
% of Total Assets
17%
(% of Total Assets)
Remaining Equity
29%
10% 23%
18%
12%
Troubled Portfolio 0%
Equity
N=
78 Equity/Assets
75 (Restr.+ Morat.)/Assets 20% 40% 60% 80%
78 PAR30/Assets Assumed Losses from Troubled Portfolio
(% Written Off)
*Note: The analysis here mixes data from different dates, piecing together what is available from the survey. To calculate these figures, we used , and all from 5/15/20. And we used and
37
from 4/30/20. We used these to calculate , , and for each institution that
shared the data for all of those figures and are presenting the averages here as an approximation of 5/15/20 figures. © CGAP 2019Another approach to assessing solvency yields more data …
Comparing PAR30 and restructured portfolio as % of loan portfolio with equity as % of assets (note different
denominators), yields more observations in our sample.
Troubled Portfolio [(PAR30 + Restructured + Moratoria)/Gross Loan Portfolio]
Vs. Capital (Equity/Assets)
ECA LAC MENA SSA S&SEA Total
57%
54% Restructured +
Troubled Portfolio (% of Portfolio),
49% Moratorium @ 5/15/20,
Equity (% of Total Assets)
46% assuming no change
41% from 4/30/20
44% 35% 36%
33% 33% 36% 32%
29%
24% 20%
20% 20% 27% 29% 13% 27% 28%
22%
12%
16% 22%
13% 12% 16%
9% 9% 8% 8% 8% 11%
5%
PAR30/GLP PAR30/GLP (Restr.+ Morat.)/GLP Equity / Assets
@4/30/2020 @5/15/2020 @4/30/2020 @4/30/2020
N=
PAR30@4/30/2019 15 69 15 109 35 243
PAR30@5/15/2020 8 20 3 35 11 77
Restr.+Morat. 15 65 15 99 32 229
Equity / Assets 15 65 14 106 34 234
38
© CGAP 2019… and allows for some regional comparisons
This approach illuminates regional differences. S&SEA figures look alarming, but sample size is tiny
compared to the region’s MFI sector. SSA and LAC have larger samples and also shows signs of strain.
Troubled Portfolio [(PAR30 + Restructured + Moratoria)/Gross Loan Portfolio]
Vs. Capital (Equity/Assets)
ECA LAC MENA SSA S&SEA Total
55% 56% Restructured +
Troubled Portfolio (% of Portfolio),
Moratorium @ 5/15/20,
48%
Equity (% of Total Assets)
45% 46% assuming no change
from 4/30/20
35% 44% 30% 36% 36%
33% 32%
30%
24% 26% 33%
22% 14% 20%
28% 28% 28%
13% 22%
16% 22%
11% 13% 15% 16% 12% 16%
9% 9% 7% 8%
PAR30/GLP PAR30/GLP (Restr.+ Morat.)/GLP Equity / Assets
@4/30/2020 @5/15/2020 @4/30/2020 @4/30/2020
N=
PAR30@4/30/2019 15 70 18 124 40 267
PAR30@5/15/2020 11 22 7 47 14 101
Restr.+Morat. 15 66 18 114 35 248
Equity / Assets 13 62 17 100 37 229
39
© CGAP 2019Go to
Agenda slido.com
#CGAP
• Introduction
• Survey Highlights
• Respondent Reactions
• Open Q&A
40
© CGAP 2019Questions for Respondents
Please take a maximum of 5 minutes to share your perspectives on and responses to the
crisis, answering the following questions:
1. What are you seeing? How do the survey results compare to what you have seen
regarding how the COVID-19 pandemic and the associated shutdowns have affected
MFIs?
2. How is it affecting you? How is the pandemic impacting your organization?
3. What are you planning to do about it? Describe what actions you have taken or are
considering in response to the crisis?
4. Where is greater collaboration needed? Are there issues where you believe the sector
would benefit from more collaboration from other types of stakeholders?
41
© CGAP 2019Speakers
CGAP Moderators
Peter Zetterli Alexander Sotiriou
Senior Financial Sector Specialist Senior Financial Sector Specialist
Panelists
Momina Aijazuddin Jérôme Savelli Andrée Simon
Global Head: Chief Risk Officer President and CEO
Microfinance and Financial Inclusion Symbiotics FINCA Impact Finance
International Finance Corporation (IFC)
© CGAP 2019Go to
Agenda slido.com
#CGAP
• Introduction
• Survey Highlights
• Respondent Reactions
• Open Q&A
43
© CGAP 2019Questions and comments from the audience
WebEx Q&A WebEx Chat
Pose questions directly to the panelists Share your own views and experiences, or
and presenters. reactions on today’s discussion.
• Please indicate if your question is intended • What are you seeing? How do the survey
for a specific person. results compare to your own intel and
experiences?
• Feel free to share your name, country and
organization (but it’s not mandatory) • What is most badly needed? How can
different stakeholders (funders, regulators,
or CGAP) best support the sector?
44
© CGAP 2019Thank you For the latest on our survey, including
analysis and raw data, please visit:
www.cgap.org/pulse
And please encourage all MFIs to take
the survey!
45
© CGAP 2019www.cgap.org
© CGAP 2019Appendix 1 – Audience Q&A
47Q&A
Q: Did you get any data on the performance of deposits (among deposit taking institutions)? To what extent are we seeing
withdrawals (which we might expect from low income households needing to meet day to day needs in the face of the
pandemic)?
A: we have a baseline but will only be able to calculate a trend once we have one more data point. So this is one area we
can't yet speak to. Anecdotally we have the sense that it hasn't been a major issue and our liquidity data align with that.
Q: while this debt restructuring and moratorium will mfis are keeping the credit scores of clients ideal?
A: Whether and how to adjust credit risk is a very difficult question. As mentioned we have another workstream focused
on guidance to MFIS which will try to address this question.
Q: Have you attempted to compare PAR30 versus PAR90, if not why did you prefer to base the analysis on PAR30?
A: We had to choose one since we wanted to keep the survey short. In this rapidly evolving scenario, we figured PAR30 is
more useful in that will reflect changes more quickly than PAR90
48
© CGAP 2019Audience Q&A
Q: Do you think that the long gap between liquidity shortages and insolvency reflect a mismatch issues in MFIs, in
managing their cash flows. which is mean not only from the impact of covid19
A: not sure what you mean about the gap between liquidity and solvency? In general these are failry distinct metrics that
depend on different things, though ultimately they are of course connected.
Q: Do you think that reduced lending increase percentage of productive loan? For example in Jordan we inform MFIs to
concentrate lending for productive loan
A: Short answer: I don't know - we don't have data on this. But I'm not sure about that: with many businesses closed due
to the pandemic, productive loans are also going to be difficult to make in many markets.
Q: I think the main two challenges to adopt Digital channels for MFIs are the ICT infrastructure including payment
infrastructure and because of the cultural readiness of the MFIs clients mainly in the MENA
A: CT is definitely a major constraint for virtually all MFIs, large or small. I may disagree about the cultural readiness
though: the rapid spread of mobile money has shown that customers are perfectly able and willing to go digital.
49
© CGAP 2019Audience Q&A
Q: Do you meant about insolvency mainly toward MFIs lenders?
A: No - insolvency in the sense of the viability of the institution, regardless of funding sources.
Q: Thanks for your responses, unfortunately the cultural readiness is it one of the main challenges in the MENA and this
related to many issues I can’t clarify them here because of the limited numbers of words I have to write.
Q: When do you expect to provide the next update and what will be the survey date? Thanks, this is great!
A: Thanks for the positive feedback! As mentioned Wave 3 closed today so we hope to put out some additional findings in
the next couple of weeks.
Q: Congrats for the survey, important to have it updated every 3 or 6 months, to be able to analyze these trends. It would
be interesting to explore the perspective of the consolidation of the industry (more M&As among MFIs) vs. innovative
business models.
A: Thank you for your positive feedback, Irina. We have opened up Wave 4 just now, and plan to collect monthly data for
the foreseeable future. Stay Tuned for future insights and webinars.
50
© CGAP 2019Audience Q&A
Q: On the slide, you have 148 MFIs in SSA, or ""47%"". 47% of what? Probably I missed the explanation (apologies). This
cannot be 47% of all MFIs in SSA, as there are many more than 300. Is this % of MFIs in your network?
A: Hi Nina, thanks for your question. Yes indeed - the 148 MFIs in SSA represent 47% of all MFIs in our sample.
Q: I wonder if cutting it by regulated vs u regulated would offer more insight than loans to women vs loans to men
A: Our current analysis of PAR isn't sex disaggregated (loans to men vs women), rather it is disaggregated by gender
focus of MFI (defined as >60% borrowers being women)
Q: If you look at what banks are doing on the same countries, you’ll find they are hoarding cash and lines of credit. The
issue will be how to stimulate lending again, not who will survive. With MFIs we will see the same for the more viable
regulated ones.... 2/2 cont... MFIs w poor governance and underwriting won’t make it for sure. Rather than prop them up, I
would focus on interventions to push liquidity out (including to women and poor) by the top tier institutions, how can IFC
penalize hoarding?
Q: I guess my point is that the headline is misleading. PAR isn’t higher bc they lend to women necessarily but because
they are small, unregulated, in less mature markets, etc perhaps?
51
© CGAP 2019Audience Q&A
A: Indeed there's a high degree of overlap between those features. But the implications for female borrowers are
nevertheless real!
Q: Agree - implications would have been a good title...
Q: I wonder if the investor of liquidity risk isn’t going to choke lending and recovery. The MFIs exist for that, not to satisfy
shareholders’ needs. Is there a tension you all see here?
Q: what is the effective strategy you would recommend for loan recovery during C during COVID-19?
A: This is also a very difficult question. As mentioned we have another workstream focused on guidance to MFIS which
will try to address this question.
Q: Can you indicate if these MFIs are regulated or not? How does the liquidity situation compare between regulated and
unregulated?
Q: How does this compare with pre COVID data?
52
© CGAP 2019Audience Q&A
Q: Hi, do you have any specific observations on Tanzania?
Q: Would you have a breakdown on %staff on paid leave and %staff on unpaid leave? Thank you!
Q: In terms of liquidity needs it would be helpful to have a longer time horizon, e.g. 6 months or even more (9-12ms). Can
this be added to the survey? In reality rescheduling of current debt obligations in 2020 will make liquidity an issue mainly
in 2021.
Q: Later on, may be CGAP can do a small panel study on how COVID-19 has affected household consumption growth
and asset growth, like this one here https://www.linkedin.com/posts/activity-6685888910951776256-f0Sp Or a follow up
study (panel data collection on the same households) can be done on past CGAP studies to see the impact of COVID-19
on household’s demand for financial products. E.g. a follow up study on this small-holder farmer CGAP study that was
done in Tanzania https://www.cgap.org/sites/default/files/Working-Paper-Smallholder-Survey-Tanzania-May-2016.pdf
Q: In Nepal, MFIs have different types of challenge. MFIs have cash surplus (excess cash) and dont find the opportunity
to make investment. Their profitability has been increased (data shows) in comparison to last year! Loan recovery is
almost 85%! All MFIs of Nepal follow Grameen Model. What would be the alternative model to Grameen (Group based)
lending model which is really difficult to continue due to Social Distance?
53
© CGAP 2019Appendix 2 – Slido Poll Results
54Webinar Slido Poll Results: Warm-Up
55
© CGAP 2019Webinar Slido Poll Results: Q&A
56
© CGAP 2019Webinar Slido Poll Results: Q&A (Cont)
57
© CGAP 2019Webinar Slido Poll Results: Feedback for CGAP
58
© CGAP 2019Webinar Slido Poll Results: Feedback for CGAP (cont.)
FOLLOW-UP: Using only 1-2 words, which ANYTHING ELSE: Is there anything else you’d
areas would you like to see us dig into like to tell us?
further with the survey?
• interest accruals • Solvency • We need to investigate how MIVs / MFIs / Policy makers are
• client welfare women 's • Customer communication treating interest accruals and interest payments. Some
problems on repayment • Whats needed wholesale lenders (e.g. MIVs) are still demanding interest
payments while on the other hand some MFIs are accruing
• Management and Equity • informal MFIs interest -- what does this mean for MFI survival rate + client
remaining stressing access • Solvency. Solvency. protection?
to funding
• More time for Q&A
• ESG
• Impact on customers • Great webinar - data presentation and panel... both were
• Digitization
great! For future ones, video of the presenters would be nice
• role of savings mobilizaiton
in strength of MFIs
• Excellent
• Micro-borrower income
impact of Covid19
N = 229
59
© CGAP 2019Appendix 3 – Additional Pulse Survey
Results
60Simple average PAR vs Weighted Average
Comparing the simple average PAR levels (which are mostly higher) with the PAR levels weighted by assets
shows that the average MFI has lower asset quality than the average MFI asset.
PAR30 by Region (Simple Averages)* PAR30 by Region (Weighted Averages, by assets)*
22.1%
16.3%
16.3%
9.1% 14.9% 15.8% 15.9%
12.4% 12.1% 14.7% 12.5%
10.6% 12.7% 12.0% 11.8%
11.1% 12.3%
7.7% 10.5%
10.9% 9.1% 8.5% 9.1%
8.3% 8.1% 8.5%
7.1% 7.4% 8.8% 6.2% 8.1%
4.5% 5.3% 4.5% 5.4%
2.7%
ECA LAC MENA SSA SSEA Total ECA LAC MENA SSA SSEA Total
N= 6/30/2019 4/30/2020 5/15/2020 6/30/2019 4/30/2020 5/15/2020
PAR30@6/30/2019 15 65 17 115 40 252 14 63 17 108 39 241
@4/30/2020 15 70 18 124 40 267 14 68 18 116 39 255
@5/15/2020 11 22 7 47 14 101 8 16 6 38 9 77
61
© CGAP 2019You can also read