HOUSEHOLD SPENDING INTENTIONS SERIES - JULY 2019 - COMMBANK
←
→
Page content transcription
If your browser does not render page correctly, please read the page content below

Household Spending
Intentions Series.
July 2019

Household Spending Intentions Series

A new view on
Australia’s spending.
However you do business or invest, knowing what’s around the corner can
keep you one step ahead.
 Whether you are at the helm of a family business, a policy maker, an investor
or one of Australia’s corporate enterprises - robust insights on shifting
consumer spending intentions are critical for your plans for the future and
determining whether it’s time to ramp up or down.
CommBank’s Household Spending Intentions series combines our spending
data, one of Australia’s largest financial data sources, with Google Trends
publically available search activity. By connecting with advance readings on
actual spending data to intentional data, our analysis should provide an early
indication of prospective spending trends.
Tracked across seven spending sectors, our analysis can offer a future lens
into specific industries.
When these sectors are looked at together, the Household Spending
Intentions series provides a holistic view on the changing spending
behaviours of Australians and the potential implications for the economy.

                                                                                                                   2
Household Spending Intentions Series

                  The idea
                                                                         • CBA indicators give an up-to-the-minute read on household activity.
                                                                         • Search information from Google Trends adds “intentions” into the mix.
                                                                         • The overall message about household spending intentions remains negative.

The need to get ahead of emerging trends has never               Hence the Economist’s Lament: “if only we had one                 Wage price index forecasts*
been greater. Policy makers need to keep ahead of                more piece of data… we’d know for sure”.
changes in demand for public goods and services if
they want to keep the voters happy. Companies need               The sharp fall in GDP, in Q1 2011, highlights another
to keep ahead of changes in demand for private goods             point. The decline was initially reported as a very large
and services if they want to keep their shareholders             fall of 1.2%. The decline is now put at a far more modest
happy. Individuals need to keep ahead to maximise their          0.3%. That is a very different economy from the one
personal utility.                                                reported at the time.

We all need early warning signs of emerging risks                Quarterly GDP data is essentially a weighted average
and issues.                                                      of monthly flows. The largest weights in this monthly
                                                                 scheme are on the months around the turn of the
Data analysis is one way to try and get an edge.                 quarter. If the growth rate in each month was the same,
Economists, for example, have long tried to predict              some 55% of March quarter GDP growth reflected what
the future based on past trends and hypothesised                 was happening in the economy in December/January.
relationships. With mixed results. Everyone knows the            This is a very long time ago for those wanting to know        *February SMP forecasts. Source: ABS: RBA

Galbraith line about “the only function of economic              where the economy is right now.
forecasting is to make astrology look respectable”!
                                                                 When peering into the future it is essential to know
Those who live in glass houses shouldn’t throw stones.           where you are standing. And here the Commonwealth
But Budget forecasters trying to get their revenue               Bank has an advantage. The Bank’s business generates a
numbers right or central bankers trying to nail down             significant amount of close to “real time” information on
wages growth haven’t covered themselves in glory in              how the economy is travelling.                                                      Fiscal position
                                                                                                                                             (underlying balance, % of gdp)
recent years.
                                                                 This information relates particularly to the household
The pitfalls of data use are well known. The data is only        sector. Households are the dominant part of the
available with a lag. It is subject to revision. If it’s based   economy and drive much of its activity and volatility.
on a survey, then there is sampling error to worry about.        From that perspective, CBA is the largest financial
The underlying economic relationships can change. The            services organisation in the country with over sixteen
list goes on.                                                    million customers. The interaction with these customers
                                                                 generate a vast array of data on the activities of
GDP is perhaps the most fundamental of economic                  Australian households. An ongoing sample of more
statistics. But it encapsulates all of the problems that         than 2½ million households who are CBA customers, for
forecasters face. The March quarter GDP data, the most           example, gives us information on income, wealth and         Source: Budget Papers
recent observation, was not published until early June.          spending trends shortly after the end of each month.
This release is more than two months after the quarter
ended. We won’t know how the economy was travelling              CBA data measures are really coincident indicators of
at the end of 2018/19 until early September.                     economic activity. But they are leading indicators in a
                                                                 publication sense.

                                                                                                                                                                                       3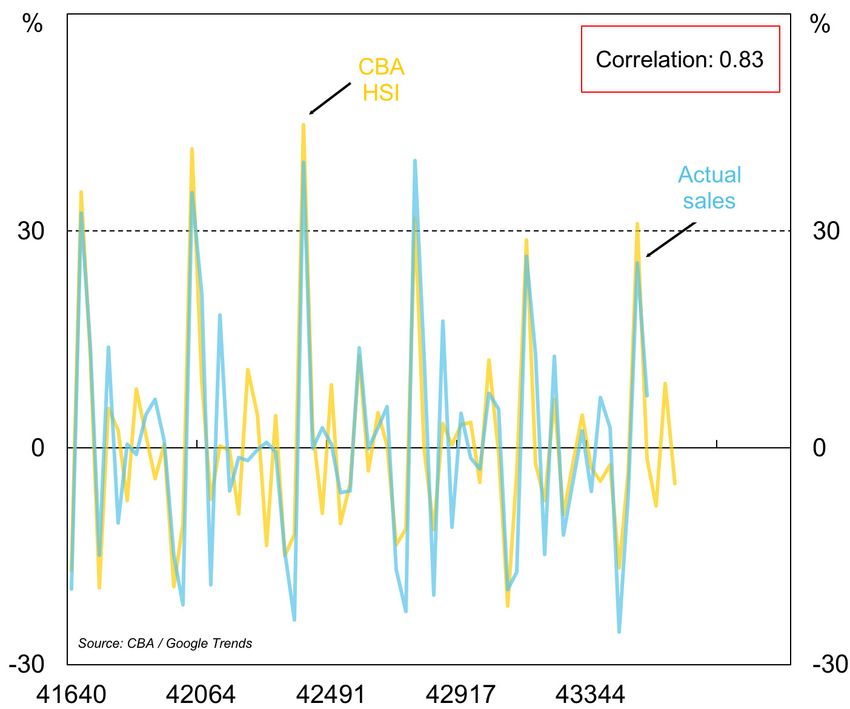
Household Spending Intentions Series

We have used this data to investigate topics related to wages,          Monthly weights in quarterly data*                               Number of google searches
the household debt "crisis" and a new quarterly update on              (weight of each month in determining quarterly growth)
household income, spending & wealth.
                                                                          *Assumes equal 1% rises in each month                                             Source: Search Engine Land / Internet Live Stats
Even with the best data, however, economists have never been
very good in measuring and incorporating intentions into their
forecasts.
At the most basic level, the act of spending is preceded by
an intention to spend. Spending money on a holiday is a
good example. By the time you’ve decided where to go on
tripzard.com, booked a flight on webjet.com, chosen a hotel
on tripadvisor.com, topped up your Travel Money Card at
commbank.com.au and decided what to do when you get there
on LonelyPlanet.com you have scattered a fair amount of clues
about your intention to spend!
Search activity is one way to track these intentions. And Google
Trends provides the needed tools.
Google Trends allows users to see how frequently particular
search terms are used. On some estimates, Google was handling
two trillion search requests per year in 2016, or a leisurely 63,000
per second. No doubt the number is higher now. Indeed on
some counts the search rate is now running at around 75,000
per second (click here for some live stats).
                                                                                              What is the eu?                             Trending google searches
This is the definition of “BIG DATA”. And these searches, as the                              (UK searches, peak=100)                                      (Peak=100)
facing charts show, throw up some interesting insights into the
                                                                          Source: Google Trends                                    Source: Google Trends
zeitgeist of the time.
There is now a substantial body of research that employs Google
Trends. Initially this research was more descriptive in nature but
has come to increasingly focus on forecasting.
Perhaps the most famous research was by Google itself. They
developed an early warning indicator of the spread of influenza.
(click here to access the article). By tracking searches related
to terms like “Cold/Flu Remedy” and “General Influenza
Symptoms” the researchers were able to predict the spread of
the disease 1-2 weeks ahead of the usual surveillance systems.
By combining the up-to-the minute data from CBA’s household
surveys with relevant searches from Google Trends it should be
possible to develop indicators of household purchase intentions.                                                                Jan-10           Jan-12      Jan-14                 Jan-16

                                                                                                                                                                                                               4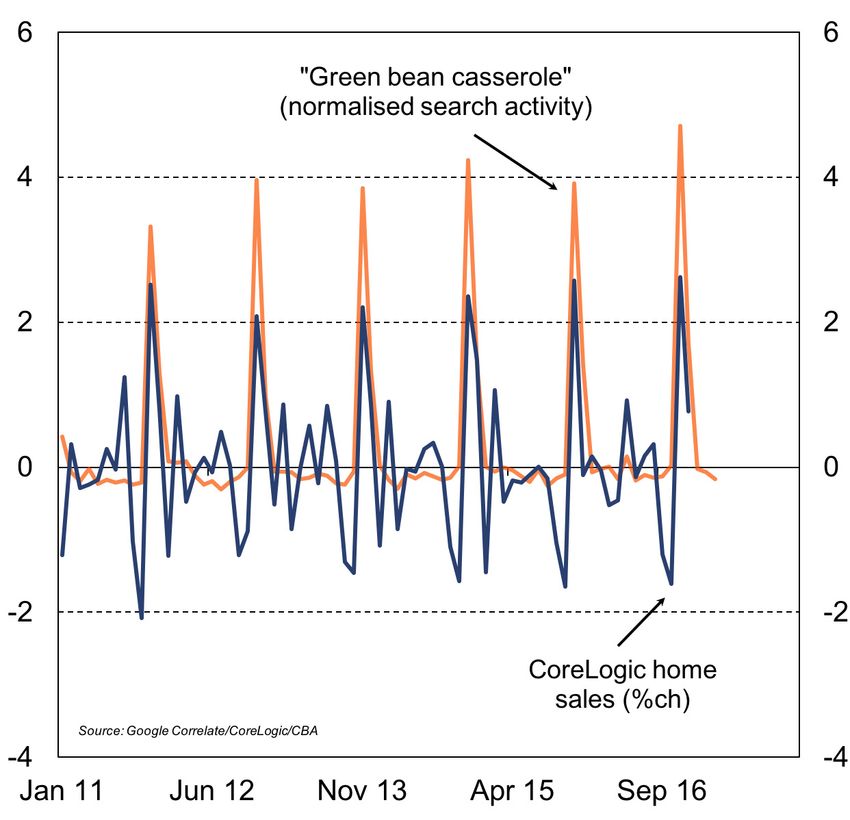
Household Spending Intentions Series

                The approach
The focus is on Australian households
and their spending intentions. The
approach is to employ the near real-time
spending readings from CBA’s household
transactions data, combine them with
relevant search information from Google
Trends and map the results to the
official data on consumer spending.                         Dwelling sales & search activity                                                     Dwelling sales
                                                                             (correlation coefficient: 0.72)                                    (monthly % change, nsa)
As noted earlier, CBA spending data is
derived from a sample of more than 2½
million households who are CBA customers.
Information on credit card usage, EFTPOS,
BPAY and direct debit gives a rich coverage
of the way households pay for transactions.
The use of Google search data requires
decisions to be made about relevant
search terms. The search terms need to
pass the pub test as well as meet the
more rigorous statistical standards.
So Google Correlate matches economic data
to search patterns. This tool reveals that
Australian dwelling sales are strongly correlated
with searches for “green bean casseroles”
with a three month lead. The correlation
coefficient is 0.72. We could posit that those
thinking about buying a house are busy
saving the deposit and looking for inspiration      Source: Google Correlate/CoreLogic/CBA                        Source: CBA / Google Trends
for a cheap meal. But in the end correlation
                                                                                                               Jan-14         Jan-15            Jan-16    Jan-17     Jan-18
does not mean causation. We should keep
looking for more relevant search terms.
Instead, combining CBA loan application
data with relevant Google searches
generates a home purchase intentions
indicator that leads the actual sales data
by four months. The statistical metrics are
quite good - the correlation coefficient
comes in at 0.83, for example.

                                                                                                                                                                                  5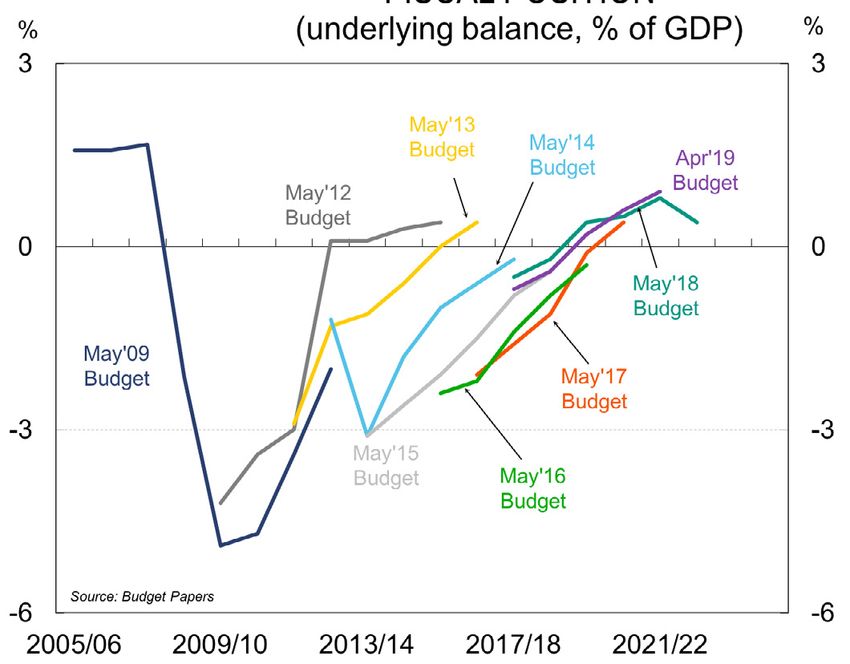
Household Spending Intentions Series
The results
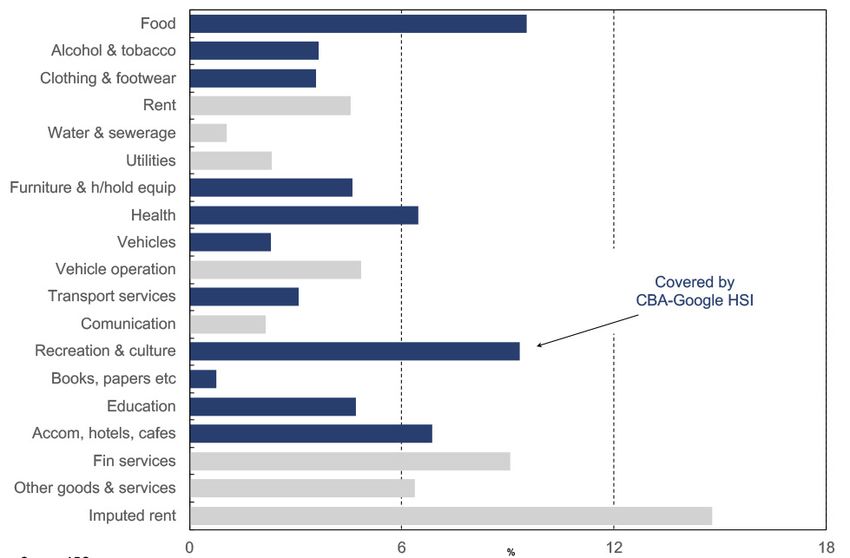
At this stage we have developed seven Household Spending Intentions Consumer spend in 2017/18 (% of total)
measures (HSI’s). They have been mapped to components of consumer
spending including retail spending, travel, health & fitness, entertainment,
education and motor vehicles.
These HSI’s cover about 55% of the total consumer spend. Future work will look
to expand our coverage to the remaining spending components.
Each indicator is a function of a comparable CBA transaction indicator and a
relevant Google search term.
The leading indicator properties of each HSI varies but the lead on reported
purchase activity is 1-4 months.
The latest readings for our Household Spending Intentions measures are
summarised in the table below. A more detailed analysis can be found in the
following HSI Dashboard.
The overall message about household spending intentions has changed over
the first half of 2019. The weakness evident since mid 2018 spilt over into the
early part of 2019. But a more diverse picture is now evident. Weakness persists
in the dominant retail and motor vehicle sectors. Other sectors appear to be
bottoming out (travel, entertainment) or picking up (health, education). The
turn in home buying intentions is particularly noticeable in recent months.
Source: ABS
This months snapshot
Home Buying Retail Motor Vehicle Entertainment Travel Education Health & Fitness
6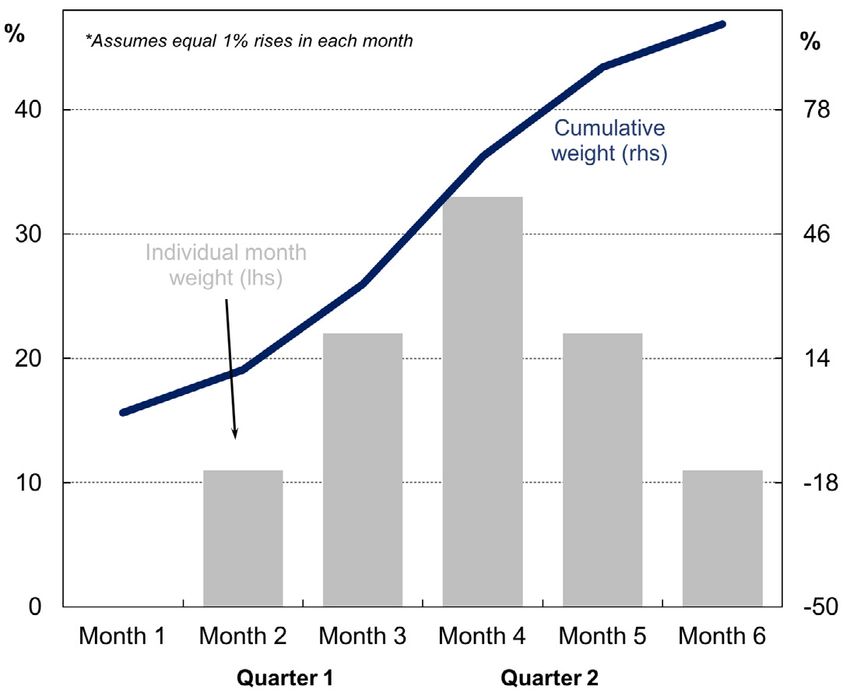
Household Spending Intentions Series

        HSI Dashboard
CBA HSI: Home buying    Home buying                                    CBA HSI: Retail sales        Retail
    (annual % change)
                        Spending Intentions                                (annual % change)
                                                                                                    Spending Intentions

                        •   Home buying intentions have been                                        •   Retail spending intentions have
                            in negative territory since mid 2018.                                       steadily trended lower since the start
                                                                                                        of 2018.
                        •   The pull back in buying intentions
                            indicates demand weakness was                                           •   The indications are that, aside
                            the trigger for falling prices, rather                                      from the occasional bounce, retail
                            than a supply glut as was the fear in                                       spending remains a fairly lacklustre
                            2017-18.                                                                    affair.
                        •   But current HSI readings suggest the                                    •   This weakness underlies the need for
                            market is now turning.                                                      income tax cuts to boost household
                                                                                                        spending power.

   CBA HSI: Travel      Travel                                       CBA HSI: Health & fitness      Health & fitness
    (annual % change)
                        Spending Intentions                                (annual % change)
                                                                                                    Spending Intentions

                        •   Travel spending intentions were                                         •   As with other HSI readings, health
                            relatively flat during 2018 but did                                         & fitness spending intentions
                            step down towards the end of the                                            weakened during 2018.
                            year.
                                                                                                    •   But the trend turned back into
                        •   This weakness continued through                                             positive territory in 2019.
                            H1 2019.
                                                                                                    •   Clearly the New Year’s resolutions
                        •   The array of negatives weighing on                                          about improving health and fitness
                            consumer sentiment have clearly                                             have kicked in!
                            made households more cautious
                            with their discretionary spending.

                                                                                                                                               7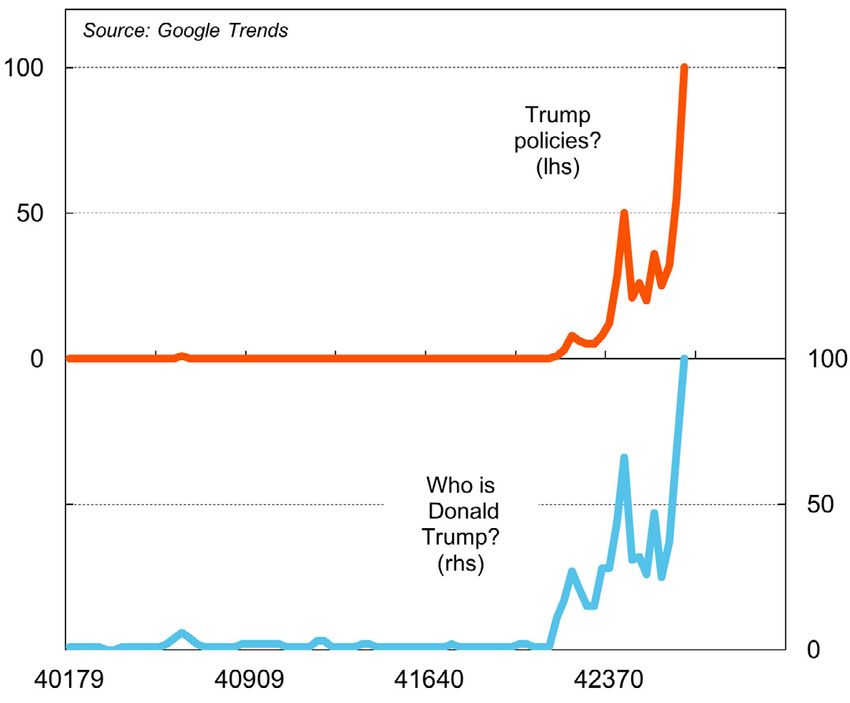
Household Spending Intentions Series

         HSI Dashboard
CBA HSI: Entertainment    Entertainment                              CBA HSI: Education        Education
     (annual % change)
                          Spending Intentions                           (annual % change)
                                                                                               Spending Intentions

                          •   The entertainment HSI provides                                   •   The one HSI that has retained a
                              another example of how household                                     positive momentum over the past
                              caution is restraining discretionary                                 couple of years is education.
                              spending.
                                                                                               •   The HSI points to some modest lift
                          •   There are, however, signs of                                         in education-related spending plans
                              stabilisation around mid 2019.                                       around mid 2019.

CBA HSI: Motor vehicles   Motor vehicle
     (annual % change)
                          Spending Intentions

                          •   Car sales has been one of the
                              weaker components of household
                              spending over the past year.
                          •   This weakness remains in spending
                              intentions around mid 2019.

                                                                                                                                     8
Talk to us
Visit commbank.com.au/spendingintentions
or email globalmarketsresearch@cba.com.au

Things you should know: This ‘Commonwealth Bank Household Spending Intentions’ series provides general market-related information, and is not intended to be an investment research report. The ‘Commonwealth Bank Household Spending Intentions’ series has been prepared without taking into
account your objectives, financial situation (including the capacity to bear loss), knowledge, experience or needs. Before acting on the information in the ‘Commonwealth Bank Household Spending Intentions’ series, you should consider the appropriateness and, if necessary seek appropriate professional
or financial advice, including tax and legal advice. The data used in the ‘Commonwealth Bank Household Spending Intentions’ series is a combination of the CBA Data and publically available Google Trends™ data. Google Trends is a trademark of Google LLC. Commonwealth Bank of Australia (the “Bank”)
believes that the information in this report is correct and any opinions, conclusions or recommendations are reasonably held or made, based on the information available at the time of its compilation, but no representation or warranty, either expressed or implied, is made or provided as to accuracy,
reliability or completeness of any statement made in this report. Any opinions, conclusions or recommendations set forth in this report are subject to change without notice and may differ or be contrary to the opinions, conclusions or recommendations expressed elsewhere by the Bank or any member of
the Commonwealth Bank of Australia group of companies. Any valuations, projections and forecasts contained are based on a number of assumptions and estimates and are subject to contingencies and uncertainties. Different assumptions and estimates could result in materially different results. The Bank
does not represent or warrant that any of these valuations, projections or forecasts, or any of the underlying assumptions or estimates, will be met. Past performance is not a reliable indicator of future performance. Where ‘CBA data’ is cited, this refers to the Bank proprietary data that is sourced from the
Bank’s internal systems and may include, but not be limited to, credit card transaction data, merchant facility transaction data and applications for credit. The Bank takes reasonable steps to ensure that its proprietary data used is accurate and any opinions, conclusions or recommendations are reasonably
held or made as at the time of compilation of this report. As the statistics take into account only the Bank’s data, no representation or warranty is made as to the completeness of the data and it may not reflect all trends in the market. All customer data used, or represented, in this report is anonymised
and aggregated before analysis and is used, and disclosed, in accordance with the Group’s Privacy Policy Statement. The CBA Spotlight Series does not contain any recommendations but provides commentary on Australian macroeconomic themes. As the CBA Spotlight reports are based on CBA Data, the
IB&M Portfolio & Client Analytics (PCA) team provide raw data that may directly or indirectly relate to the themes that have been selected for coverage by the Chief Economist. The PCA team are subject to the same personal conflict requirements and trading restrictions as research, and individuals are wall-
crossed per report. CBA Spotlight reports may be viewed in advance of publication by CBA Marketing and Communications in order to produce infographics. Reports are only provided to Marketing and Communications team members under strict wall-crossing and during this period their individual trading
is monitored. We are under no obligation to, and do not, update or keep current the information contained in this report. Neither the Bank nor any of its affiliates or subsidiaries accepts liability for any loss or damage arising out of the use of all or any part of this report. All material presented in this report,
unless specifically indicated otherwise, is under copyright of the Bank. None of the material, nor its content, nor any copy of it, may be altered in any way, transmitted to, copied or distributed to any other party, without the prior written permission of the Bank. In the case of certain products, the Bank or
one of its related bodies corporate is or may be the only market maker. Financial markets products have an element of risk. The level of risk varies depending on a product’s specific attributes and how it is used. The Bank will enter into transactions on the understanding that the customer has: made his/her
own independent decision to enter into the transaction; determined that the transaction is appropriate; ensured he/she has the knowledge to evaluate and capacity to accept the terms, conditions and risks; and is not relying on any communication (including this report) from the Bank as advice. This report
is not directed to, or intended for distribution to or use by, any person or entity who is a citizen or resident of or located in any locality, state, country or other jurisdiction where such distribution, publication, availability or use would be contrary to law or regulation or that would subject any entity within the
Commonwealth Bank group of companies to any registration or licensing requirement within such jurisdiction. Unless agreed separately, we do not charge any fees for any information provided in this report. You may be charged fees in relation to the financial products or other services the Bank provides,
these are set out in the relevant Financial Services Guide (“FSG”), relevant “PDS”, relevant Terms & Conditions, and/or relevant contract. If you have a complaint, the Bank’s dispute resolution process can be accessed on 13 22 21 when in Australia, and +61 2 9841 7000 from overseas. Commonwealth Bank
of Australia ABN 48 123 123 124 AFSL 234945 and its subsidiaries, including Commonwealth Securities Limited ABN 60 067 254 399 AFSL 238814 (CommSec), Commonwealth Australia Securities LLC and CBA Europe Ltd., are domestic or foreign entities. Global Markets Research is a business division of
the Commonwealth Bank group of companies.
You can also read


