Investor Presentation - Q3 & 9MFY21 - ADF Foods
←
→
Page content transcription
If your browser does not render page correctly, please read the page content below

Investor Presentation
    Q3 & 9MFY21

                        1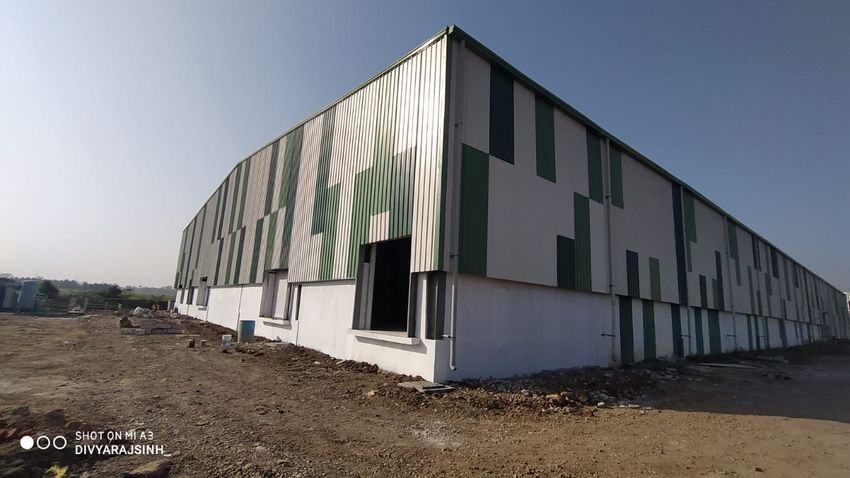
Disclaimer
This presentation and the accompanying slides (the “Presentation”), which have been prepared by ADF Foods Limited (the “Company”), have been
prepared solely for information purposes and do not constitute any offer, recommendation or invitation to purchase or subscribe for any securities, and
shall not form the basis or be relied on in connection with any contract or binding commitment whatsoever. No offering of securities of the Company will
be made except by means of a statutory offering document containing detailed information about the Company.

This Presentation has been prepared by the Company based on information and data which the Company considers reliable, but the Company makes no
representation or warranty, express or implied, whatsoever, and no reliance shall be placed on, the truth, accuracy, completeness, fairness and
reasonableness of the contents of this Presentation. This Presentation may not be all inclusive and may not contain all of the information that you may
consider material. Any liability in respect of the contents of, or any omission from, this Presentation is expressly excluded.

Certain matters discussed in this Presentation may contain statements regarding the Company’s market opportunity and business prospects that are
individually and collectively forward-looking statements. Such forward-looking statements are not guaranteeing of future performance and are subject
to known and unknown risks, uncertainties and assumptions that are difficult to predict. These risks and uncertainties include, but are not limited to,
the performance of the Indian economy and of the economies of various international markets, the performance of the industry in India and world-wide,
competition, the company’s ability to successfully implement its strategy, the Company’s future levels of growth and expansion, technological
implementation, changes and advancements, changes in revenue, income or cash flows, the Company’s market preferences and its exposure to market
risks, as well as other risks. The Company’s actual results, levels of activity, performance or achievements could differ materially and adversely from
results expressed in or implied by this Presentation. The Company assumes no obligation to update any forward-looking information contained in this
Presentation. Any forward-looking statements and projections made by third parties included in this Presentation are not adopted by the Company and
the Company is not responsible for such third-party statements and projections.

                                                                                                                                                           2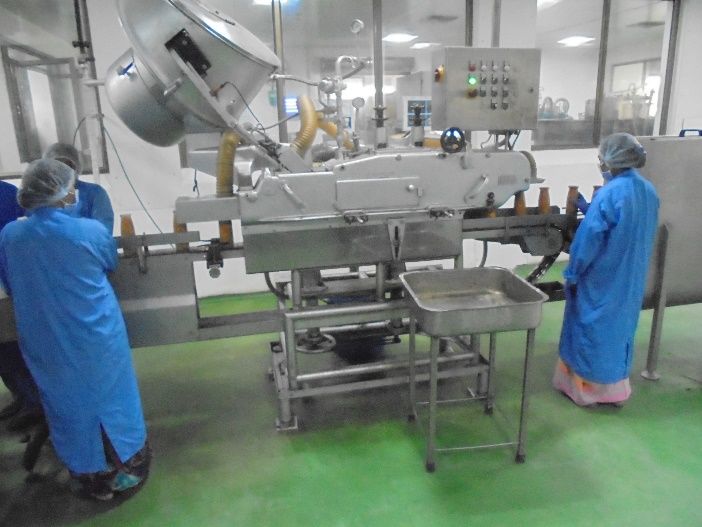
Agenda

01   Q3 & 9MFY21 Highlights

02   About the Company

03   Industry Drivers & Growth Strategy

04   Historical Financial Overview
Q3 & 9MFY21
 Highlights
Q3 & 9MFY21 consolidated result highlights
                                                                                              Financials in Rs. Cr

                               Total Income                 EBITDA                     PAT
 Quarter performance

                                    34%                      54%                       26%
                                                                                              13.9
                                           99.5                       20.0
                                                                               11.0
                            74.2
                                                    13.0

                           Q3FY20         Q3FY21   Q3FY20            Q3FY21   Q3FY20         Q3FY21

                               Total Income                 EBITDA                     PAT
 Nine-Months performance

                                    30%                      20%                       19%

                                           270.8                      51.6                    35.1
                                                    43.0                       29.5
                            208.8

                           9MFY20         9MFY21   9MFY20            9MFY21   9MFY20         9MFY21

                                                                                                                     5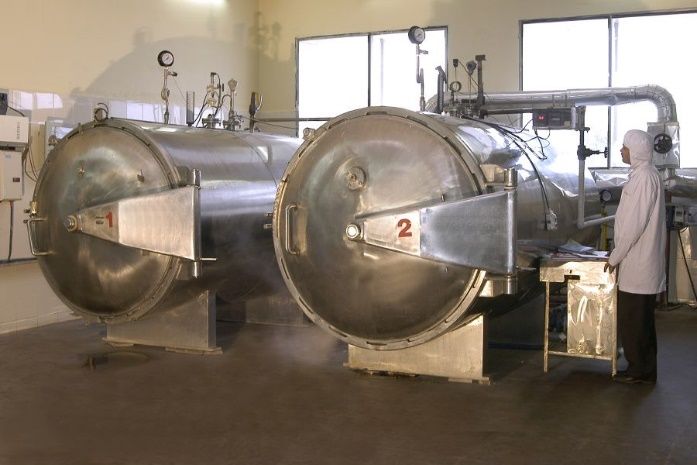
Consolidated profit & loss statement
                     (Rs Cr)     Q3FY21   Q3FY20   YoY   9MFY21   9MFY20   YoY
    Revenue from operations       98.6     73.9    33%    266.7    203.0   31%
    Other income                   0.9      0.3           4.0      5.8
    Total Income                  99.5     74.2    34%   270.8    208.8    30%
    Cost of material consumed     27.6     19.0           77.1     57.7
    Purchase of stock-in-trade    41.2     17.8           87.6     50.8
    Changes in inventories        -11.5     3.2           -6.6     -2.0
    Employee expenses             4.9      4.0            12.3     13.4
    Other expenses                17.4     17.2           48.7      45.9
    Total Operating expenses      79.5     61.2           219.2    165.8
    EBITDA                        20.0     13.0    54%    51.6     43.0    20%
    EBITDA margin                20.1%    17.5%          19.1%    20.6%
    Finance cost                  0.4      0.4             0.9      0.9
    Depreciation                   1.5      1.4            4.4      4.1
    PBT                           18.1     11.2    62%    46.3     38.0    22%
    PBT margin                   18.2%    15.1%           17.1%   18.2%
    Exceptional items             0.0       0.1            0.0     -0.3
    Tax Expenses (Credits)         4.2      0.3           11.2      8.2
    PAT                           13.9     11.0    26%    35.1     29.5    19%
    PAT margin                   14.0%    14.8%          13.0%     14.1%

                                                                                 6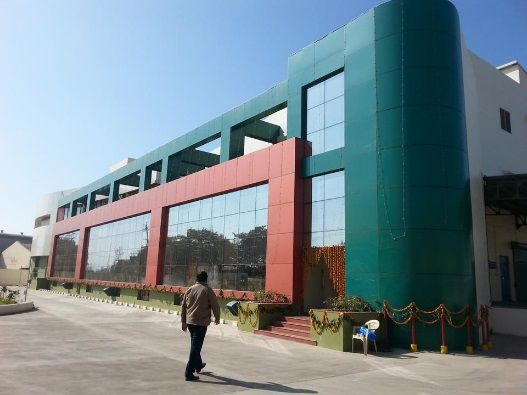
Update on new manufacturing unit

 Capacity expansion by taking new unit on lease

 •   The Company has taken a manufacturing unit in Surat (Gujarat) on lease

 •   The facility, with a production capacity of 1,950 MTPA, will enable to

     increase the capacity for frozen food products to cater to the growing

     demand in the export markets

 •   The facility is expected to be operational in Q4FY21

 •   This leasing option saves time and building construction costs, allowing

     the Company to move forward with its expansion plans more effectively

     and timely

        Capacity – 1,950 MTPA                 Total Capex – Rs 2 crores

                                                                                7
About the Company

“   At ADF we believe in maintaining high quality standards, introducing
                                                                      “
       new and innovative products while remaining customer centric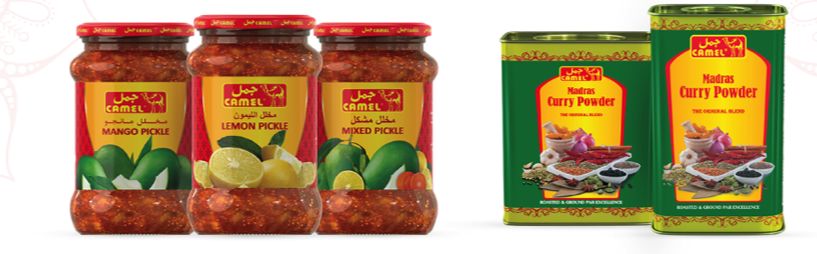
Company highlights

                                      7                                                  55+               180+
                                  Brands                                                 Countries         Distributors
  Operational
   strengths

                                     2                                             400+                 26,000
                     State-of-the-art Facilities                                           SKU           MTPA Capacity

                               Zero                                                      21%                14%
                           Long Term Debt                                        EBITDA Margin             PAT Margin
   Financial
   strengths

                                23%                                                  29%                 Rs    51 cr
                           Return on Equity                            Return on Capital Employed    Returned to shareholders
                                                                                                          in last 4 years

                Financial figures are as on FY20 ; EBITDA margin includes other income                                          9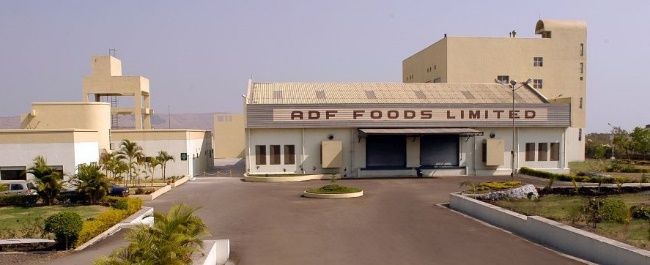
Our businesses – presence across all categories

                  Export of wide range of Indian ethnic products - ready-to-cook, ready-to-         Contribution to Revenue
                   eat, frozen, pickles, condiments, etc. - to over 55 countries with significant          9MFY21
  Core business                     presence across US, UK and GCC markets
                                                                                                                 1%

                                                                                                      22%
                    Dealing in organic & natural foods in the US in a wide range of authentic
  US subsidiary                    Mexican and Mediterranean flavors
                                                                                                                              62%

                                                                                                     16%

     Agency       Distribution of consumer products for a Fortune 500 FMCG, in the US and UK
                   markets; the products are synegistic to own products and enables to offer a
  distribution
                                           wide range to distributors
    business

                                                                                                            Core Business

                                                                                                            US Subsidiary
     India        Healthy & tasty products under the brand ‘SOUL’ for the urban India; pioneer
                            in some product categories such as olive oil based pickles                      Agency Distribution Business
    business                                                                                                Indian Business

                                                                                                                                           10
Core business
Positioning • Flagship brand primarily targeted at Indian diaspora worldwide
• Frozen snacks, frozen breads, frozen vegetables, RTE, meal
Products accompaniments, pastes, sauces, spices, milk drinks
• 300+ products across categories
Geographies • USA, Canada, UK and APAC
• 70-90% from ethnic stores* across geographies
Retail channel • Balance from mainstream/ modern trade stores
*Ethnic stores are a subcategory of general trade stores
11Core business
Positioning • Primarily targeted at Non-Indian consumers • Premium brand targeted at Arabic diaspora • Economy brand
Products • RTE, meal accompaniments, pastes, sauces • Meal accompaniments, pastes, sauces • Meal accompaniments, pastes, sauces
Geographies • Germany and USA • Middle East • Middle East
Retail • 65% from mainstream/ modern trade
• 100% from mainstream/ modern trade stores • 95% from mainstream/ modern trade stores
channel stores ; 35% general trade
12US subsidiary
Positioning • Organic, made with USDA certified organic ingredients • Non-GMO, all natural, vegan, vegetarian
Products • Hand rolled burritos • Meatless meatballs
Geographies • USA • USA
Retail channel • 100% from mainstream/ modern trade stores • 100% from mainstream/ modern trade stores
13Agency distribution business
• Distribution of some products of a global Fortune 500 FMCG in USA and UK markets
• Products are complimentary to existing range of ADF products and offers wide range of
products to the distributors
• Focusing on adding more complimentary products of similar nature in product basket
as well as adding products of few more companies in newer markets
• Enables the company access to a wider product portfolio to offer the retailers who stock
the company’s products
14India business
Positioning • Primarily targeting urban Indian customers
Products • Wide range of products - pickles, sauces, cooking paste, ready to cook instant masala mix, etc.
Geographies • Sold and marketed primarily in Mumbai, India
Retail channel • Available in Reliance Retail, Sahakari Bhandar & Haiko; Online Presence in Big Basket and Flipkart
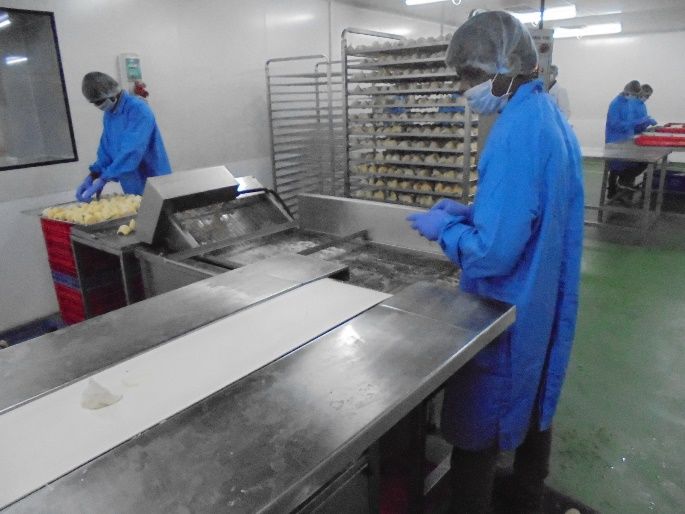
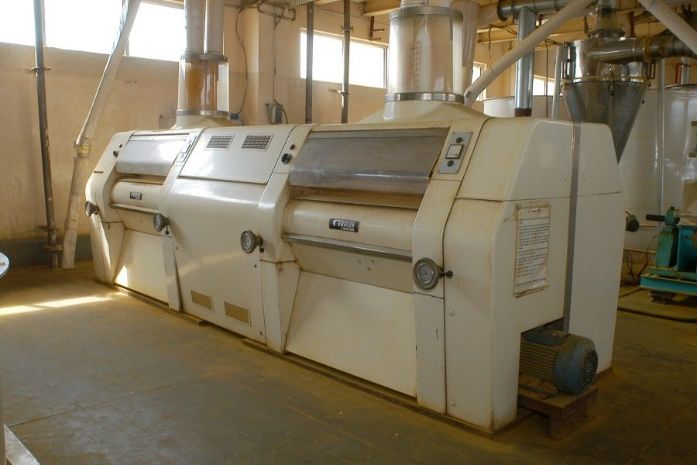
15State of the art manufacturing units
• Total Built up factory area - 15,000
Facility at Nadiad,
Sqm
The facility at Nasik is USDA Organic accredited,
ensuring stringent production norms and sound
• Frozen Foods (Samosas, Vegetables,
Gujarat
farming practises
Snacks, Parathas, etc)
• Meal Accompaniments (Pickles,
Chutneys, Pastes, Sauces)
Bureau Veritas accreditation which demonstrates
• Ready to Eat Curries & Canned that products, processes and services meet the
highest levels of safety, quality and regulatory
Accreditations
Vegetables standards
• Total Built up factory area – 10,100
Facility at Nasik,
Sqm UKAS accreditation which ensures high standards
Maharashtra
for managing occupational health and safety
• Totally automated spice processing
unit by Buhler, Germany
• Meal Accompaniments (Pickles,
Chutneys, Pastes, Sauces)
• Ready to Eat Curries & Spices
BRC accreditation ensuring both food safety &
quality standard best practices are being
maintained
16Strong distribution network
Bharat Sareen
Masud Sethi Country manager (UK)
Country manager (Canada)
Upinder Thakur
Country manager (UK)
CANADA
EUROPE
Savita Patel
Savio Almeida
Head Operations &
Country manager (GCC,
Commercial (USA)
ASIA Levant Countries, Asia Pacific
NORTH & Africa)
AMERICA MIDDLE
EAST
Apurva Patel
Country manager (USA)
HO
Mumbai
Michael Ryan
Country manager
(USA – Non Indian food)
Swathi Rai
Vice President (USA)
AUSTRALIA
SOUTH
AFRICA
55+ 180+ 6
Countries Distributors Country managers
17Branding and advertising engagements in overseas markets
Ashoka was the Associate Sponsor of IPL 2020 for the Sponsorship of Tarak Mehta Ka Ulta Chashma
US and Canada markets on Willow TV BIG BOSS Sponsorship on Colors TV
on Sony SAB
Sponsorship on Aajtak News Channel
18Experienced management
Bimal Thakkar
Chairman, Managing Director and CEO
• 30+ years of experience in domestic and export management
• Instrumental role in development of Brands and new products, tapping new markets,
international acquisitions, setting up of subsidiary companies in U.K. and U.S.A.
Devang Gandhi Shardul Doshi Shalaka Ovalekar
COO CFO CS & Legal Head
• 30+ years of experience in business management • 20+ years of experience in finance, IR and • 15+ years of experience in secretarial and legal
accounting functions
• Hold a bachelor’s degree in commerce
• Is a CA, CWA and CS and holds a bachelor’s • Is a CS, CWA, LLB and holds a bachelor’s degree
degree in commerce in commerce
Maneck Katpitia R. R. Singh Deepak Nachane
VP, International Operations VP, Manufacturing GM, Purchase
• 30+ years of experience in international • 30+ years of experience in food industry • 25+ years of experience in procurement, vendor
operations development, inventory control
• Holds a master’s degree in Chemistry and PDG in
• Holds bachelor’s degree in commerce and F&F Technology • Holds engineering degree in production
postgraduate in marketing and sales technology & diploma in business & materials
management management
19Board of Directors
Deepa Harris Viren Merchant
Independent Director Independent Director
• 30+ years of expertise in high-end luxury hospitality category • 30+ years of experience and expertise in business management and pharmaceutical
• Currently Independent Director of PVR Limited, Jubilant Foodworks Ltd., Prozone and healthcare industry
Intu Properties Ltd, Taj Safaris, Concept Hospitality Ltd. and TCPL Packaging • Currently CEO of Encore Healthcare Pvt Ltd.
Limited.
Ravinder Jain Chandir Gidwani
Independent Director Independent Director
• 45+ years of experience in business management • 45+ years of experience in financial services
• Has held various management position like MD of Shaw Wallace, MD of Millennium • Chairman Emeritus & Founder of Centrum Capital Ltd; also runs a proprietary
Alcobev and head of McDowell and Co. investing business focused on mid-sized Indian companies. Member of industry
• Has been instrumental in developing several green field businesses in alcohol and associations e.g. FICCI, CII, etc.
beverage industry as well as many well-known brands like McDowells Whisky,
Bagpiper Whisky etc.
Jay Mehta
Non-Executive Director
• 35+ years of rich industrial experience
• Executive Vice Chairman of Gujarat Sidhee Cement Ltd and Saurashtra Cement Ltd
and is on the Board of various other private and public limited companies
20Industry Drivers & Our Growth Strategy
Paradigm shift in preference over ethnic food

 Global Ethnic Food Market

                                                                                                                     11.8% CAGR
    •     The global ethnic food market was valued at $36.48 billion in 2018, and is projected
                                                                                                                                      70.10
          to grow at 11.8% (CAGR) , to reach $70.10 billion in 2024

    •     A paradigm shift in taste preference over ethnic food due to increased diaspora, the
                                                                                                                   50.57
          willingness to experiment with international cuisines and increasing migration
          among the world population for personal and professional purposes are pioneering
          the demand                                                                             36.48

    •     The consumers are looking for more innovative and experimental food choices which
          are authentic, convenient, ready to eat as well as healthy

    •     Amongst the international cuisines, Asian (Indian, Chinese), Middle Eastern and
          Mexican cuisines are the most preferred ones which are growing faster than market
          average.
                                                                                                 2018A             2021E             2024E
    •     Indian food remains the largest segment ahead of Chinese in the UK ethnic food
          market
                                                                                                  The global ethnic food market ($billion)(1)

 Source: (1) Modor Intelligence ; A: Actual ; E: Estimated                                                                                      22
Evolving consumer tastes and preferences driving demand
Evolving Industry Trends
• Evolving consumer tastes and preferences offering opportunities for innovations: - Consumers demand healthy and authentic food
alternatives with fewer artificial ingredients
• Strong preference of convenience RTE food by millennials - The largest living generation, having higher disposable income spend on
RTE food products due the ease of consumption
• Emerging importance of a balanced healthy diet - Gluten free, lactose free, veganism, vegetarianism and nutritional food are gaining
market share as consumers are becoming more health conscious
COVID Impacting Consumer Behaviour
• The COVID outbreak has affected the consumer patterns leading to unprecedented changes in the RTE & RTC foods business
• On the demand side, there has been a rise of people stocking up on food with long shelf-life and preferring to eat home cooked meals are
precautionary measures
• With most restaurants being closed and a large number of people working from home, the ready-to-eat market has been witnessing accelerated
growth amid the pandemic
• This shift in consumer behavior and preferences is expected to become the new normal
23ADF - Strongly positioned for next phase of growth
Journey So Far Journey Ahead
3
1 Established strong brands in
various segments
2 Strengthening ‘Agency
Distribution’ Business
2 Strong global distribution network 1 Broadening Distribution
Network
• Increasing product
offerings in distribution
business, thereby
Increasing Capacities • Building own depots in the enhancing product basket
3 Robust Balance sheet with zero
debt Enhancing capacities to cater to
US to increase direct reach,
thereby cutting down • Targeting more strategic
intermediary costs and tie-ups for complementary
increasing demand improving margins products across
1. Acquired a manufacturing
4 Strong margins and return ratios facility on lease to drive
near-time growth
• Continuous expansion of
network by adding more
geographies
2. Investing in greenfield distributors
5
expansion to improve
Distribution of products of a capacities
Fortune 500 company
24While generating value for shareholders
Our continued focus lies on improving cash generation and maintaining a robust balance sheet,
thereby enabling us to generate strong returns and reward shareholders
FY17 FY18 FY19 FY20 Rs 51 crores
Rs 9.6 crore Rs 5.5 crore Rs 30 crore Rs 6 crore
Returned to
Buyback Dividend Payout Buyback Dividend Payout shareholders in the
last 4 years
Return on Equity %
Return on Capital
23% 29%
Employed %
23%
15% 19%
11% 14%
9%
FY17 FY18 FY19 FY20 FY17 FY18 FY19 FY20
25Historical Financial
OverviewConsolidated financial performance
Financials in Rs. Cr
Total Income EBITDA PAT
12% 3 year CAGR 30% 3 year CAGR 43% 3 year CAGR
43
295 62
245 53
208 220
40 25
28 18
15
FY17 FY18 FY19 FY20 FY17 FY18 FY19 FY20 FY17 FY18 FY19 FY20
Cash flow from operations EBIDTA Margins % PAT Margins %
26 14%
24
21% 21%
20 18% 10%
17
8%
13% 7%
FY17 FY18 FY19 FY20 FY17 FY18 FY19 FY20 FY17 FY18 FY19 FY20
27Historical profit and loss statement
Standalone Consolidated
(Rs Cr)
FY18 FY19 FY20 FY18 FY19 FY20
Revenue from operations 163.8 187.5 182.1 201.0 231.4 272.8
Other income 18.6 14.1 21.8 18.6 14.1 21.8
Total Income 182.4 201.6 203.8 219.6 245.5 294.6
Cost of material consumed 78.2 89.33 81.81 78.2 89.3 81.8
Changes in inventories 2.8 -4.2 -0.5 1.5 -11.1 -19.2
Purchase of stock-in-trade 11.4 6.6 7.5 34.2 42.0 86.4
Employee expenses 13.9 13.4 15.1 16.4 16.1 17.6
Other expenses 39.7 47.3 52.2 49.3 56.3 65.4
Total Operating expenses 146.0 152.4 156.1 179.6 192.7 232.1
EBITDA 36.4 49.2 47.7 40.0 52.8 62.5
EBITDA margin 20.0% 24.4% 23.4% 18.2% 21.5% 21.2%
Finance cost 1.1 0.9 1.3 1.1 0.9 1.3
Depreciation and Amortization 4.4 4.3 5.5 6.8 14.2 5.9
PBT 30.9 44.0 40.9 32.1 37.7 55.3
PBT margin 17.0% 21.8% 20.0% 14.6% 15.4% 18.8%
Tax Expenses (Credits) 8.6 13.5 9.1 14.0 12.4 12.2
Exceptional Items - - -0.3 - - -0.3
PAT 22.3 30.5 31.5 18.1 25.3 42.8
PAT Margin 12.3% 15.4% 15.1% 8.2% 10.3% 14.5%
Depreciation and Amortization expense in consolidated financials for FY19 includes an amount of Rs. 9.9 cr s on account of impairment of certain brands held in US subsidiary
28Consolidated balance sheet
(Rs Cr) Sept’20 Mar’20 (Rs Cr) Sept’20 Mar’20
Share Capital 20.4 20.4 Fixed Assets incl. CWIP 57.2 58.2
Reserves 206.8 184.0 Intangible Assets 21.3 21.4
Shareholders' Funds 227.2 204.4 Income Tax Asset (Net) 4.7 4.6
Other liabilities 0.7 1.6 Other Non Current Assets 6.5 10.2
Deferred tax liability 7.6 7.1 Total Non-Current Assets 89.7 94.4
Total Non-Current Liabilities 8.3 8.7 Inventories 51.2 54.7
Trade Payables 20.5 21.2 Sundry Debtors 55.8 53.1
Other Current Liabilities 11.1 11.0 Cash and Bank 60.1 36.7
Current Tax Liabilities 0.3 0.3 Investments 13.9 18.0
Other Financial Liabilities 2.1 3.1 Other Financial Assets 5.1 7.3
Short Term Borrowings 13.0 23.2 Other Current Assets 6.7 7.7
Total Current Liabilities 47.0 58.8 Total Current Assets 192.8 177.5
Total Liabilities 282.5 271.9 Total Assets 282.5 271.9
29Thank You
Shardul Doshi (CFO)/ Shalaka Ovalekar (CS)
ADF Foods Limited
shardul@adf-foods.com
co_secretary@adf-foods.com
Marathon Innova B2 – G01, G. K. Road
Lower Parel, Mumbai 400 013
Pooja Dokania/ Rishav Das
Pareto Capital (Investor Relations)
pooja.dokania@paretocapital.in
rishav.das@paretocapital.in
210, B Wing, Kanakia Wall Street
Andheri East, Mumbai - 400069You can also read