Investor Presentation - May 2020 Tricia L. Fulton Interim President & CEO Chief Financial Officer - cloudfront.net
←
→
Page content transcription
If your browser does not render page correctly, please read the page content below
Investor Presentation
                                                                       May 2020

                                                                Tricia L. Fulton
                                                            Interim President & CEO
                                                             Chief Financial Officer

  Nasdaq: HLIO
www.heliostechnologies.com   © 2020 Helios Technologies                                1
Safe Harbor Statement
       This presentation and oral statements made by management in connection herewith that are not historical facts are “forward‐looking statements” within the meaning of Section 21E of the
       Securities Exchange Act of 1934. Forward‐looking statements involve risks and uncertainties, and actual results may differ materially from those expressed or implied by such statements. They
       include statements regarding current expectations, estimates, forecasts, projections, our beliefs, and assumptions made by Helios Technologies, Inc. (“Helios” or the “Company”), its directors
       or its officers about the Company and the industry in which it operates, and assumptions made by management, and include among other items, (i) the Company’s strategies regarding
       growth, including its intention to develop new products and make acquisitions; (ii) the Company’s financing plans; (iii) trends affecting the Company’s financial condition or results of
       operations; (iv) the Company’s ability to continue to control costs and to meet its liquidity and other financing needs; (v) the declaration and payment of dividends; and (vi) the Company’s
       ability to respond to changes in customer demand domestically and internationally, including as a result of standardization. In addition, we may make other written or oral statements, which
       constitute forward-looking statements, from time to time. Words such as “may,” “expects,” “projects,” “anticipates,” “intends,” “plans,” “believes,” “seeks,” “estimates,” variations of such
       words, and similar expressions are intended to identify such forward-looking statements. Similarly, statements that describe our future plans, objectives or goals also are forward-looking
       statements. These statements are not guaranteeing future performance and are subject to a number of risks and uncertainties. Our actual results may differ materially from what is expressed
       or forecasted in such forward-looking statements, and undue reliance should not be placed on such statements. All forward-looking statements are made as of the date hereof, and we
       undertake no obligation to update any forward-looking statements, whether as a result of new information, future events or otherwise. Factors that could cause the actual results to differ
       materially from what is expressed or forecasted in such forward-looking statements include, but are not limited to, (i) conditions in the capital markets, including the interest rate environment
       and the availability of capital; (ii) changes in the competitive marketplace that could affect the Company’s revenue and/or costs, such as increased competition, lack of qualified engineering,
       marketing, management or other personnel, and increased labor and raw materials costs; and (iii) new product introductions, product sales mix and the geographic mix of sales nationally and
       internationally. Further information relating to factors that could cause actual results to differ from those anticipated is included but not limited to information under the heading Item 1.
       “Business” and Item 1A. “Risk Factors” in the Company’s Form 10-K for the year ended December 28, 2019.

       Helios has presented forward-looking statements regarding non-GAAP cash EPS and Adjusted EBITDA margin. These non-GAAP financial measures are derived by excluding certain amounts,
       expenses or income from the corresponding financial measures determined in accordance with GAAP. The determination of the amounts that are excluded from these non-GAAP measures is a
       matter of management judgment and depends upon, among other factors, the nature of the underlying expense or income recognized in a given period. Helios is unable to present a
       quantitative reconciliation of forward-looking non-GAAP cash EPS and Adjusted EBITDA margin to their most directly comparable forward-looking GAAP financial measures because such
       information is not available, and management cannot reliably predict all the necessary components of such GAAP measures without unreasonable effort or expense. In addition, the Company
       believes that such reconciliations would imply a degree of precision that would be confusing or misleading to investors. The unavailable information could have a significant impact on Helios’s
       full year 2020 financial results. These non-GAAP financial measures are preliminary estimates and are subject to risks and uncertainties, including, among others, changes in connection with
       quarter-end and year-end adjustments. Any variation between Helios’s actual results and preliminary financial data set forth above may be material.

       This presentation includes certain historical non-GAAP financial measures, which the Company believes are useful in evaluating our performance. You should not consider the presentation of
       this additional information in isolation or as a substitute for results prepared in accordance with GAAP. The Company has provided reconciliations of comparable GAAP to non-GAAP measures
       in tables found in the Supplemental Information portion of this presentation.

www.heliostechnologies.com                                                                 © 2020 Helios Technologies                                                                                       2
Growing Global Industrial Technology Leader

                                                                    Hydraulics                                                    Electronics
                                                Leading designer and manufacturer of high-performance              Global provider of innovative electronic control,
                                                 screw-in hydraulic cartridge valves, electro-hydraulics,       display and instrumentation solutions for recreational
                                                      manifolds, integrated package solutions, and                and off-highway vehicles, industrial stationary and
                                                       quick-release hydraulic coupling solutions                              mobile power equipment

                                               Founded: 1970                               IPO: 1997                                   Nasdaq: HLIO

                                Market Capitalization                           $962 million                Common Shares Outstanding                         32.1 million

                                Recent Price                                    $30.00                      Regular Annualized Dividend / Yield $0.36 / 1.2%

                                52 Week Range                                   $29.03 - $49.49             Institutional Ownership                           88%
                                Average trading Volume
                                                                                165k                        Insider Ownership*                                4%
                                (Trailing three months)

                    *Insider Ownership includes shares directly owned by Christine Koski, HLIO director, as well as shares owned by the Koski Family Limited Partnership, for which
                    Christine Koski is a general partner. Ms. Koski disclaims beneficial ownership of the shares held by the Partnership to which she does not have a pecuniary interest.
                    Previous reporting also included shares owned by the Koski family that are no longer required to be reported under Section 16 of the Securities Exchange Act.
                    Source: Capital IQ as of May 15, 2020; Ownership as of latest filings

www.heliostechnologies.com                                                                   © 2020 Helios Technologies                                                                     3
Megatrends Impacting Our Global Markets

                                                        Sophistication of Safe
                               Globalization                                                     Computing Power
                                                        Machinery & Equipment

                                               Global Needs Will Drive These Trends

             Population           Urbanization &    Productivity &                            Electrification &
                                                                                 Automation                        Energy Saving
              Growth               Environment       Efficiencies                              Digitalization

                             COMPREHEND THE THREATS & OPPORTUNITIES: ADJUST AND ALIGN

www.heliostechnologies.com                                   © 2020 Helios Technologies                                            4
Vision 2025

                                  ACHIEVE GLOBAL technology                       leadership IN THE
                               INDUSTRIAL GOODS SECTOR by 2025 WITH CRITICAL MASS
                                              EXCEEDING $1B in sales

             WHILE MAINTAINING superior               profitability & financial strength.

                             DESIGNER AND MANUFACTURER OF INTELLIGENT SYSTEMS & CONTROLS

www.heliostechnologies.com                           © 2020 Helios Technologies                       5
Strategic Roadmap

    Business Goals:             $1B
                                 REVENUE
                                                   │                    >20%
                                                                   ADJUSTED OPERATING MARGIN
                                                                                               │
                                                                                               $70
                                                                                                        >24%
                                                                                                      ADJUSTED EBITDA MARGIN

          Strategies:                                                       Leadership
                             Differentiation                                                       Customer Centricity

                                                               Ease of Doing Business
                                                                Innovation & Product
                             Human Capital                         Differentiation                   Unique & Deeply
             Tactics:        Development                                                              Rooted Values
                                                            Simultaneous Engineering
                                                                       Global Balance
                                                          High Performing & Learning
                                                                 Organization
www.heliostechnologies.com                     © 2020 Helios Technologies                                                      6
Key Milestones

   1970                                2015                              2016                                   2018                            2019
Sun Hydraulics                        Established                       Enovation                              Changed Name                  Changed Ticker
  founded by                          Vision 2025                        Controls                                 to Helios                     to HLIO
 Robert Koski                          Strategy                         Acquisition                             Technologies

                        1997                          2016                                        2018                          2018
                                                                                                   Faster                        Custom
                     Sun Hydraulics                   Wolfgang                                                                 Fluidpower
                                                                                                 Acquisition
                       IPO (SNHY)                      Dangel                                                                  Acquisition
                                                    appointed CEO

                    Helios Technologies’ Evolution to Global Technology Leadership

 www.heliostechnologies.com                                         © 2020 Helios Technologies                                                          7
Smart Solutions For Demanding Applications

                                                                    Hydraulics (~80%)                                                                        Electronics (~20%)

           2019 Revenue                                                     $443MM                                                                                    $112MM
         2019 Adjusted
        EBITDA Margin(1)
                                                                                                                    23.6% Margin

                Brands

      Niche Technologies
                                                    Sun designs and manufactures screw-in hydraulic
                                                 cartridge valves, manifolds, and integrated fluid power                                       Designs and manufactures sophisticated digital
                                                   packages and subsystem, while Faster is focused on                                                       control solutions
                                                        quick-release hydraulic coupling solutions.
             Diversified
                                                       Mobile, Industrial & Agriculture Applications                                            Mobile, Industrial & Recreational Applications
            End Markets

   (1) See Supplemental Information for definition of Adjusted EBITDA and Margin, reconciliation from GAAP and disclaimers regarding the use of non-GAAP financial measures

www.heliostechnologies.com                                                                        © 2020 Helios Technologies                                                                     8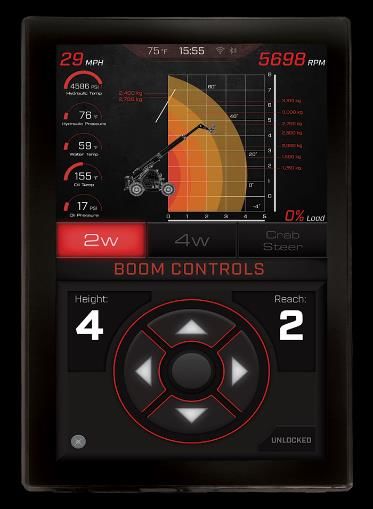
Strategic Execution
     Maintaining a best-in-class component position as well as evolving into a recognized intelligent control systems provider

                                  TRADITIONAL COMPONENTS   SMART COMPONENTS                        INTELLIGENT CONTROL SYSTEMS
       Degree of Sophistication

                                                           Path of Migration
www.heliostechnologies.com                                  © 2020 Helios Technologies                                           9
INDUSTRIAL                                                                  AGRICULTURE

      Renewable Energy           Factory Automation                                 Combines            Tractors
                                                             $555M
                                                              2019
                                                            Revenue
                                Packaging &
      Power Generation                                                              Seeders              Balers
                                Processing

                             MOBILE                                                             RECREATIONAL

                                                                                    Recreational
    Material Handling           Construction                Sun Hydraulics          Marine               Motorcycles
                                                            Faster
                                                            Enovation Controls

     Forestry Equipment         Specialized Vehicles                                Off-Road Vehicles    Snowmobiles

www.heliostechnologies.com                             © 2020 Helios Technologies                                      10
A Larger & More Diversified Technology Platform
2019 Revenue
$555 MM
2016 Revenue
$197 MM(1)
Enhanced Product Offering Broader Geographic Reach Greater Access to OEMs
Electronics
APAC
20% Americas Distributors
26%
2019 47% OEMs 55%
Hydraulics 45%
80%
EMEA
27%
Electronics 4% OEMs
APAC 20%
Americas
22% Distributors
48%
Hydraulics 80%
2016(1) 96%
EMEA
30%
(1) Enovation Controls was acquired in December 2016 and therefore had a minimal impact on actual HLIO 2016 revenue
www.heliostechnologies.com © 2020 Helios Technologies 11Hydraulics
Hydraulics Industry
$25 B
Total Hydraulics Market
$8 B
Total Hydraulic Valves Market $4 B
Total Couplings Market
$2 B $2 B
Total Compact
Total Quick Release
Hydraulics
Couplings
Addressable Market
Addressable Market
Addressable Markets – Hydraulics
Material Handling Specialized Vehicles Forestry Equipment Agriculture Renewable Energy Mining
Packaging & Machine Tools &
Marine / Offshore Construction Factory Automation Processing Presses Exploration
Source: Schmitt Consulting Engineers
www.heliostechnologies.com © 2020 Helios Technologies 12Hydraulics
Evolving Hydraulics Product Offering to
Address Hydraulics Market Demands
Broad Hydraulics Product Offering Hydraulics Market Drivers
Increased productivity and performance
Improved safety and reliability
Shift to electrohydraulic actuation & tuning
Cartridges Electro-Hydraulics Couplings Reduced noise, vibration and harshness
Environmental regulation
Zero leaks
Integrated MultiFaster
Fast and convenient ways to repeatedly
Manifolds Packages connect/disconnect fluid lines
www.heliostechnologies.com © 2020 Helios Technologies 13Hydraulics
Most Complete Product Range in Agriculture and Construction
Gross sales
Agriculture Construction Industrial
(2019)
Casting
Casting
solutions Solutions
23%
Increasing Level of Sophistication
MultiFaster
22%
MultiFaster
Couplings
Couplings 51%
Ancillary
Accessories & Products
4%
ancillary
products
Full product range, leading player High end products, leading player Many niche applications, limited product offering Not present in market segment
www.heliostechnologies.com © 2020 Helios Technologies 14Electronics
Electronic Controls Industry
Addressable Markets – Electronics
$3.5 B
Total Power Controls and
Vehicle Technologies
Market
Agriculture Construction Specialized Vehicles
$1.6 B
Relevant Power Controls and
Vehicle Technologies Market
Forestry Material Handling Off-Road Vehicles
$900 M
Power Controls and
Vehicle Technologies
Addressable Market
Military Motorcycles Recreational Marine
Source: Management Estimates
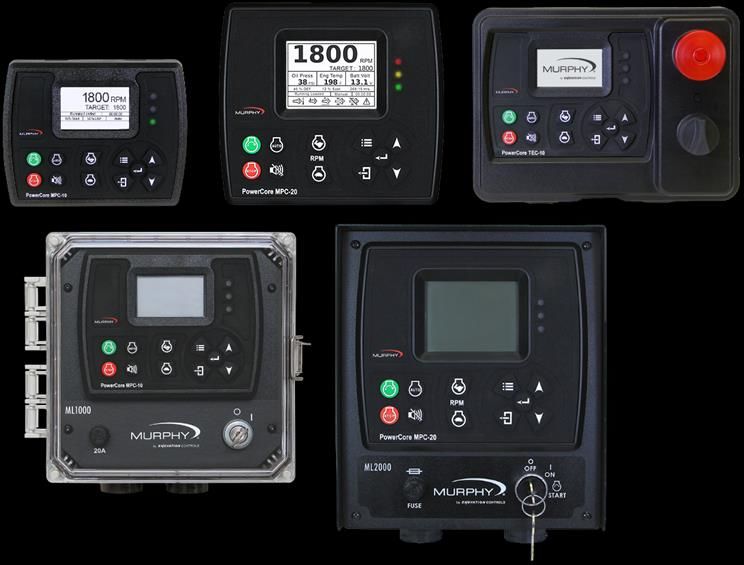
www.heliostechnologies.com © 2020 Helios Technologies 15Electronics
Dynamic & Diverse Product Portfolio
Leverage platform product development,
shortening time to market
DISPLAYS AND ACCESSORIES CONTROLLERS AND PANELS
www.heliostechnologies.com © 2020 Helios Technologies 16formerly known as Sun Hydraulics
Achieving Our Vision 2025
www.heliostechnologies.com © 2020 Helios Technologies 17Current Vision 2025: Pathway to Superior Growth
REVENUE AND ADJUSTED OPERATING MARGIN
(IN MILLIONS) Assumption: Includes COVID -19 pandemic impact in 2020
Hydraulics Electronics Future Acquisitions
Vision 2025 Metric Floors: $1B REVENUE
/ >20%
ADJUSTED OPERATING MARGIN
/ >24%
ADJUSTED EBITDA MARGIN
(1) See Supplemental Information for definition of Adjusted Operating Margin and reconciliation from GAAP and other disclaimers regarding non-GAAP information
www.heliostechnologies.com © 2020 Helios Technologies 18Reaching Vision 2025 Revenue Goals
Hydraulics Segment Electronics Segment
1 2 3 1 2 3
4% 12%
3% 8%
4%
2%
4%
3%
Existing Market New Products Increased 2019 – 2025 Existing Market New Products Increased 2019 – 2025
Growth Market Share Target CAGR Growth Market Share Target CAGR
1) Existing Market Growth 1) Existing Market Growth
Industrial Production is a key driver of market growth Industrial Production + higher degree of electrification for industrial goods
2) New Products 2) New Products
Launch new product programs Proactive and consistent outreach to the middle market with
Expand core products expanded content
3) Increased Market Share • Reduce complexity with new product designs/content
• Existing and new markets with similar applications
Add new channel partners
Deepen wallet share with existing customers: 3) Increased Market Share
• More applications Penetrate new OEMs globally
• More platforms • Expand international reach
Gain new customers Grow systems sales to existing OEMs customers
www.heliostechnologies.com © 2020 Helios Technologies 19Differentiated & Disciplined Acquisition Strategy
Goals Targets Integration Model
• Niche Technology leader (top 3) • Strong management • Successful on standalone basis
• Broaden technology offerings and capabilities • Culture supporting innovation • Retain employees
• Increase solutions-based offerings • Superior profitability • Keep customer relationships
• Diversify end markets • Target revenue $50-$150 million • Retain brands
per acquisition
• Expand aftermarket / MRO • Leverage engineering expertise
• Simultaneous engineering • High emphasis on sales synergies
Business Segment Hydraulics (existing) Linked Technologies (future) Electronics (existing)
Horizon NEAR-TERM FOCUS MID-TERM FOCUS NEAR-TERM FOCUS
Cartridge Valve Quick Release Electromechanical Actuation, Software,
Portfolio/Technology Technology (CVT) Couplings (QRC) IoT-Relevant, High Precision Manufacturing
Electronic Controls & Instrumentation
Brands
www.heliostechnologies.com © 2020 Helios Technologies 20Driving Sustained Value Thru Profitable Growth
Revenue by Segment
$555
$508
$112
$126
$343
$227 $112
$204 $205 $205 $200 $197
$178 $151 $3
$97 $4 $3 $3 $7
$201 $202 $224 $197 $190 $231 $382 $443
2008 2009 2010 2011 2012 2013 2014 2015 2016 2017 2018 2019
Hydraulics Electronics
Adjusted Operating Income and Margin(1)
$109 $113
$77
$64
$55 $54 $56 $47 $39
$36 $31
20% $2 21% 27% 27% 27% 28% 23% 20% 23% 21% 20%
ADJUSTED OPERATING MARGIN(1)
2008 2009 2010 2011 2012 2013 2014 2015 2016 2017 2018 2019
(1) See Supplemental Information for definition of Adjusted Operating Income and Margin, and reconciliation from GAAP and other disclaimers regarding non-GAAP information
www.heliostechnologies.com © 2020 Helios Technologies 21Capital Allocation Focused on Growth
Capital Structure(1) Capital Allocation Priorities
$MM 1) Organic Growth
• Organically grow at 2x market
$400 • New product development
$27 $222
Total RCF • Integrate electronics and hydraulics know-how
$195 • Support product platform
Undrawn
2) Debt Reduction
$205 • Goal of < 2x net debt / adjusted EBITDA
Drawn
$90 3) Acquisitive Growth
Balance
Term Loan Revolving Credit Cash Liquidity (2)
• Ongoing assessment of mid- and long-term
Facility opportunities
4) Support Dividend
• Net Debt / Adj. EBITDA (1): 2.1x
• Continue quarterly cash dividend
(1) Information as of March 28, 2020; see Supplemental Information for definition of Adjusted EBITDA, reconciliation from GAAP and disclaimers regarding the use of non-GAAP financial information.
(2) Liquidity is based on actual cash and borrowing capacity as of March 28, 2020; revolving credit facility also allows for a $200 million accordion, subject to certain pro forma compliance requirements, not reflected above.
www.heliostechnologies.com © 2020 Helios Technologies 222020 Helios Outlook(1)
• Withdrew 2020 guidance due to the impact of COVID-19 pandemic
• Cost containment actions already taken
Temporary 20% salary reduction for officers
Permanent layoffs and temporary salary reductions at Enovation Controls
A hiring freeze
Reduction in the use of contingent labor
Postponement of certain capital expenditures
Temporary 20% compensation reduction for Board of Directors
• Scenario analyses at varying potential levels
Postponing certain non-essential capital expenditures Reducing working hours to lower payroll expense
Reducing temporary labor force Executing furlough programs and/or additional layoffs
Reducing overtime Reducing discretionary spending, including travel
Applying additional salary reductions
• Continued confidence in successful management of current challenges
Well-respected brands
Dedicated global employees
Strong liquidity
(1) Outlook as of as May 4, 2020.
www.heliostechnologies.com © 2020 Helios Technologies 23Commitment to Shareholder Value Creation
1 NICHE TECHNOLOGY - A global niche technology leader in Hydraulics and
Electronics with highly engineered and comprehensive in-house value add
capabilities
2 SUPERIOR FINANCIAL PERFORMANCE - Proven track record of growing 2x faster
than market at superior profitability levels (>24% adjusted EBITDA margin and
>10% free cash flow)
3 BROAD DIVERSIFICATION by 1) technology, 2) end markets, and 3) geographies
2x
SALES GROWTH RATE
[ 6% & 6% ]
CAPEX ENGINEERING LABOR
>24%
ADJUSTED EBITDA MARGIN
EXCEEDING MARKET AS % OF SALES AS % OF SALES FLOOR
www.heliostechnologies.com © 2020 Helios Technologies 24Defined Vision
Designed Transformation
www.heliostechnologies.com © 2020 Helios Technologies 25formerly known as Sun Hydraulics
Supplemental Information
www.heliostechnologies.com © 2020 Helios Technologies 26Segment Data
($ in thousands) ThreeMonths
Three Months Ended
Ended F or the Y ea r Ended
Decem
Ma rchber
28, 28, Decem
Ma rchber
30,29, Decem ber 28, Decem ber 29,
2019
2020 2018
2019 2019 2018
(Unaudited) (Unaudited) (Unaudited) (Unaudited)
Sales:
Sales:
Hydraulics
Hydraulics $$ 102,550
103,818 $$ 111,548
116,463 $ 442,812 $ 381,845
Electronics
Electronics 23,377
25,665 27,175
30,388 111,853 126,200
Consolidated
Consolidated $$ 125,927
129,483 $$ 138,723
146,851 $ 554,665 $ 508,045
Gross
Gross profit
profit andand margin:
margin:
Hydraulics
Hydraulics $$ 37,248
39,674 $$ 39,738
42,634 $ 161,401 $ 141,674
36.3%
38.2% 35.6%
36.6% 36.4% 37.1%
Electronics
Electronics 10,179
12,176 12,414
13,875 50,881 55,450
43.5%
47.5% 45.7%
45.7% 45.5% 43.9%
Corporate
Corporate andand other
other -- 776
- - (4,441)
Consolidated
Consolidated $$ 47,427
51,850 $$ 52,928
56,509 $ 212,282 $ 192,683
37.7%
40.1% 38.2%
38.5% 38.3% 37.9%
Operating
Operating income
(loss) andand
income margin:
margin:
Hydraulics
Hydraulics $$ 20,275
21,482 $$ 22,291
23,762 $ 86,027 $ 83,858
19.8%
20.7% 20.0%
20.4% 19.4% 22.0%
Electronics
Electronics 3,016
4,778 5,086
6,512 21,994 25,046
12.9%
18.7% 18.7%
21.4% 19.7% 19.8%
Corporate
Corporate andand other
other (4,519)
(36,293) (5,326)
(4,442) (17,906) (33,350)
Consolidated
Consolidated $$ 18,772
(10,033) $$ 22,051
25,832 $ 90,115 $ 75,554
14.9%
-7.7% 15.9%
17.6% 16.2% 14.9%
www.heliostechnologies.com © 2020 Helios Technologies 27Sales by Geographic Region & Segment
(Unaudited)
2 0 2 0 Sales by Geographic Region and Segment 2 0 1 9 Sales by Geographic Region and Segment
($ in millions) ($ in millions)
% % % % % %
Q1 of Total Q1 of Total Q2 of Total Q3 of Total Q4 of Total 2019 of Total
Americas: Americas:
Hydraulics $ 37.3 Hydraulics $ 41.6 $ 41.2 $ 43.3 $ 36.2 $ 162.3
Electronics 21.6 Electronics 26.1 26.6 24.0 19.5 $ 96.3
Consol. Americas 58.9 45% Consol. Americas 67.7 46% 67.8 47% 67.3 49% 55.7 44% 258.6 47.0%
EMEA: EMEA:
Hydraulics 33.5 Hydraulics 41.8 36.8 31.9 31.1 141.6
Electronics 2.5 Electronics 2.5 1.8 2.1 2.0 8.4
Consol. EMEA 36.0 28% Consol. EMEA 44.3 30% 38.6 27% 34.0 25% 33.1 26% 150.0 27.0%
APAC: APAC:
Hydraulics 33.0 Hydraulics 33.1 35.7 34.9 35.2 138.9
Electronics 1.6 Electronics 1.8 1.7 1.8 1.9 7.2
Consol. APAC 34.6 27% Consol. APAC 34.9 24% 37.4 26% 36.7 26% 37.1 30% 146.1 26.0%
Total $ 129.5 Total $ 146.9 $ 143.8 $ 138.0 $ 125.9 $ 554.7
www.heliostechnologies.com © 2020 Helios Technologies 28Adjusted Operating Income Reconciliation
(Unaudited)
($ in thousands)
Year ended
Dec 27, Jan 2, Jan 1, Dec 31, Dec 29, Dec 28, Dec 27, Jan 2, Dec 31, Dec 30, Dec 29, Dec 28,
2008 2010 2011 2011 2012 2013 2014 2016 2016 2017 2018 2019
GAAP operating incom e $ 36,337 $ 2,143 $ 31,039 $ 55,269 $ 54,409 $ 56,171 $ 64,071 $ 46,891 $ 34,459 $ 61,491 $ 75,554 $ 90,115
Acquisition-related amortization of intangible assets - - - - - - - - 1,545 8,423 23,021 17,924
Acquisition-related amortization of inventory step-up - - - - - - - - 1,021 1,774 4,441 -
Acquisition and financing-related expenses (1) - - - - - - - - 1,537 1,019 5,685 11
Restructuring charges (2) - - - - - - - - - 1,462 170 1,724
One-time operational items (3) - - - - - - - - - 2,907 - -
Loss on disposal of intangible asset - - - - - - - - - - - 2,713
Other - - - - - - - - - - - 127
Non-GAAP adjusted operating incom e $ 36,337 $ 2,143 $ 31,039 $ 55,269 $ 54,409 $ 56,171 $ 64,071 $ 46,891 $ 38,562 $ 77,076 $ 108,871 $ 112,614
GAAP operating margin 20.4% 2.2% 20.6% 27.1% 26.6% 27.4% 28.1% 23.4% 17.5% 17.9% 14.9% 16.2%
Non-GAAP Adjusted operating margin 20.4% 2.2% 20.6% 27.1% 26.6% 27.4% 28.1% 23.4% 19.6% 22.5% 21.4% 20.3%
(1) Includes expenses associated with the Company's acquisition and financing activities to support its strategy
(2) Includes 2017 charges to consolidate the Company's High Country Tek b usiness into its Enovation Controls b usiness, $431 of which is included in cost of sales
(3) Includes standard costing adjustments; temporary workforce, material outsourcing, and freight charges to recover from impact of Hurricane Irma; scrap and inventory issues attrb utab le to the carve-out of Enovation Controls
from its former organization
Non-GAAP Financial Measure:
Adjusted operating margin is adjusted operating income divided by sales. Adjusted operating income and adjusted operating margin are not measures determined in accordance with generally accepted accounting
principles in the United States, commonly known as GAAP. Nevertheless, Sun believes that providing non-GAAP information such as adjusted operating income and adjusted operating margin are important for
investors and other readers of Helios' financial statements, as they are used as analytical indicators by Sun's management to better understand operating performance. Because adjusted operating income and
adjusted operating margin are non-GAAP measures and are thus susceptible to varying calculations, adjusted operating income and adjusted operating income margin, as presented, may not be directly comparable
to other similarly titled measures used by other companies.
www.heliostechnologies.com © 2020 Helios Technologies 29Adjusted EBITDA Reconciliation
(Unaudited) Three Months Ended F or the Y ea r Ended
($ in thousands) Ma rch 28, Ma rch 30, Decem ber 28, Decem ber 29,
2020 2019 2019 2018
N et i ncom e $ ( 17,223) $ 16,404 $ 60,268 $ 46,730
Interest expense, net 2,951 4,385 15,387 13,876
Income tax provision 4,208 4,655 15,039 9,665
Depreciation and amortization 8,376 8,571 35,215 39,714
EBITDA ( 1,688) 34,015 125,909 109,985
Acquisition-related amortization of inventory step-up - - - 4,441
Acquisition and financing-related expenses 74 11 11 5,685
Restructuring charges - - 1,724 170
Foreign currency forward contract loss - - - 2,535
Change in fair value of contingent consideration - 719 652 1,482
Loss on disposal of intangible asset - - 2,713 -
CEO transcation costs 165 - - -
Goodwill impairment 31,871 - - -
Other - - 127 -
A dj us ted EBITDA $ 30,422 $ 34,745 $ 131,136 $ 124,298
Adjusted EBITDA margin 23.5% 23.7% 23.6% 24.5%
Non-GAAP Financial Measure:
Adjusted EBITDA margin is Adjusted EBITDA divided by sales. Adjusted EBITDA and Adjusted EBITDA margin are not measures determined in accordance with generally accepted accounting principles in the United
States, commonly known as GAAP. Nevertheless, Helios believes that providing non-GAAP information such as Adjusted EBITDA and Adjusted EBITDA margin are important for investors and other readers of Helios‘s
financial statements, as they are used as analytical indicators by Helios‘s management to better understand operating performance. Because Adjusted EBITDA and Adjusted EBITDA margin are non-GAAP measures
and are thus susceptible to varying calculations, Adjusted EBITDA and Adjusted EBITDA margin, as presented, may not be directly comparable to other similarly titled measures used by other companies.
www.heliostechnologies.com © 2020 Helios Technologies 30Non-GAAP Cash Net Income Reconciliation
(Unaudited) Three Months Ended F or the Y ea r Ended
($ in thousands) Ma rch 28, Ma rch 30, Decem ber 28, Decem ber 29,
2020 2019 2019 2018
N et i ncom e $ ( 17,223) $ 16,404 $ 60,268 $ 46,730
Acquisition-related amortization of inventory step-up - - - 4,441
Acquisition and financing-related expenses 74 11 11 5,685
Restructuring charges - - 1,724 170
Loss on disposal of intangible asset - - 2,713 -
Foreign currency forward contract loss - - - 2,535
Change in fair value of contingent consideration - 719 652 1,482
Amortization of intangible assets 4,348 4,460 18,065 23,262
CEO transaction costs 165 - - -
Goodwill impairment 31,871 - - -
Impact of tax reform - - - (1,400)
Other one-time tax related items - - - (1,920)
Other - - 127 -
Tax effect of above (1,147) (1,298) (5,823) (8,850)
N on- G A A P ca s h net i ncom e $ 18,088 $ 20,296 $ 77,737 $ 72,135
N on- G A A P ca s h net i ncom e per di l uted s ha re $ 0.56 $ 0.63 $ 2.43 $ 2.30
Non-GAAP Financial Measure:
Adjusted net income per diluted share is adjusted net income divided by diluted weighted average common shares outstanding. Cash net income per share is cash net income divided by diluted weighted average
common shares outstanding. Adjusted net income, adjusted net income per diluted share, cash net income and cash net income per diluted share are not measures determined in accordance with generally accepted
accounting principles in the United States, commonly known as GAAP. Nevertheless, Helios believes that providing non-GAAP information such as adjusted net income, adjusted net income per diluted share, cash net
income and cash net income per diluted share is important for investors and other readers of Helios' s financial statements, as they are used as analytical indicators by Helios’s management to better understand
operating performance. Because adjusted net income, adjusted net income per diluted share, cash net income and cash net income per diluted share are non-GAAP measures and are thus susceptible to varying
calculations, adjusted net income, adjusted net income per diluted share, cash net income, and cash net income per diluted share, as presented, may not be directly comparable to other similarly titled measures used
by other companies.
www.heliostechnologies.com © 2020 Helios Technologies 31Investor Presentation
May 2020
Nasdaq: HLIO
www.heliostechnologies.com © 2020 Helios Technologies 32You can also read