Vista Outdoor Overview - BofAML Leveraged Finance Conference November 2017
←
→
Page content transcription
If your browser does not render page correctly, please read the page content below

Vista Outdoor Overview

BofAML Leveraged Finance Conference
November 2017
Forward-Looking Statements

   Certain statements in this presentation and other oral and written statements made by Vista Outdoor from time to time are forward-looking
   statements, including those that discuss, among other things: Vista Outdoor’s plans, objectives, expectations, intentions, strategies, goals,
   outlook or other non-historical matters; projections with respect to future revenues, income, earnings per share or other financial measures
   for Vista Outdoor; and the assumptions that underlie these matters. The words ‘believe’, ‘expect’, ‘anticipate’, ‘intend’, ‘aim’, ‘should’ and
   similar expressions are intended to identify such forward-looking statements. To the extent that any such information is forward-looking, it is
   intended to fit within the safe harbor for forward-looking information provided by the Private Securities Litigation Reform Act of 1995.

   Numerous risks, uncertainties and other factors could cause Vista Outdoor’s actual results to differ materially from expectations described in
   such forward-looking statements, including the following: general economic and business conditions in the U.S. and Vista Outdoor’s other
   markets, including conditions affecting employment levels, consumer confidence and spending, and other economic conditions affecting
   demand for our products and the financial health of our customers; Vista Outdoor’s ability to attract and retain key personnel and maintain
   and grow its relationships with customers, suppliers and other business partners, including Vista Outdoor’s ability to obtain acceptable third
   party licenses; Vista Outdoor’s ability to adapt its products to changes in technology, the marketplace and customer preferences; Vista
   Outdoor’s ability to maintain and enhance brand recognition and reputation; reductions, unexpected changes in or our inability to
   accurately forecast demand for ammunition, firearms or accessories or other outdoor sports and recreation products; risks associated with
   Vista Outdoor’s sales to significant customers, including unexpected cancellations, delays and other changes to purchase orders; supplier
   capacity constraints, production disruptions or quality or price issues affecting Vista Outdoor’s operating costs; Vista Outdoor’s competitive
   environment; risks associated with compliance and diversification into international and commercial markets; the supply, availability and
   costs of raw materials and components; increases in commodity, energy and production costs; changes in laws, rules and regulations
   relating to Vista Outdoor’s business, such as federal and state firearms and ammunition regulations; Vista Outdoor’s ability to execute its
   long-term growth strategy, including our ability to complete and realize expected benefits from acquisitions and integrate acquired
   businesses; Vista Outdoor’s ability to take advantage of growth opportunities in international and commercial markets; foreign currency
   exchange rates and fluctuations in those rates; the outcome of contingencies, including with respect to litigation and other proceedings
   relating to intellectual property, product liability, warranty liability, personal injury and environmental remediation; risks associated with
   cybersecurity and other industrial and physical security threats; capital market volatility and the availability of financing; changes to
   accounting standards or policies; and changes in tax rules or pronouncements.

   Vista Outdoor undertakes no obligation to update any forward-looking statements. For further information on factors that could impact
   Vista Outdoor, and statements contained herein, please refer to Vista Outdoor’s filings with the Securities and Exchange Commission,
   including the company’s annual report on Form 10-K and any subsequent quarterly reports on Form 10-Q and current reports on Form 8-K
   filed with the U.S. Securities and Exchange Commission.

© 2017 | Vista Outdoor Presentation                                                                                                                  2
Non-GAAP Financial Measures

   Non-GAAP financial measures such as earnings before interest, tax, depreciation and amortization (“EBITDA”), Adjusted EBITDA, EBITDA
   Margin and Free Cash Flow as included in this Presentation are supplemental measures that are not calculated in accordance with
   Generally Accepted Accounting Principles (“GAAP”). Please see the Appendix to this presentation for reconciliations of these Non-GAAP
   financial measures to their comparable GAAP financial measures.

   We define Adjusted EBITDA as EBITDA adjusted for the impact of asset impairments and for the impact of transaction costs, transition costs
   and certain other items related to our spin-off from Alliant Techsystems Inc. and acquisition transactions. We believe that the presentation of
   EBITDA and Adjusted EBITDA helps investors analyze underlying trends in our business, evaluate the performance of our business both on an
   absolute basis and relative to our peers and the broader market, provides useful information to both management and investors by
   excluding certain items that may not be indicative of the core operating results and operational strength of our business and helps investors
   evaluate our ability to service our debt.

   We define EBITDA margin as EBITDA divided by net sales. We believe EBITDA margin provides investors with an important perspective on the
   company's core profitability and helps investors analyze underlying trends in the company's business and evaluate its performance on an
   absolute basis and relative to its peers. EBITDA margin should be considered in addition to, and not as a substitute for, GAAP net profit
   margin. Our definition may differ from that used by other companies. Vista Outdoor has not reconciled EBITDA margin guidance to GAAP
   net profit margin guidance because Vista Outdoor does not provide guidance for net income, which is a reconciling item between GAAP
   net profit margin and non-GAAP EBITDA margin. Accordingly, a reconciliation to net profit margin is not available without unreasonable
   effort.

   We define Free Cash Flow as cash provided by operating activities less capital expenditures, allocated interest expense, and excluding
   transaction costs incurred to date. Vista Outdoor management uses Free Cash Flow internally to assess both business performance and
   overall liquidity and we believe that Free Cash Flow provides investors with an important perspective on the cash available for debt
   repayment, share repurchases and acquisitions after making the capital investments required to support ongoing business operations.

   These non-GAAP financial measures have limitations as analytical and comparative tools and you should consider EBITDA, Adjusted EBITDA,
   EBITDA Margin and Free Cash Flow in addition to, and not as a substitute for, operating income, cash from operating activities or any other
   measure of financial performance or liquidity reported in accordance with GAAP. Throughout the presentation, certain numbers will not sum
   to the total due to rounding.

© 2017 | Vista Outdoor Presentation                                                                                                                  3
Company Overview
Leading global designer of outdoor consumer products
Vista Outdoor Overview(1)(2) Sales by Segment
Vista Outdoor is a pure play, individual outdoor recreation
company, focused on leveraging best-of-breed brands:
FY 2017A FY 2018 Guidance Outdoor
Shooting
Products,
Sales $2,547M $2,240 – $2,260M Sports,
46%
54%
Net Income ($274M) --
Adj. EBIT % ~8% --
Adj. EBITDA $309M --
FCF $38M $155 – $175M
Diversified portfolio of over 50 brands, many of which have #1
or #2 share in their respective categories Sales by Customer
Pro forma sales split balanced between Outdoor Products and
Law Enforcement,
Shooting Sports segments
Military,
10%
Well-positioned in a large, growing and fragmented market
Committed to innovation and quality International, U.S. Consumer,
20% 70%
Experienced, best-in-class management team executing Vista
Outdoor’s strategy
Balanced capital deployment strategy of share repurchases
combined with disciplined M&A
Notes:
1. Financial results are as reported for the twelve month period ending March 31, 2017, unless otherwise noted
2. See financial details and reconciliation in the appendix
© 2017 | Vista Outdoor Presentation 4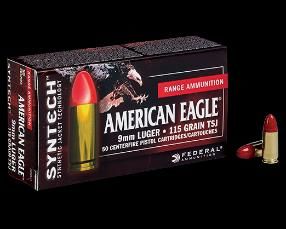
Bringing the World Outside
At Vista Outdoor, we are passionate about the outdoors

   Our Mission                                                 Our Vision

   To bring the world outside, leverage our capabilities and   Be a leading provider of quality products for the outdoor
   experience and instill passion into products that help      enthusiast, while delivering superior long-term returns to
   outdoor enthusiasts achieve independence and success        our shareholders, value for our customers, and rewarding
   in the activity of their choice                             careers for our employees

© 2017 | Vista Outdoor Presentation                                                                                         5
Key Investment Highlights
Vista Outdoor is positioned as outdoor rec’s premier investment opportunity

       1
                                       Portfolio of Authentic Brands Focused on Outdoor Sports and Recreation

       2
                                Large, Addressable and Growing Outdoor Recreation and Shooting Sports Market

       3
                                      Commitment to Leading Innovation and Product Development Capabilities

       4
                                         Established Manufacturing, Global Sourcing and Distribution Platform

       5
                                                            Strong Customer Relationships

       6
                                                              Proven M&A Capabilities

       7
                                                     Multiple Growth Avenues to Deploy Capital

© 2017 | Vista Outdoor Presentation                                                                             6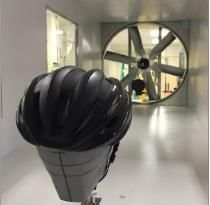
Portfolio of Authentic Brands
Vista Outdoor’s portfolio of brands covers nearly all segments in outdoor rec
Vista Outdoor
Market Size Product Diversification Expansion
Category ($B) (1) Low Medium High Opportunity Vista Outdoor Selected Brand Presence
Hunting / Shooting Sports(2) $20
Camping 15
Trail Sports(3) 14
Cycling / Wheel Sports(4) 10
Wildlife Viewing 8
Fishing 8 N/A
Snow Sports 8
Golf(5) 6
Water Sports(6) 4
= Organic business as of spin-off
Total Market Opportunity $93
= Expansion from acquisitions
Notes:
1. 2016 estimates of annual consumer spending on non-motorized outdoor recreation-related gear and accessories based on Outdoor Industry Association research (except where noted)
2. 2015 estimate of annual consumer spending on hunting and shooting sports equipment and accessories based on Southwick & Associates research
3. 2016 edition of Outdoor Industry Association research added running 3+ miles, horseback riding and mountaineering
4. 2016 edition of Outdoor Industry Association research added skateboarding
5. 2015 estimate of annual consumer spending on golf apparel, footwear and equipment based on National Sporting Goods Association research
6. 2016 edition of Outdoor Industry Association research added surfing, scuba diving and sailing
7
7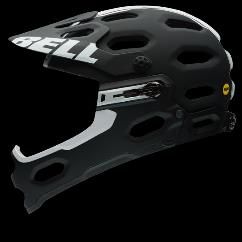
Shooting Sports Industry Trends
Strong historical growth in ammo and firearms sales
Total Domestic Commercial Ammo and Long Guns ($B)(1)(2) Shooting Sports Industry Trends(3)
$7.0
Shooting Participants,
+15M(4) 2009-2016
$6.0
$5.0
FBI Adjusted NICS Checks
7% CAGR
$4.0 Growth, 2006-2016
$3.0
$2.0 45% New Shooters are Female(5)
2017(2) decline vs. 2016:
Ammo: (24%)
$1.0
Long Guns: (14%)
$0.0 63% New Shooters Aged 18-34(5)
1998
2009
1992
1993
1994
1995
1996
1997
1999
2000
2001
2002
2003
2004
2005
2006
2007
2008
2010
2011
2012
2013
2014
2015
2016
2017
Notes:
1. Industry wholesale dollar sales ($B). Ammo and Long Guns Source: Excise Taxes per the U.S. Department of the Treasury
2. 2017 figure is projected based on the actual YoY decline observed during 1H CY2017
3. Source: NSSF and FBI Adjusted NICS data
4. Number of participants added from 2009 to 2016. Participants are defined as a person that engaged in target shooting or sport shooting within the past 12 months
5. New shooters defined as having begun shooting in the last five years
8Outdoor Recreation Industry Trends
Large, expanding installed base of participants drives stable growth
Wholesale Sports and Fitness Industry $ ($B)(1) Outdoor Recreation Industry Trends(2)
$100.0
Installed base of outdoor
$87.7 140M+
$90.0 $84.3 $86.0 activity participants
$81.4
$80.0 $77.3 $79.2
$74.2
$71.6
$70.0 $66.3
Outdoor Participants
$60.0 +10M 2006-2016
$50.0
$40.0
$30.0 U.S. Population participated in
~50% Outdoor Recreation in 2016
$20.0
$10.0
- Ages 25-44 participated in
56%
2008 2009 2010 2011 2012 2013 2014 2015 2016 Outdoor Recreation in 2016
Total Outdoor Outings in
11B
2016
Notes:
1. Source: Sports & Fitness Industry Association
2. Source: Outdoor Industry Association
© 2017 | Vista Outdoor Presentation 9Commitment to Innovation
Vista Outdoor’s culture of innovation drives organic growth
Commitment to investing in R&D capabilities…
- Best-in-class in-house R&D teams
- Rapid prototyping and 3D printing capabilities
- State-of-the-art computer-aided design
- World-class design facilities such as Action
Sports’ “The Dome”
- Acquisitions bring new expertise into the CamelBak’s hydration pack testing device Bell’s and Giro’s product innovations come
Company and provide environment for and 3D printer in Petaluma, CA to fruition at “The Dome”, Action Sports’
cross-pollination of ideas across brands state-of-the-art design and testing facility in
Scotts Valley, CA
…results in superior, innovative products…
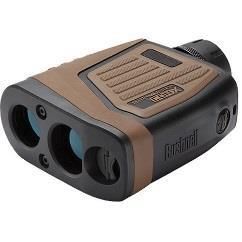
CamelBak CamelBak American Eagle Bushnell Bushnell Giro Bell
Quick Stow Skyline 10 LR Syntech Elite 1-Mile Rangefinder Trophy Cam HD Factor Techlace Super 2R
…that receive award recognition and create consumer pull Giro
Factor Techlace
Bushnell Bushnell
CamelBak Bell
American Eagle Elite 1-Mile Rangefinder Trophy Cam HD
Skyline 10 LR Super 2R
Syntech
CamelBak
Quick Stow Editor’s Choice
Best Softwear
People’s
Upgrade Choice
Best of the Test Best Enduro
Editor’s Choice #1 Open Face Helmet
Helmet to Buy
© 2017 | Vista Outdoor Presentation 10Good, Better, Best Approach
Vista Outdoor positions its brands to satisfy the demands of broad end users
Vista Outdoor implements a Optics Rifle Ammunition Protective Products
good, better, best marketing
strategy across brands in a
number of key product
categories
Offering consumers a breadth of
features and price points allows Best
the Company to serve more
consumers and capture a greater
portion of the demand curve
Priced up to $2,150 Up to $10.50/round Up to $550
Additionally, this strategy
increases Vista Outdoor’s
distribution channels by giving
the Company access to both
Mass and Specialty
Better
Up to $320 Up to $2.50/round Up to $200
(Mass)
Good
Up to $225 Up to $1.30/round Up to $100
© 2017 | Vista Outdoor Presentation 11Leading Market Share in Shooting Sports
Strong positioning in market due to investments in innovation and capacity
Innovation, Customer Loyalty and Disciplined Investments… … Drive Leading Position in the Ammunition Market(1)
Innovative Products % Share of US Ammunition Sales
45
Federal Premium® Personal Defense®
HST® provides everything needed in a 40
personal defense round: consistent
expansion, optimum penetration, and 35
superior terminal performance
30
Brands Most Frequently Purchased(2) 25
Handgun Ammunition Rifle Ammunition
29% 30% 20
11% 10% 13% 11%
7% 4% 7% 5%
15
Competitor Competitor Competitor Competitor Competitor Competitor Competitor Competitor
#1 #2 #3 #4 #3 #2 #1 #5
10
Capital Investments to Increase Output and Efficiency ($135M+ since FY14)(3) 5
$51M Vista Outdoor maintains a 0
$32M $30M
$24M
disciplined approach to
Capex, only investing in
projects that meet demand
Imports Other
FY14 FY15 FY16 FY17
and provide an attractive IRR
Notes:
1. Market share based on 2016 SEC reported sales
2. Source: Southwick Associates annual survey of brands most frequently purchased
3. Capital expenditures related to Shooting Sports. Increase in FY17 due to Factory of the Future investment to drive operational efficiency and increase capacity
© 2017 | Vista Outdoor Presentation 12Diverse Channel & Customer Mix
Broad reach of consumers across an
an array
array of
of customers
customers and
and channels
channels
Fiscal Year 2017A Sales:(1) Channel Selected Customers
Law Top 10 Customers =
Enforcement, 38%
Military, Customer 1,
10% 12% Retail
Customer 2,
4%
Customer 3, Wholesale /
4% Specialty for
International,
Hunt / Shoot
20% Customer 4, Regional and
4% Independent Shops
Customer 5,
3% Specialty for
Outdoor
Customer 6, Recreation
3% Regional and
Independent Shops
Customer 7,
3%
Customer 8,
2%
Law
Customer 9,
Enforcement /
2% Government
Customer 10,
2%
Other Commercial,
32%
International
Long-Standing Relationships with Over 20,000 Customers
Notes:
1. Numbers may not sum to 100% due to rounding
© 2017 | Vista Outdoor Presentation 13Balanced Capital Deployment Strategy
Pursuit of Strategic Acquisitions Opportunistic Share Repurchase Program
Date Purchase
Acquisition
Closed Price
Authorization
Announced:
Sep-16 $74.0M
4Q-FY2015 $200M
Apr-16 $400.0M
2Q-FY2017 $100M
Aug-15 $412.5M
Jul-15 $40.0M = Share repurchases completed through May 11,2017
Subtotal: ~$927M Subtotal: $300M
~$1.2B Invested in M&A and Share Repurchase since Spin-off;
Currently Focused on Debt Paydown
© 2017 | Vista Outdoor Presentation 14Terms of Outstanding Debt
Long-term leverage goal of 2.5x – 3.0x
Credit Agreement Senior Notes
● $592M Term Loan A; $8M quarterly payments ● $350M principal amount
● $400M Revolver commitment (LCs of ~$25M reduce ● 5.875% interest rate
availability); $115M outstanding at end of Q2
● Mature on October 1, 2023
● Matures April 1, 2021
● Callable on or after October 1, 2018
● Floating rate; adder based on company’s leverage ratio
● $200M notional amount floating-to-fixed rate swaps
($100M expires Jun 2019; $100M expires Jun 2020)
Debt Maturity Schedule – As of End of Q2 FY18
($M)
$700 Term A Loan Revolver Senior Notes
$600
$115
$500
$400 $350
$300
$488
$200
$100
$16 $32 $32 $32
$0
Remainder of FY18 FY19 FY20 FY21 FY22 FY23 FY24
© 2017 | Vista Outdoor Presentation 15FY2017 Results & FY18 Guidance
FY2017 Results & FY18 Guidance
FY2017 Results
Sales $2.547 billion
Earnings Per Share ($4.66)
Adjusted Earnings Per Share(1) $1.90
FY2018 Guidance(2)
Sales $2.24 – $2.26 billion
Interest Expense(3) ~$50 million
Tax Rate ~25%
Earnings per Share(4) $0.50 – $0.60
Capital Expenditures ~$65 million
Free Cash Flow(5) $155 - $175 million
Notes:
1. Excludes impact of revaluation and recorded portion of contingent consideration related to Jimmy Styks, Bell Powersports product line and
Camp Chef, transaction and transition costs, inventory step-up, intangible asset impairment and legal settlement claim
2. Guidance as of November 9, 2017
3. Includes amortization of financing costs
4. Excludes impact of transition/transaction expense
5. Non-GAAP financial measure. See reconciliation table for details
© 2017 | Vista Outdoor Presentation 16Historical Financial Highlights
Net Sales
$M
$3,000 $2,271 $2,547 Guidance = $2,240 – $2,260(1)
$2,083
$2,000
$1,000
$0
FY2015 FY2016 FY2017 FY2018E
Net Income
$M
$250 $80 $147
$0
($250)
($274)
($500)
FY2015 FY2016 FY2017
Net Income
Margin: 3.8% 6.5% (10.8%)
Adjusted EBITDA (Non-GAAP)(2)
$M
$450 $349
$320 $309
$300
$150
$0
FY2015 FY2016 FY2017
Adjusted
EBITDA Margin: 15.3% 15.4% 12.1%
Notes: (1) Guidance as of November 9, 2017 17
(2) See appendix for non-GAAP reconciliationHistorical Cash Flow &
Capital Spending
Free Cash Flow Generation(1) Disciplined Capital Expenditures
($M) ($M)
$200 $100
Guidance =
$155 – $175(2) $91
$175 $90
$160 $163 Increase driven by
$80 acquisitions and capacity
$150 expansion initiatives
(2)
$70 $65
$125
$60
$100 $50
$43 $42
$75
$40
$30
$50
$38 $20
$25
$10
$0 $0
FY2015 FY2016 FY2017 FY2018E FY2015 FY2016 FY2017 FY2018E
% of Sales: 8.5% 7.2% 1.5% 6.7% – 7.7% 2.1% 1.8% 3.6% 2.8% – 2.9%
Notes:
1. See appendix for non-GAAP reconciliation
2. Guidance as of November 9, 2017
18Key Investment Highlights
Vista Outdoor is positioned as outdoor rec’s premier investment opportunity
1 Portfolio of Authentic Brands Focused on Outdoor Sports and Recreation
#1 or #2 Market Share Across a Number of Outdoor Recreation Product Categories
2 Large, Addressable and Growing Outdoor Recreation and Shooting Sports Market
Diverse, Growing Presence Across Outdoor Recreation’s $93B Market
3 Commitment to Leading Innovation and Product Development Capabilities
State-of-the-Art Facilities and Cross-Pollination of Brands Drive Organic Growth
4 Established Manufacturing, Global Sourcing and Distribution Platform
Global Presence with Modernized Facilities and Efficient Operations
5 Strong Customer Relationships
Vista Outdoor is the Vendor of Choice for Customers in the Shooting Sports and Outdoor Recreation Markets
6 Proven M&A Capabilities
Track Record of Strategic Acquisitions, Including Jimmy Styks, CamelBak, Action Sports and Camp Chef
7 Multiple Growth Avenues to Deploy Capital
Balanced Growth Strategy with Opportunities in Multiple Avenues
© 2017 | Vista Outdoor Presentation 19Appendix © 2017 | Vista Outdoor Presentation 20
Historical Financial Summary

                                                                                  Select Financials(1)

                                                                                                   Years Ended March 31,
                              ($M)                                                           FY2015            FY2016      FY2017

                              Net Sales                                                       $2,083            $2,271     $2,547

                              Gross Profit                                                      529               619         669

                                 % Margin                                                     25.4%             27.3%       26.3%

                              Operating Income                                                 184(2)             263      (207)(3)

                                 % Margin                                                      8.8%             11.6%      (8.1%)

                              D&A                                                                 67               73           94

                              EBITDA (Non-GAAP)                                                 251               335        (113)

                                 % Margin                                                     12.0%             14.8%      (4.4%)

                              Adjusted EBITDA (Non-GAAP)                                        320               349         309

                                 % Margin                                                     15.3%             15.4%       12.1%

                               Notes:
                               1. Numbers may not sum due to rounding
                               2. Includes $52M goodwill/trade name impairment
                               3. Includes $449M goodwill/trade name impairment

© 2017 | Vista Outdoor Presentation                                                                                                   21
Non-GAAP Reconciliation
Non-GAAP Reconciliation
Years Ended March 31,
($000) FY2015 FY2016 FY2017
Net income $79,528 $147,037 ($274,454)
Interest expense (income), net 30,108 24,351 43,670
Income tax provision 74,518 91,370 23,760
Depreciation and amortization 66,551 72,614 93,779
EBITDA 250,705 335,372 (113,245)
Goodwill impairment(1) 52,220 - 449,199
Transaction costs(2) 19,461 9,009 4,575
Transition costs(2) 5,988 - -
Acquisition Claim Settlement(3) - - (30,027)
Contingent Consideration(4) - - (2,171)
Standalone and public company costs(5) (15,000) - -
Inventory step-up(6) - 1,043 817
Lake City Supply Agreement adjustment(7) 6,174 - -
Facility Rationalization(8) - 3,258 -
Adjusted EBITDA $319,548 $348,682 $309,148
Notes:
1. In FY17 and FY15 the Company recorded a non-cash goodwill impairment related to the Hunting and Shooting Accessories reporting unit and the Firearms reporting unit, respectively
2. Represents transaction costs, including accounting, legal and advisor fees, and transition costs, in each case incurred in connection with our spin-off transaction and the acquisitions of
Bushnell, Savage Arms, Jimmy Styks, Camelbak, Action Sports and Camp Chef
3. In FY17, the Company finalized a settlement of claims that it brought against the previous owner of Bushnell Holdings and third-party insurance providers relating to certain disputes arising
under the purchase agreement with respect to the acquisition
4. Revaluation and recorded portion of contingent consideration related to Jimmy Styks, Bell Powersports product line and Camp Chef
5. Represents the Company’s estimate of costs that it would have incurred in excess of the applicable corporate allocation had it operated as a standalone public company during the period
6. Represents inventory step-up recorded in connection with the acquisitions of Camelbak, Action Sports and Camp Chef as part of their respective purchase price allocations
7. Impact of reduced cost of sales as a result of the revised pricing under the Lake City Supply Agreement between Vista Outdoor and Orbital ATK
8. Represents costs associated with closure of the Meridian, Idaho and Norfolk, Virginia facilities
© 2017 | Vista Outdoor Presentation 22Non-GAAP Reconciliation:
Free Cash Flow
Free cash flow is defined as cash provided by operating activities less capital expenditures and excluding an acquisition
claim settlement, and transaction and transition costs net of taxes incurred to date. Vista Outdoor management believes
free cash flow provides investors with an important perspective on the cash available for debt repayment, share
repurchases and acquisitions after making the capital investments required to support ongoing business operations. Vista
Outdoor management uses free cash flow internally to assess both business performance and overall liquidity.
Non-GAAP Reconciliation: Free Cash Flow
Years Ended March 31,
($000) FY2015 FY2016 FY2017 FY2018 Guidance (1)
Cash from Operating Activities $154,338 $198,002 $154,688 $220,809-$240,809
Capital Expenditures (43,189) (41,526) (90,665) ~(65,000)
Allocated Interest expense 30,108 - - -
Acquisition Claim Settlement - - (30,027) -
Transaction costs paid to date, net of tax 18,547 6,485 3,720 -
Free Cash Flow $159,804 $162,961 $37,716 $155,000-$175,000
Notes:
1. As of May 11, 2017
© 2017 | Vista Outdoor Presentation 23You can also read