International Wind Power Developer - Company Presentation - NBT

Page created by Edith Erickson
 
CONTINUE READING
International Wind Power Developer - Company Presentation - NBT
International Wind Power Developer
Company Presentation
May 2020
International Wind Power Developer - Company Presentation - NBT
Important information

This presentation (the “Presentation”) has been prepared by NBT AS (“NBT AS” or the “Company” and together with its subsidiaries the "NBT Group“ or “NBT”). The Presentation has been
prepared and is delivered for information purposes only. It has not been reviewed or registered with, or approved by, any public authority, stock exchange or regulated market place.

The contents of the Presentation are not to be construed as financial, legal, business, investment, tax or other professional advice. Each recipient should consult with its own
professional advisors for any such matter and advice.

The Company makes no representation or warranty (whether express or implied) as to the correctness or completeness of the information contained herein, and neither the Company nor
any of its subsidiaries, directors, employees or advisors assume any liability connected to the Presentation and/or the statements set out herein. This Presentation is not and does not
purport to be complete in any way. By receiving this Presentation you acknowledge that you will be solely responsible for your own assessment of the Company, its financial position and
prospects and that you will conduct your own analysis and be solely responsible for forming your own view of any refinancing and the potential future performance of the Company’s
business.

The information included in this Presentation may contain certain forward-looking statements relating to the business, financial performance and results of the NBT Group and/or the
industry in which it operates. Forward-looking statements concern future circumstances and results and other statements that are not historical facts, sometimes identified by the words
“believes”, “expects”, “predicts”, “intends”, “projects”, “plans”, “estimates”, “aims”, “foresees”, “anticipates”, “targets”, and similar expressions. The forward-looking statements contained in
this Presentation, including assumptions, opinions and views of the Company or cited from third party sources are solely views and forecasts which are subject to risks, uncertainties and
other factors that may cause actual events to differ materially from any anticipated development. None of the Company or any other company in the NBT Group, or any of its advisors or any
of their parent or subsidiary undertakings or any such person’s affiliates, officers or employees provides any assurance that the assumptions underlying such forward-looking statements are
free from errors nor does any of them accept any responsibility for the future accuracy of the opinions expressed in this Presentation or the actual occurrence of the forecasted
developments. The Company and its advisors assume no obligation to update any forward-looking statements or to conform these forward-looking statements to the NBT Group's actual
results. Investors are advised, however, to inform themselves about any further public disclosures made by the Company.

This Presentation does not constitute any solicitation for any offer to purchase or subscribe any securities and is not an offer or invitation to sell or issue securities for sale in any jurisdiction,
including the United States. Distribution of the Presentation in or into any jurisdiction where such distribution may be unlawful, is prohibited. The Company and its advisors require persons
in possession of this Presentation to inform themselves about, and to observe, any such restrictions.

This Presentation speaks as of the date set out on the front page, and there may have been changes in matters which affect the NBT Group subsequent to the date of this Presentation.
Neither the issue nor delivery of this Presentation shall under any circumstance create any implication that the information contained herein is correct as of any time subsequent to the date
hereof or that the affairs of the NBT Group have not since changed, and the Company does not intend, and does not assume any obligation, to update or correct any information included in
this Presentation.

This Presentation is subject to Norwegian law, and any dispute arising in respect of this Presentation is subject to the exclusive jurisdiction of Norwegian courts with Oslo City Court as
exclusive venue.

By receiving this Presentation, you accept to be bound by the terms above.

                                                                                                                                                                                                       2
International Wind Power Developer - Company Presentation - NBT
Investment highlights
Number of value triggers positioning company for future monetization

   ATTRACTIVE     • 150MW producing ~357 GWh/year in China

  PORTFOLIO OF
                  • Syvash 245.7MW under construction expected on line in Q3/Q4 2020
   >1,000MW OF
   WIND FARMS     • Zophia I-III 792.5MW under development, COD expected in phases in Q1/Q3/Q4 2022

  UKRAINE IS A    • Following turmoil in 2014-2016, Ukraine has de-risked significantly, evidenced by sovereign yields approaching 5%
    BOOMING
  RENEWABLES      • An energy sector heavily dependent on nuclear and coal: strategic goal for government is to shift electricity production into
                    renewables and reduce dependence on Russian fossil fuels
    MARKET

    PROVEN        • NBT developed Syvash in less than 9 months from project acquisition to initial financial close
                        • Total Eren is 53.5% equity partner; €262m senior debt by EBRD, FMO, Proparco, IFU, Green for Growth Fund,
 DEVELOPMENT
                          Finnfund, NEFCO and Black Sea Trade and Development Bank
 CAPABILITIES &
   BLUECHIP       • 150MW developed in China, with AEI Energy and Datang Renewables as partners
   PARTNERS             • Achieved first project financing for a wind farm in China, provided by HSBC and Bank of Communications

                  • Syvash: 245.7MW, ~€80m+ EBITDA/yr, tariffs locked in at €92/€102 per MW until year-end 2029, fixed WMSA for 15+5 years

  ATTRACTIVE &
                  • Zophia I-III: ~792.5MW, tariffs expected at €84 per MW until year-end 2029
  PREDICTABLE           • Senior financing covering 50% of capex expected from ICBC, China Exim Bank, China Construction Bank
   ECONOMICS            • Currently awaiting key clarifications from regulatory authorities in Ukraine and working with financial advisors to secure
                          remaining financing. Discussions with both strategic and financial investors proceeding constructively albeit somewhat
                          delayed due to Covid-19 situation

                                                                                                                                                       3
International Wind Power Developer - Company Presentation - NBT
This is NBT

Introduction                                                                                        UKRAINE - CORE
   Independent wind power developer with attractive and advanced portfolio under
    development with strong cash flow potential

   Established in 2004, incorporated in Norway

   150MW built to date, 245.7MW under construction and 792.5MW in advanced
    development
                                                                                              246MW under construction
                                                                                              793MW under development
                                                                                              Attractive tariffs and high margins
   Bluechip partners and financing providers (Total Eren, EBRD, PowerChina & State Grid
    Corporation of China)
                                                                                                    OTHER ASSETS

   Attractive Ukrainian green tariffs of €84/€90/€102 per MW, capacity factors from 41-44%
    and long-term, fixed costs WMSAs bring EBITDA margins above 90%

                                                                                              150MW producing ~357
                                                                                              GWh/year
                                                                                              Foundation for NBT’s development
                                                                                              capabilities

                                                                                                                                4
International Wind Power Developer - Company Presentation - NBT
Well defined milestones to a future IPO

                                                                                 IPO targeted in 2021/2022 when current development pipeline is de-risked

         €m
  300                        2020e                                              2021e                                   2022e                               2023e
                                                                                                              Key events:

                                                                                                              •   Zophia I COD Q1
                                                                                                                                                                Project
  250                                                                                                                                                           EBITDA1)
                                                                                                              •   Zophia II/IIICOD Q3/Q4
                                                                   Key events:
                                                                                                              •   New development projects being
                                                                                                                  firmed up
                                                                   •   First full year of production from
  200         Key events:                                              Syvash

              •   Initial Syvash WTGs on line                      •   Good visibility on construction
              •   Closing of equity financing of                       progress from Zophia
                  Zophia projects
  150         •   Expected refinancing of secured                  •   New development projects being
                  bond                                                 firmed up
              •   Syvash COD
              •   Closing of senior financing of
                  Zophia projects
  100         •   Commencement of construction of                                                                                                               Dividend capacity
                  Zophia
              •   Expected refinancing of convertible
                  bond and Zophia development
                  bond
   50

     0
                                2020                                                2021                                   2022                              2023

Note 1) Project EBITDA contribution, 100% for Zophia and 46.5% from Syvash
                                                                                                                                                                                    5
International Wind Power Developer - Company Presentation - NBT
Strong core team

                                                                    JOAR VIKEN
                                                                           CEO

   ERLING THIIS          THORSTEIN JENSSEN            EUGENE GELLER              MARTIN ROSELL          KYRRE LUND              VLAD KAZAK
        CFO            SVP DEVELOPMENT & PROJECT     INVESTMENT DIRECTOR          GENERAL COUNSEL      SVP BUSINESS DEV          CEO Zophia
                                FINANCE

  WALTER CHANG                LARS JOHNSEN             BØRGE TVORG               EYAL BARAZANI       MAGNUS JOHANSEN              LUO BIN
 CEO ASIA OPERATIONS      PROJECT FINANCE DIRECTOR    VP PROJECT FINANCE         SENIOR BUSINESS    VP BUSINESS DEVELOPMENT    PRESIDENT CHINA
                                                                                  DEVELOPMENT                                    OPERATIONS

 KEY CAPABILITIES                                  PROJECT SOURCING                      FINANCE                              ENGINEERING

         UKRAINE                                   PROJECT
         KNOWLEDGE                                 DEVELOPMENT                            CONSTRUCTION                        OPERATIONS
                                                                                                                                                 6
International Wind Power Developer - Company Presentation - NBT
Proven development capabilities

 Due Diligence                SPA Signed                    ESIA                         Syndication        Finance Documents
 Start: May 2017              February 2018            Start: April 2018               Start: August 2018    Start: October 2018

                                                          3 Months                                          3 Months + 3 months
    4 Months

                   5 Months
                                                                                           3 Months

            SPA negotiations            SPA Closing                  EBRD on board                                  Financial Close
           Start: September 2017          April 2018                       July 2018                           January 2019 and April 2019

                                                                                                                                             7
International Wind Power Developer - Company Presentation - NBT
Overview of key assets

                              Key milestones                                                                                   Project details
                              Q4 2019 … Q2 2020           Q3 2020 … Q1 2021            Q2 2020      Q3 2020 …         2029              PARTNERS                  ECONOMIC PARAMETERS

                                                                                                                               • Co-investor:       • Tariff: €102/92/MWh
                                                             245.7 MW
                                                                                                         Feed-in tariff ends   • Lead lender:       • P50 load factor: ~41%
                                                          expected on line
 SYVASH                         Construction                                    Production of electricity                                           • Total investment: € 382m
 246MW                                                                                                                         • EPC:
 46.5% INTEREST                                  133MW                                                                                              • Annual revenues: € 83m
                                             expected on line                                                                  • Turbines:
                                                                                                                                                    • Target EBITDA%: ~90%1)

                                                                                                                               • Lead lenders:      • Tariff: 84€/MWh

                                                                                                         Feed-in tariff ends                        • P50 load factor: 40.3%

 ZOPHIA I-III                                                                                                                  • EPC:               • Total investment: ~€ 1.2bn
 792.5 MW                     Permits           Financing                       Construction                   Prod.
                                                                                                     793 MW online by                               • Annual revenues: € 231m
 100% INTEREST                Permits in place             Financial close                            Q1/Q3/Q4 2022            • Turbines:
                                                          completed for all                                                                         • Target EBITDA%: ~90%2)
                                                               phases

                                                                                                                               • Co-investors:      • Tariff: RMB 0.54-0.61/kWh

 OTHER:                                                                                                                                             • Annual prod: ~300 GWh
                                                                                                                                        Gantt LLC
 LINXI &                                                                                                                       • Lenders:
                                                           In operation since 2010                                                                  • Total investment: RMB 1.48bn
 BAICHENG
 150 MW                                                                                                                        • Turbines:          • Annual revenue: RMB 161m
 33-49% INTEREST
                                                                                                                                                    • Annual EBITDA generation: ~81%

Note: 1) Estimated EBITDA margin in P50 wind case 2) Target of similar economics as the Syvash project
                                                                                                                                                                                        8
Syvash 245.7MW expected on line Q2/Q3 2020

Key project details                                                                                Location
 CAPACITY          •   245.7MW
 LOCATION          •   Northern shore of Lake Syvash, Kherson Region
                   •   13+ months wind data from 80m tower onsite has been collected so far,
 WIND DATA             two new 120m towers and Lidar continually collecting additional wind data
                       with another 9 months so far
 WIND SPEED        •   7.9m/s at 120m (estimated)
 TARIFF            •   € 0.102 / € 0.0918/kWh for wind turbines erected in 2019 / 2020                                 Syvash
 CAPACITY FACTOR   •   Approximately 41.7%
 PERMITS           •   All secured
                   •   Secured, 35kV to 330kV substation under construction with 2 x 330kV
 GRID CONNECTION                                                                                                                                    20 km
                       transmission lines nearby

 CO2 ELIMINATION   •   635,000 tons

                   •   Flat terrain, degraded farm land
                                                                                                   Key partners
 SITE CONDITION
                   •   Spans 1,320 hectares, 49-years land lease
                                                                                                      Senior lenders               Equity partner
                   •   Turn key EPC contract of €288.3m with PowerChina
 EPC
                   •   Wind turbines (3.9MW) and 15+5 years WMSA from Nordex
                   •   15+5 year WMSA
 OPEX              •   Coverage for €200m, 3 years, non-callable war and terrorism insurance
                   •   In total around €6m per year, inflated
                   •   €262m senior debt lead by EBRD + other DFIs
                   •   €79m co-investment (preferred equity) from Total Eren convertible into         EPC contractor            Turbine manufacturer
 FINANCING
                       53.5% of equity
                   •   €34m contributed from NBT AS
 CONSTRUCTION
                   •   Under construction with first wind turbine erected in November 2019
 STATUS
 COD               •   Phased COD in Q3 / Q4 2020

                                                                                                                                                            9
Syvash project finance structure

                                                        NBT AS

                                                                                                                                                                  Ownership organized through Swedish holding
                                                                  100%                                                                                             companies
                                                                                                                                                                   –    Tax effective ownership, tax-free dividends can be
                                                                                                                                                                        brought to NBT
                                          EAST RENEWABLE AB

                                                                                                                                                                  Total Eren has co-invested EUR 79m in a
                                                                                                                                                                   Swedish holding company
                                              €35m               46.5%
                                                                                          53.5%1)
                                             EAST RENEWABLE                                                                                                       The senior lenders, led by EBRD, sit in the
                                                                                                         EUR 79m
                                               UKRAINE AB                                                                                                          Ukraine entity

                                                                  100%

                                             EAST RENEWABLE
                                                ENERGY AB

                                                                  100%

                                         SYVASHENERGOPROM                                                EUR 263m senior debt
                                                LLC                                                      EBRD & 7 other banks

Note: 1) Structured as preference share, convertible into 53.5% ordinary shares in 2022. Post second completion each ordinary and preferred share will carry one vote in the company
                                                                                                                                                                                                                             10
Zophia 792.5MW developed in multi-stage approach

Key project details                                                                                      Location
 CAPACITY          •   792.5MW (Zophia I, II & III)
 LOCATION          •   Yakymovskij District of Zaporizhia Region
                   •   25+ months of wind data from a 120m met tower onsite has been collected
 WIND DATA             so far, with additional 4 new 120m met towers collecting data since early
                       2020
                                                                                                                                                   Zophia I - III
 WIND SPEED        •   8.01m/s at 120m
 TARIFF            •   Expected to EUR 0.0836/kWh

 CAPACITY FACTOR   •   Approximately 42%

 BUILDING PERMIT   •   Secured for 792.5 MW
 GRID CONNECTION   •   Secured                                                                                                                                      20 km
 CO2 ELIMINATION   •   2,050,000 tons
                   •   Located about 15km southwest of the major city of Melitopol
 SITE CONDITION
                   •   Stretches for 42km from north to south and 23km from east to west                 Key partners
                   •   Relatively flat; the elevations of the expected wind turbine area range from
                       approximately 5m to 30m above sea level                                                             Senior lenders
                   •   EPC contracts for 750MW signed with CET, the EPC subsidiary of State
                       Grid Corporation of China
 EPC               •   Covers all turbine supply, civil works, electrical works, substations, required
                       grid connections to the interconnection points, new overhead line and grid
                       capacity upgrades
                                                                                                               EPC contractor               Turbine manufacturer
                   •   Zophia I: €40m being secured from Ukrgasbank
                   •   Zophia II-III: €500m expected from ICBC, China Exim Bank, China
 FINANCING             Construction Bank
                   •   Additional €330m to be secured through additional syndicate banks
                   •   Financial close expected Q3 2020 for Zophia II and III

                   •   Zophia I – Q1 2022 / Phased COD Zophia II – Q3/Q4 2022 / Phased COD
 COD
                       Zophia III – Q3/Q4 2022
                                                                                                                                                                        11
Zophia investment structure

                                               NBT AS

                                        100%                                                 Each Swedish holdco will be
                                                                                              owned by another layer of
                                         EAST RENEWABLE                                       Swedish companies
                                            TOPCO AB
                                                                                             This will be the joint venture
                                        100%                                                  companies where co-investors
                                                                                              enter
                                         EAST RENEWABLE
                                       ZOPHIA SUPER HOLDCO                                   This layer will be owned by a
                                                AB                                            common holding company which
           100%                         100%                     100%                         will be owned indirectly by NBT

             EAST RENEWABLE              EAST RENEWABLE            EAST RENEWABLE
           ZOPHIA INVESTMENTS I        ZOPHIA INVESTMENTS II     ZOPHIA INVESTMENTS III
                    AB                          AB                         AB
           100%                         100%                     100%

              EAST RENEWABLE             EAST RENEWABLE             EAST RENEWABLE
                ZOPHIA I AB                ZOPHIA II AB               ZOPHIA III AB

           100%                         100%                     100%

           AZOVINVESTPROM LLC          AZOVPROMENERGO LLC               ZOPHIA III LLC

                    42.5MW                     300MW                      450MW

                UKRGASBANK
  Senior
            (Project loan with share           CHINESE AND INTERNATIONAL BANKS
 funding
              security post COD)

                                                                                                                                12
Other assets

China                                                                                            Other opportunities
     Assets located in Inner Mongolia and Jilin, China
     Developed when NBT was first started
     Instrumental for the organizational development and
      becoming an experienced emerging market developer

                                                      Linxi

                                                      Size: 100 MW

                                                      Interest: 49%

                                                      Partner: Datang Renewables

                                                      Annual Revenues*: ~RMB 101m (€13m)

                                                      Annual EBITDA*: ~RMB 79m (€10m)

                                                      Baicheng
                                                                                                    Global Cooperation Agreement with CET / State Grid
                                                      Size: 50 MW                                    Corporation of China to develop new renewable projects
                                                      Interest: 33%
                                                                                                    Currently evaluating selected projects in Serbia, Greece,
                                                      Partner: initially AEI Energy, now Gantt
                                                      LLC
                                                                                                     Georgia, Uzbekistan and Montenegro
                                                      Annual Revenues*: ~RMB 51m (€7m)
                                                      Annual EBITDA*: ~RMB 20m (€3m)

* Annual Revenues and EBITDA are based on 100% ownership basis.
                                                                                                                                                                 13
A highly advanced pipeline – not including additional potential
opportunities with COD beyond 2025
Unrisked portfolio of c. 3 GW wind capacity                                                                                 Net quarterly annualized electricity generation
                                                                    Gross              Net               Risked
              Country         Project           Status1)             MW      Share     MW       Risk      MW      LF%        Unrisked
              China           Baicheng           In operation         49      33%       16      100%       16     25%              Net GWh                                                                     11 642 11 642
                              Linxi I            In operation         50      49%       25      100%       25     30%                                                                                      10 968       11 975
                                                                                                                              12 000                                                                    10 130               Country   5
                              Linxi II           In operation         50      49%       25      100%       25     30%                                                                                9 663
   Firm

                                                                                                                              10 000                                                              8 799                      Country   4
              Ukraine         Syvash             Construction        246      47%      114      100%      114     41%                                                                          7 791
                                                                                                                                                                                                                             Country   3
                              Zophia I           Fully permitted      43     100%       43      100%       43     41%                                                                       7 791
                                                                                                                                8 000
                                                                                                                                                                                                                             Country   2
                              Zophia II          Fully permitted     300     100%      300      100%      300     41%                                                                    5 943
                                                                                                                                6 000                                                 5 604
                              Zophia III         Fully permitted     450     100%      450      100%      450     41%
                                                                                                                                                                                  4 255
              Country 1       Project 1          In DD               168     100%      168      75%       126     37%                                                                                                       Country 1
                                                                                                                                4 000                                          3 421
                              Project 2          In DD                93     100%       93      75%        70     37%
                                                                                                                                                                 1 805                                                      Ukraine
                                                                                                                                2 000             575     575
                              Project 3          In DD               140     100%      140      75%       105     37%                      164
                                                                                                                                                575 575 575 575 727                                                         China
                                                                                                                                        164 164
                              Project 4          In DD               120     100%      120      75%        90     37%               0
                                                 In DD                75     100%       75      75%        56     36%                   Q1 Q2 Q3 Q4 Q1 Q2 Q3 Q4 Q1 Q2 Q3 Q4 Q1 Q2 Q3 Q4 Q1 Q2 Q3 Q4 Q1 Q2 Q3 Q4
              Country 2       Project 5
                                                                                                                                            2020        2021        2022        2023        2024       2025
                              Project 6          In DD               100     100%      100      75%        75     36%
                              Project 7          In DD                23     100%       23      75%        17     36%        Risked
                                                                                                                                   Net GWh
                              Project 8          In DD                85     100%       85      75%        64     36%
                                                                                                                                                                                                                8 045 8 233
                                                                                                                                9 000
   Pipeline

                              Project 9          In DD                18     100%       18      75%        14     36%                                                                                  7 195 8 045        Country      5
                                                                                                                                8 000                                                               6 932 7 667
                              Project 10         In DD                7      100%        7      75%         5     36%                                                                            6 446                    Country      4
                                                                                                                                7 000             Assumption that                             5 879
                              Project 11         Opportunity         591      60%      355      75%       266     36%                                                                                                     Country      3
                                                                                                                                                    75% of new                             5 879
                              Project 12         Opportunity         240      60%      144      75%       108     36%           6 000                                                   4 840
                                                                                                                                                  pipeline projects                                                       Country      2
                                                                                                                                5 000                                                4 649
                              Project 13         Opportunity         185      60%      111      75%        83     36%                              are realisable                 3 890
                              Project 14         Opportunity         267      60%      160      75%       120     36%           4 000                                          3 421                                      Country      1

                              Project 15         Opportunity         132      60%       79      75%        59     36%           3 000
                                                                                                                                                                 1 805
              Country 3       Project 16         In DD                50     100%       50      75%        38     40%           2 000                                                                                       Ukraine
                                                                                                                                                  575     575
                                                                                                                                1 000      164  575 575 575 575 727
                              Project 17         In DD                50     100%       50      75%        38     40%                   164 164                                                                             China
              Country 4                          Opportunity         200     100%      200      75%       150     37%               0
                              Project 18                                                                                                Q1 Q2 Q3 Q4 Q1 Q2 Q3 Q4 Q1 Q2 Q3 Q4 Q1 Q2 Q3 Q4 Q1 Q2 Q3 Q4 Q1 Q2 Q3 Q4
              Country 5       Project 19         Opportunity          50      50%       25      75%        19     37%                       2020        2021        2022        2023       2024        2025

              Total                                                 3,781             2,975              2,474

Source: NBT AS
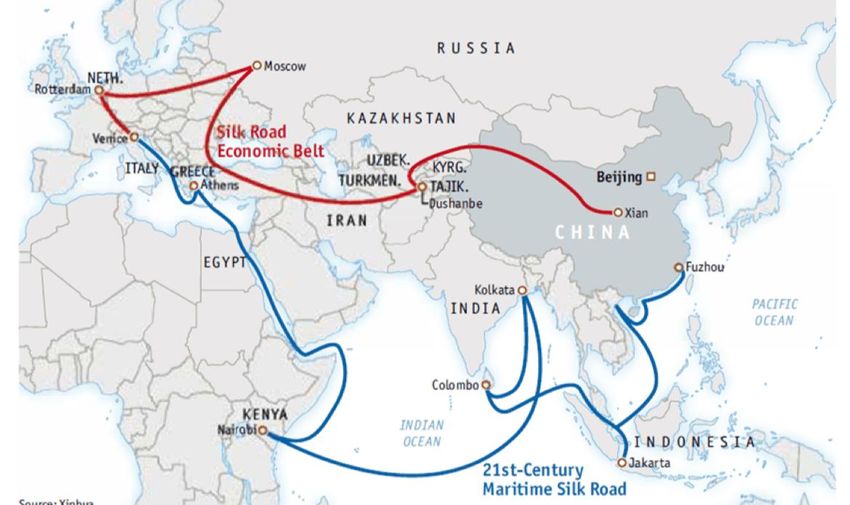
Note: 1) NBT has secured exclusivity and is performing a due diligence with a view to acquire the project. Opportunity: NBT is negotiating with owner to with a view to enter into a due diligence process                                 14
Ukraine has a pro-west government undertaking structural
reforms to facilitate future growth of its economy

Ukraine economy overview                                                                                           International reserves
       Political climate                                                                                           Months of
        – Denis Shmygal elected as the new PM in early March 2020                                                                 3.0x       3.0x       3.2x       3.3x        4.7x      4.5x    4.6x     4.0x      4.3x
                                                                                                                     imports
        – The conflict in eastern Ukraine, more strained relations with Russia and the Coronavirus
            pandemic continue to hurt the economy                                                                       USDbn
        – Reforms have been adopted to promote household consumption, the consolidation of public
            finances and prudent fiscal and monetary policies, and a flexible exchange rate regime have                 30.0                                                                     27.3               27.2
                                                                                                                                                                                25.3     24.9             24.6
            helped to reduce budget and current account deficits                                                        25.0
       Economic environment                                                                                                                                       20.8
                                                                                                                        20.0                            18.8
        – According to the IMF, GDP grew at 3.2% in 2019, slightly down from 2018 (3.3%), however
                                                                                                                                             15.5
            due to the COVID-19 outbreak, GDP growth is forecast to fall to -7.7% in 2020 and pick up to                15.0      13.3
            3.6% in 2021, subject to the post-pandemic global economic recovery
        – Interest rates on the interbank market and yields on hryvnia domestic government securities                   10.0
            have been gradually declining
                                                                                                                          5.0
        – International reserves increased to USD 27bn, and now cover four months of future imports
        – Consumer inflation down from 3.2% yoy in Jan to 2.4% in Feb, expected to decline further                        0.0
        – The NBU has moved to ease monetary policy due to inflationary pressure and has cut the key                              2015       2016       2017       2018        2019     Q1 2020 Q2 2020 Q3 2020    2020E
            policy rate by 100 bps – to 10.0% in March

CPI change and key policy rate                                                 FX dynamics                                                                     State and state-guaranteed debt
              CPI                       Key policy rate                                                                                                            79.1         80.9      71.8    60.9     50.3
                                                                                                    USD/UAH               UAH/USD as of
              Average Inflation         Target inflation                                                                 01 May’20: 26.92                           -9.8         2.4      2.5     3.3      3.2      -7.71)
    25.0                                                            1.0                                                                                    USDbn
    22.5                                                                          30                                                                       100
    20.0                          18.0%                             0.8                                                                                                                                     84        80
                                                                                  28                                                                                                       76      78
    17.5                                                                                                                                                    80                    71                        10        10
           14.0% 14.5%                                                                                                                                               66                    11      11
    15.0                                        13.5%               0.6                                                                                                           10
                                                                                  26                                                                        60       10
    12.5 13.9% 14.4%              10.9%
                                                           8.0%
    10.0                                         7.9%               0.4           24                                                                        40                                              74
                                                                                                                                                                                           65      67                 71
     7.5                          10.3%                                                                                                                              56           61
                                                            4.5%                  22                                                                        20
     5.0                                                            0.2
     2.5                                         5.0%                             20                                                                           0
     0.0                                                          0.0             1/1/2016 1/1/2017 1/1/2018 1/1/2019 1/1/2020 1/1/2021                             2015     2016     2017        2018   2019     Mar’20
        2016        2017          2018           2019         2020E                                                                                                    State-guaranteed debt        GDP growth % (real)
                                                                                       Ukrainian hryvnia was the best performing
                                                                                       foreign currency versus the US dollar in 2019                                       State debt                Total debt (% of GDP)

Source: Ukrainian Ministry of Finance – Ukraine Investor Presentation June 2019, IMG World Economic Outlook (April 2019), Bloomberg, European Bank for Reconstruction and Development (EBRD)
1) 2020E
                                                                                                                                                                                                                             15
Improving national credit profile translates to narrowing
spreads

Ukraine credit overview                                                                                Ukraine credit profile
     Commitment to further reforms, macro support programs from IMF, EU, US and IFIs                                            Long term credit ratings (April 2020)
      and sound macro performance in 2019, has boosted international investors’ interest in
      Ukrainian sovereign debt
                                                                                                                      Caa1                              B                         B
      –   In Dec 2019, signed a 3-year agreement with IMF for a new USD 5.5bn extended credit
          facility to boost the country's growth and economic reforms                                               (Positive)                       (Stable)                  (Stable)
     In January 2020, the Ukrainian Government went back on the market with a EUR
      1.25bn 10 year Eurobond which was supported by 5.6x oversubscription leading to
      reduction of factual yield at issuance of 62.5 bps from the IPT
      –   The total indications of interest peaked in excess of EUR 7bn from 350+ investors globally
                                                                                                       Ukraine Sovereign Yield Evolution                     Secondary Sovereign Curve Evolution
     The yield of the sovereign Eurobond is up by almost 350bps since issuance and is as                                                                    Yield %        1 May ’19          1 Jan ’20
                                                                                                       Yield %           UK 2024         UK 2030
      of April 30 trading at a yield of 7.85% p.a.                                                                                                                          030 Oct ’19        30 Apr ’20
                                                                                                       14.0              UK 2026                             16
     The backward-looking approach of rating agencies, which accounts for the 2014 and
                                                                                                                                                             15
      2015 crisis years, does not capture the noticeable credit profile improvements of                13.0
      Ukraine in 2019                                                                                                                                        14
                                                                                                       12.0
     Both initial demand of the Eurobond and current secondary trading yield assert our                                                                     13
      expectations on the soonest credit rating upgrade shifting Ukraine to BB universe                11.0                                                  12

                                                                                                                                                             11
                                                                                                       10.0
          The Ukraine government bond January 2020                                                                                                           10
                                                                                                        9.0
                                                                                                                                                              9
                                      Issue amount: EUR 1.25bn
                                                                                                        8.0                                                   8
                                Order book at final yield: > EUR 4.75bn
                                                                                        7.848%          7.0                                                   7

                                                                                                                                                              6
           5.000%              4.750%        4.5%(+/-0.125)         4.375%                              6.0
                                                                                                                                                              5
                                                                                                        5.0
                                                                                                                                                              4

                                                                                                        4.0                                                   3
             IPT              Guidance            FPG             Final pricing     Current trading                                                               1Y   2Y       3Y        4Y          5Y
                                                                                                         4/1/2019   7/1/2019 10/1/2019 1/1/2020   4/1/2020
                                                                                    (30 April 2020)
Source: Bloomberg as of 01 May 2020
                                                                                                                                                                                                            16
Contact Information

For more information, please contact:

Mr. Joar Viken
CEO
Mobile: +47 916 19785
Email: joar.viken@nbtas.no

                                        17
NBT AS
Company presentation
May 2020
You can also read