Investor Presentation - January 2020 Katie Brine, Director Finance, Investor Relations Phone: 905-238-7124 x2092 Email: ...
←
→
Page content transcription
If your browser does not render page correctly, please read the page content below
Investor Presentation

January 2020

Katie Brine, Director Finance, Investor Relations
Phone: 905-238-7124 x2092
Email: katie.brine@sobeys.com
Disclaimers

Forward-Looking Information

This document contains forward-looking statements which are presented for the purpose of assisting the reader to contextualize Empire Company Limited’s
(“Empire” or the “Company”) financial position and understand management’s expectations regarding the Company’s strategic priorities, objectives and plans.
These forward-looking statements may not be appropriate for other purposes. Forward-looking statements are identified by words or phrases such as “estimates”,
“plans”, “predicts”, “anticipates” and other similar expressions or the negative of these terms.

These forward-looking statements include, but are not limited to, the following items:

•     The Company’s expectations regarding the impact of Project Sunrise, including expected cost savings and efficiencies, the expected timing of the
      realization of overall and fiscal 2020 in-year incremental benefits, and the expected $50 million overachievement of the initial $500 million target which could
      be impacted by several factors, including the execution and completion of category resets, time required by the Company to complete the project as well as
      the factors identified under the heading “Risk Management” in the fiscal 2019 annual Management’s Discussion & Analysis (“MD&A”);
•     The FreshCo expansion in Western Canada and Farm Boy expansion in Ontario, including the Company’s expectations regarding future operating results
      and profitability, the amount and timing of expenses, and the number, location, feasibility and timing of construction and conversions, all of which may be
      impacted by construction schedules and permits, the economic environment and labour relations;
•     The Company’s plans to purchase for cancellation Non-Voting Class A shares under the normal course issuer bid (“NCIB”) which may be impacted by
      market and economic conditions, and the results of operations; and
•     The Company’s expectations regarding the implementation of its online grocery home delivery service which may be impacted by the timing of launching
      the business, the customer response to the service and the performance of its business partner, Ocado Group plc (“Ocado”).
By its nature, forward-looking information requires the Company to make assumptions and is subject to inherent risks, uncertainties and other factors which may
cause actual results to differ materially from forward-looking statements made. For more information on risks, uncertainties and assumptions that may impact the
Company’s forward-looking statements, please refer to the Company’s materials filed with the Canadian securities regulatory authorities, including the “Risk
Management” section of Empire’s fiscal 2019 annual MD&A.

Non-GAAP Financial Measures & Financial Metrics

There are measures and metrics included in this earnings call presentation, such as adjusted EBITDA, adjusted earnings per share, same-store sales, free cash
flow, funded debt and total capital that do not have a standardized meaning under generally accepted accounting principles (“GAAP”) and therefore may not be
comparable to similarly titled measures and metrics presented by other publicly traded companies. The Company includes these measures and metrics because
it believes certain investors use these measures and metrics as a means of assessing financial performance.
For a more complete description of Empire’s non-GAAP measures and metrics, please see Empire’s MD&A for the second quarter ended November 2, 2019.
                                                                                                                                                                     2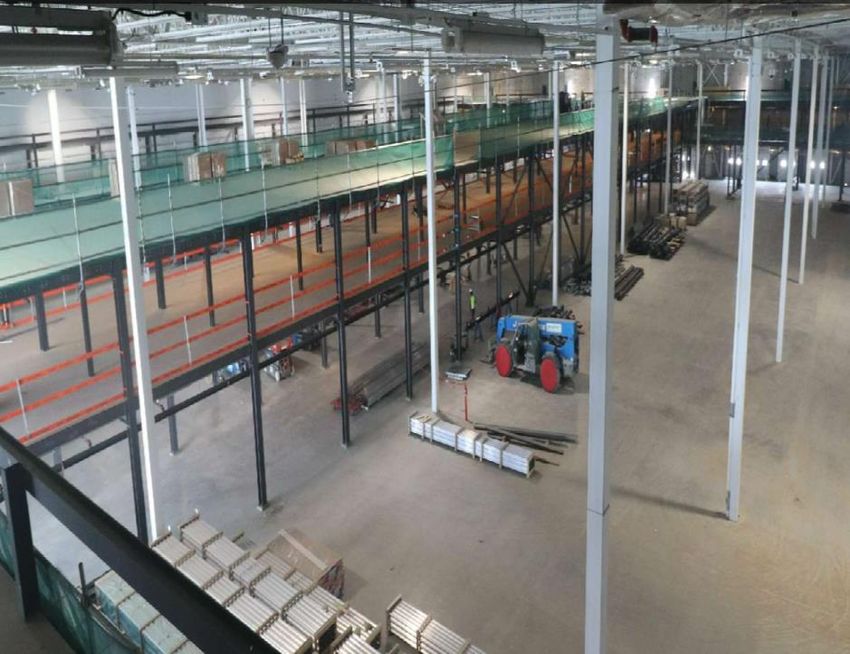
CEO’s Direct Reports

                                                      Michael Medline
                                                          President &
                                                    Chief Executive Officer

  Pierre         Vivek       Mike        Sarah      Michael      Simon       Sandra        Doug             Vittoria          Mohit
St-Laurent       Sood       Venton       Joyce       Vels        Gagné      Sanderson    Nathanson          Varalli           Grover
   Chief
 Operating      Related     Discount   E-commerce     Chief      Human      Marketing   General Counsel   Sustainability,   Innovation &
  Officer,     Businesses    Format                 Financial   Resources                & Corporate      Chief of Staff,     Strategy
Full Service                                         Officer                              Secretary        Office of the
                                                                                                               CEO

                                                                                                                                           3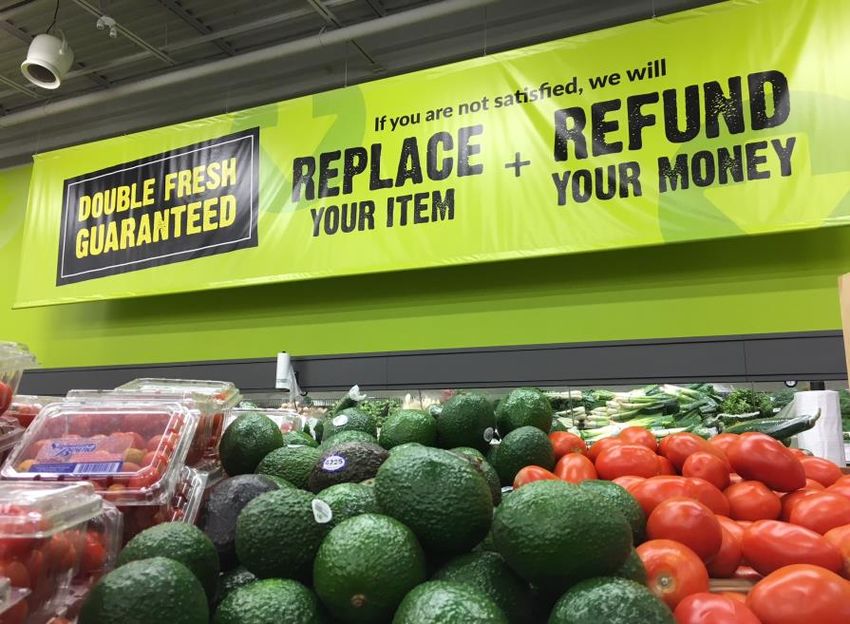
Empire Company Limited –
Who are we?

• Canadian company headquartered in Stellarton,                               Quick Facts – Empire¹
    Nova Scotia.
                                                            Share price (CAN$)²                                       $31.10
• Food retailing and related real estate through wholly
    owned subsidiary Sobeys Inc. and a 41.5% equity         52-Week High²                                             $37.43
    accounted interest in Crombie REIT.                     52-Week Low²                                              $27.61
• Empire is a national Canadian grocery retailer,           Shares outstanding (diluted)                             272.4M
    serving the food shopping needs of Canadians under
    retail banners that include Sobeys, Safeway, IGA,  Quarterly dividend                                              $0.12
    Foodland, FreshCo, Thrifty Foods, Farm Boy and     Number of Stores³                                             > 1,500
    Lawtons Drugs.
                                                            Number of Retail fuel locations                            > 350
•       In addition to food retail we are:
                                                            Employees                                              ~123,000
    •      Pharmacy retailers with in-store pharmacy
           banners and free-standing locations through      Total Square footage                                    ~40.0 M
           Lawton’s Drug Stores;
                                                            Communities served                                         > 900
    •      Wholesalers, distributing to our corporate and
                                                            ¹As at Q2, Fiscal 2020 (November 2, 2019) unless noted
           franchised stores and over 8,000 retail stores   otherwise
           and independent wholesale accounts; and          ²As of January 23, 2020
                                                            ³See http://corporate.sobeys.com/at-a-glance/ for details of
    •      Owner and operator of fuel and convenience       stores per banner and location and slide 14 for a map
           stores, and liquor operations.

                                                                                                                           4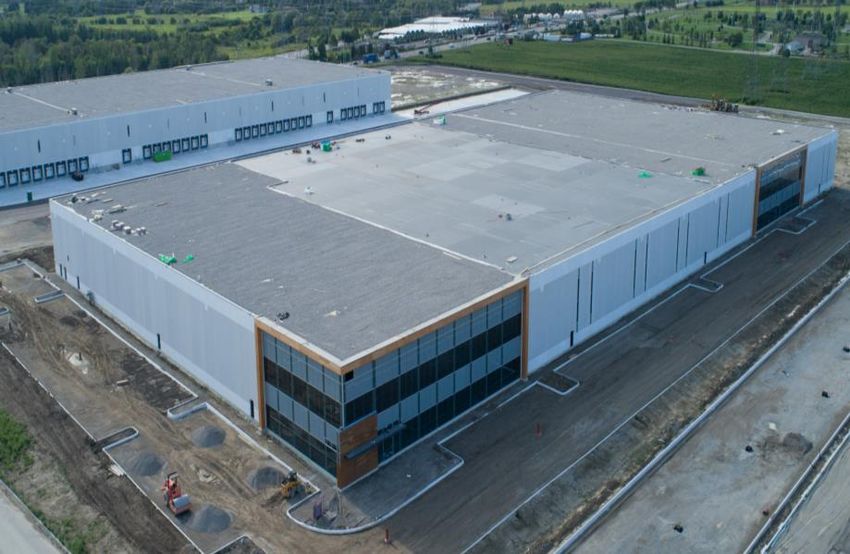
Key Achievements – Last twelve months

       January
2019
       •   Progress with B.C. labour decision enabled Empire to move forward with Discount expansion strategy in B.C.
       April
       •   Opened first Western Canada FreshCo store in in Mission B.C.
       May
       •   Unveiled Voilà by Sobeys and Voilà par IGA – the name and brand for the Company’s online grocery home delivery
           service for the Greater Toronto Area, Ottawa and major cities in the province of Quebec
       •   Announced Innovation leadership
       June
       •   Announced full year results reflecting fourth consecutive quarter of growth
           •    Project Sunrise exceeded targets for fiscal 2019 – achieved $200 million of incremental savings in fiscal 2019, and
               increased total savings target to $550 million
           •    Annual dividend per share increased 9% to $0.48
           •    Capital investment program for fiscal 2020 expected to be $600 million
           •    Announced intent to repurchase approximately $100 million of Non-Voting Class A shares (“Class A shares”)
       July
       •   With announcement of additional FreshCo store investments in Western Canada, one-third (22) of Western FreshCo locations confirmed
       •   DBRS Upgrades Ratings on Sobeys Inc. to BBB (low) and changes trend to Stable; S&P revises outlook to Positive
       October
       •   Sobeys pilots Smart Cart, the first intelligent grocery shopping cart
       •   Sobeys Inc. diverts 720,000 plastic bags from landfill to make waterfront benches and picnic tables for public spaces along Atlantic Canadian shores
       November
       •   Sobeys Inc. diverts plastic from landfills with cutting-edge parking lot at Timberlea store
       December
       •   Empire’s family of brands rolls out Sensory Friendly Shopping to more than 450 stores across the country
       •   Farm Boy market growth accelerates with 10 new Ontario locations announced
       •   Announced second quarter results
           •    Same-store sales excluding fuel increased by 2.0%
           •    Adjusted earnings per share of $0.58 compared to $0.40 last year
           •    11 FreshCo locations opened in British Columbia and Manitoba in calendar 2019
           •    At December 11, 2019, repurchased 1,769,184 Class A shares, fiscal year to date, for a total consideration of $62.0 million
2020   January
       •   NCIB reached $100 million
       •   Sobeys banner to remove all plastic grocery bags by the end of the month. This will remove 225 million plastic grocery bags from circulation at
           Sobeys’ 255 locations across Canada each year.

                                                                                                                                                                  5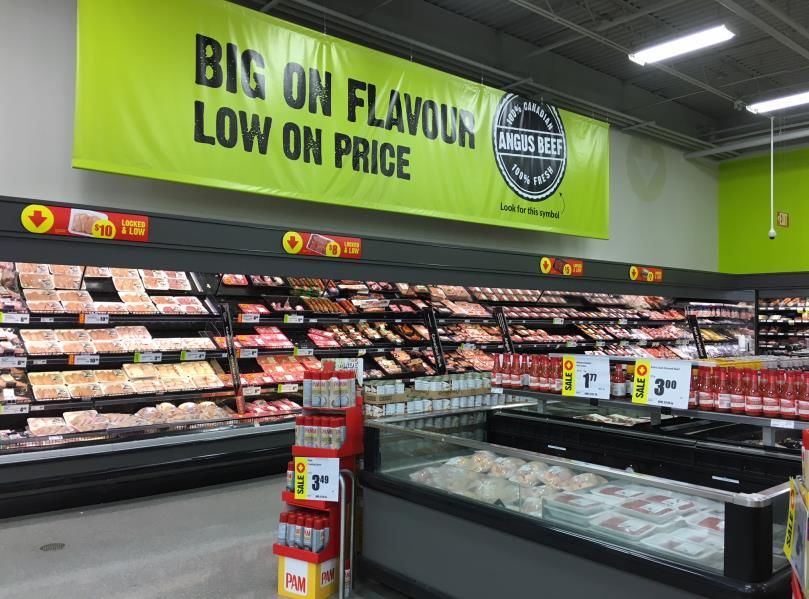
Strategic Focus

   Reset our        Bolster our       Win in our          Enhance        Fill the Urban        Invest in
  Foundation          Brand            Stores             Discount             Gap            Innovation

   Successful      Strengthen the   Improve service    Expand discount    Launch home       Leverage digital
  completion of      emotional       and offering in     to Western        delivery and       and data to
 Sunrise by end    connection to    our conventional     Canada and      rapidly grow the     accelerate
 of fiscal 2020.     our banner          stores.          refine our     number of Farm         growth.
                       brands.                         FreshCo model.      Boy stores.

                                                                                                               6
Project Sunrise Update

In the fourth quarter of fiscal 2017, the Company launched Project Sunrise, a comprehensive, three year
transformation initiative intended to simplify organizational structures and reduce costs. The initiative is now
expected to generate at least $550 million in annualized benefits by the end of fiscal 2020.

1)       Organizational realignment – from a regional to a national structure, is complete.
2)       Operational efficiencies – store operations, labour standards and other operational process initiatives
         continue to progress as planned, with increased benefits achieved in fiscal 2019 and planned for 2020.
3)       Cost of goods sold – harmonization of costs with suppliers; more competitive net acquisition costs achieved;
         category resets are providing an improved, simplified and in some cases more innovative assortment for
         customers.
Financial benefits from Phases one and two largely impacted selling and administrative expenses. Phase
three financial benefits will be reflected mostly in gross margin expansion. As at Q2 F20, Project Sunrise is
on track.

             Approximate In-Year
Year                                                                             Achieved Through
           Savings break-down ($M)
                                            Organizational design, indirect sourcing cost reductions and improvements in store
 1 F2018 (completed)                   ~100
                                            operations.
 2 F2019 (completed)                   ~200 Initial rollout of category resets, continued cost reductions and operational improvements.
                                            Completion of category resets rollout, continued cost reductions and operational
 3 F2020 (expected)                    ~250
                                            improvements.
       Total                           ~550

       Initial Target (set May 2017)   500
       Expected to exceed by           ~50
                                                                                                                                     7
Project Sunrise Update

               Significant improvement in Empire’s key metrics since the launch of Project Sunrise.
                                                                                            Fiscal
                                                                                2019                      2017                    Change
                                                                             52 weeks                  52 weeks
                                                                                                                                      +/-
                                                                             4-May-19¹                 6-May-17
        Sales                                                                 $25,142.0                 $23,806.2                   + 5.6%
        Same-store sales, excluding fuel                                         4.3%                     3.3%                    + 100 bps
        Gross margin                                                            24.2%                    24.0%                    + 20 bps
        Adjusted EBITDA                                                        $1,076.2                  $769.9                    + 39.8%
        Adjusted EBITDA margin                                                   4.3%                     3.3%                    + 100 bps
        Selling and Administrative margin (adjusted)²                           22.1%                    22.9%                     - 80 bps
        Adjusted EPS                                                             $1.50                     $0.70                   + 114.3%

 $26     Sales ($B)                                     $1,400    Adjusted EBITDA ($M)                        $2.00    Adjusted EPS ($/share)
 $25                                                    $1,200      +11.8% CAGR
            +1.8% CAGR³                                 $1,000                                                $1.50       +28.9% CAGR
 $25                                                      $800
                                                                                                              $1.00
 $24                                                      $600
                                                          $400                                                $0.50
 $24
                                                          $200
 $23                                                         $0                                               $0.00
           2017          2018         2019                           2017        2018         2019                       2017        2018        2019

¹ Empire’s results for the fiscal year ended May 4, 2019 include Farm Boy operations as of December 10, 2018.
² Selling and Administrative costs, excluding the impact from adjustments made to operating income during the fiscal year. See Empire’s fiscal 2019 MD&A.
³ Compound annual growth rate.                                                                                                                            8
Farm Boy Acquisition
Advances Ontario Strategy, Accelerating Ontario Presence and GTA Growth

•   Farm Boy acquired on December
    10th, 2018.

•   Farm Boy contributed to Company
    results for 21 weeks of fiscal 2019;
    sales of $212.7 million and net
    earnings of $7.9 million.

•   For fiscal 2020, the Company
    expects to spend approximately $70
    million in capital for the expansion of
    the Farm Boy store network in
    Ontario.

•   Since the acquisition, the Company
    has opened three new Farm Boy
    stores in Ontario. Seven further
    stores will open in calendar 2020 and
    two more in 2021.

•   Farm Boy Private Label will be part of
    the Voilà e-commerce offering when               Farm Boy Stores acquired
                                                     Farm Boy Stores opened
    it launches in Spring 2020.
                                                     Farm Boy Stores announced to open
                                                     Existing Farm Boy Distribution Centre
                                                     Announced Farm Boy Distribution Centre Opening
Note – For further company and transaction information, please see Appendix A                         9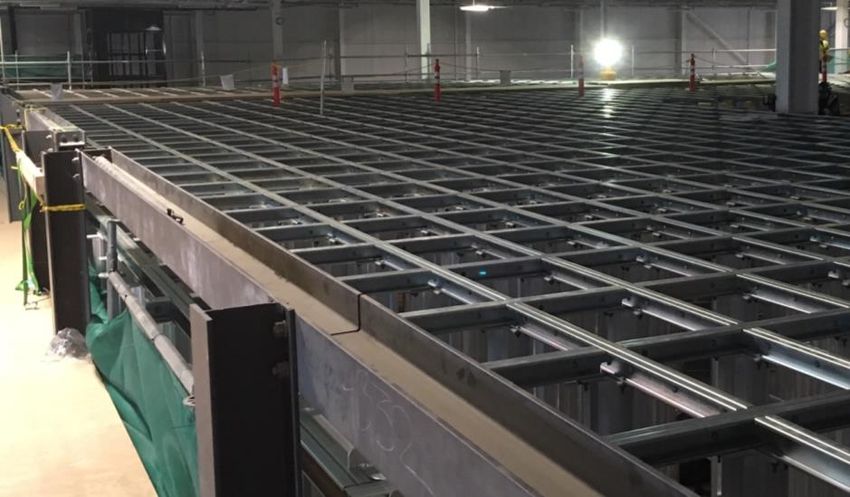
Ocado Solutions

With more than 15 years at the forefront of innovation and success in grocery ecommerce,
Ocado will partner exclusively in Canada with Sobeys on our end-to-end e-commerce solution.
Key facts:
• Canadian online grocery market is
  growing 30%+ per year
• Greater Toronto Area Customer
  Fulfilment Centre (“CFC”) complete
  in 2 years
• Soft launch in Spring 2020
Ocado by the numbers*:
• 99% order accuracy
• 95% delivery punctuality
• 0.7% product waste
• 318,000 orders a week (average)
• 741,000 active customers
*Per Ocado Group’s 2019 Half Year Report
                                           This is a link to a video showing the Ocado’s Andover facility.
                                           https://youtu.be/EeMTZd68fOU

                                                                                                             10
Financial Results – Annual
Fiscal
F2019 F2018 F2017 F2016
52 weeks 52 weeks 52 weeks 53 weeks
4-May-19¹ 5-May-18 6-May-17 7-May-16
Sales $25,142.0 $24,214.6 $23,806.2 $24,618.8
Same store sales growth (decline), excluding fuel 2.7% 0.5% (2.2)% 0.3%
Inflation (deflation) at quarter end – internal 2.2% 0.8% (1.9)% 2.2%
Gross profit $6,083.6 $5,900.5 $5,707.2 $5,957.6
Gross margin 24.2% 24.4% 24.0% 24.2%
Adjusted EBITDA $1,076.2 $1,014.7 $796.9 $1,161.4
Adjusted EBITDA margin 4.3% 4.2% 3.3% 4.7%
Adjusted earnings per share $1.50 $1.27 $0.70 $1.50
Free cash flow ² $540.7 $808.9 $619.7 $367.3
Capital expenditures $434.6 $288.0 $514.5 $672.0
Dividends per share $0.44 $0.42 $0.41 $0.40
Share price $29.94 $25.01 $21.50 $21.09
¹ Empire’s results for the fiscal year ended May 4, 2019 include Farm Boy operations as of December 10, 2018. All metrics, including same-store sales, include the
consolidation of Farm Boy operations
² The Company revised the definition of free cash flow in Q4 F19 as cash flows from operating activities, plus proceeds on disposal of property, equipment and
investment property, less acquisitions of property, equipment, investment property and intangibles. All amounts in the chart have been restated to reflect the new
definition. 11Financial Results – 12 Quarter Review
Fiscal Fiscal Fiscal Fiscal
2020(2)(3) 2019 2018 2017
(4)
Q2 F20 Q1 F20 Q4 F19 Q3 F19 Q2 F19 Q1 F19 Q4 F18 Q3 F18 Q2 F18 Q1 F18 Q4 F17 Q3 F17
Nov. 2 Aug. 3 May 4 Feb. 2 Nov. 3 Aug. 4 May 5, Feb. 3, Nov. 4, Aug. 5, May 6, Feb. 4,
2019 2019 2019 2019 2018 2018 2018 2018 2017 2017 2017 2017
Sales $6,436.5 $6,744.1 $6,220.4 $6,247.3 $6,214.0 $6,460.3 $5,886.1 $6,029.2 $6,026.1 $6,273.2 $5,798.9 $5,889.8
Same store sales, excluding fuel 2.0% 2.4% 3.8% 3.3% 2.5% 1.3% 0.0% 1.1% 0.4% 0.5% (1.6)% (3.7)%
Inflation (deflation) – internal 2.4% 3.0% 2.2% 1.8% 1.3% 0.0% 0.8% 1.6% 0.7% 0.5% (1.9)% (2.2)%
Gross profit $1,595.7 $1,660.4 $1,577.5 $1,511.7 $1,482.1 $1,512.3 $1,451.3 $1,444.7 $1,473.5 $1,531.0 $1,420.9 $1,394.8
Gross margin 24.8% 24.6% 25.4% 24.2% 23.9% 23.4% 24.7% 24.0% 24.5% 24.4% 24.5% 23.7%
Adjusted EBITDA $477.7 $460.0 $300.1 $218.3 $279.1 $278.7 $240.4 $253.3 $242.2 $278.8 $193.9 $178.7
Adjusted EBITDA margin 7.4% 6.8% 4.8% 3.5% 4.5% 4.3% 4.1% 4.2% 4.0% 4.4% 3.3% 3.0%
Adjusted EBITDA margin (Pre-IFRS 16) 5.4% 4.9% 4.8% 3.5% 4.5% 4.3% 4.1% 4.2% 4.0% 4.4% 3.3% 3.0%
Adjusted EPS $0.58 $0.49 $0.46 $0.27 $0.40 $0.37 $0.35 $0.33 $0.27 $0.32 $0.18 $0.13
(1)
Free cash flow $28.7 $224.2 $175.6 $179.2 $58.4 $127.5 $342.7 $248.4 $111.2 $106.6 $150.7 $15.5
Capital expenditures $196.0 $91.4 $227.1 $86.5 $73.4 $47.6 $84.0 $70.9 $58.5 $74.6 $111.9 $96.3
Dividends per share $0.12 $0.12 $0.11 $0.11 $0.11 $0.11 $0.105 $0.105 $0.105 $0.105 $0.1025 $0.1025
Share price $34.42 $35.52 $29.94 $29.75 $23.43 $26.12 $25.01 $23.31 $23.73 $20.39 $21.50 $16.24
1 Amounts have been restated to be consistent with the pre-IFRS 16 definitions. See “Non-GAAP Financial Measures & Financial metrics" section of Empire’s News Release for the
second quarter ended November 2, 2019.
2 In Q1 F20, the Company expensed $21 million in closure and conversion costs. These costs relate to the announced conversion of ten Safeway locations to FreshCo stores and the
conversion of two Company locations to Farm Boy stores that were announced in Q1 F20. Of the $21 million, $3.7 million was reversed in the Q2 F20.
3 Certain financial metrics were impacted by the implementation of IFRS 16 in the Q1 F20. See Appendix C for additional details.
4 Q3 F19 results include $45 million in costs related to the B.C. labour buyouts and FreshCo conversion store closures which impacted selling and administrative costs. Of the $45 million,
$6.1 million was reversed in Q2 F20. 12Appendices A – E
Appendix A
     Geographic Profile

                         National scale and presence, operating over 1,900 stores in 10 provinces.

                                                                      Total Canada
                                                                        = 1,959 1
                                       West
                                                                                                                                                                    Atlantic

                                       414
                                                                                                                                                                       461

                                                                            47
                   102

                                         227
                                                            38                                        362                            722                               95

                                                                                                                                                              33
                                                                                                   Ontario
                                                                                                                                 Quebec
                                                                                                                                                        119
                                                                                                                                                              214

1   Please refer to Empire’s Annual Information Form for the fiscal year ended May 4, 2019 for more information on Sobeys’ Geographic and Banner Profile.                      14
Appendix B
Farm Boy – Company Overview
▪ Founded in 1981, Farm Boy Inc., (“Farm Boy”) is an Ontario-
based retail grocer that has a focus on high quality and locally-
sourced meat and produce and offers a wide range of
exceptional private label and prepared foods and renowned
customer service
▪ Farm Boy is led by Jean-Louis Bellemare (founder and co-CEO)
and Jeff York (co-CEO), both are continuing their leadership
roles with Farm Boy
▪ Farm Boy operates a unique and compelling brand that
resonates with Canadians and has a passionate and loyal
customer base
▪ Scalable platform with infrastructure in place to support future
long-term growth
▪ Over the last 5 years, Farm Boy has approximately doubled
store count and delivered strong revenue, EBITDA and free
cash flow growth
▪ Today, Farm Boy has 29 stores with defined plans for continued
expansion into the GTA
15Farm Boy – Key Investment Highlights
✓1 Aligned with Empire’s Strategic Priorities
✓2 Leading Specialty Food Retailer with Strong Brand
Loyalty
✓3 Attractive, Scalable Platform Primed for Growth
✓4 Enhances Presence in Urban Markets with
Established, Well-Known Brand in Ontario
✓5 Exceptional Private Label Offering
✓6 Retention of Strong and Driven Management Team
16Farm Boy – Transaction Overview
▪ Empire, through a subsidiary, signed an agreement on September 24, 2018, to acquire the business of Farm Boy for
a total purchase price of $800 million; transaction closed on December 10, 2018
Purchase
▪ Farm Boy is set up as a separate company within Empire’s structure
Price & Timing
▪ Farm Boy’s Co-CEOs, together with members of their senior management team, have reinvested for a 12% interest
of the continuing Farm Boy business
▪ Accretive to adjusted earnings per share and operating cash flow per share in the first full fiscal year after closing
▪ Empire’s fourth quarter of fiscal 2019 was the first full quarter including contributions from Farm Boy
▪ Empire’s fiscal year 2020 will be the first year including a full year of contributions from Farm Boy
Financial
▪ Historical EBITDA CAGR of 21% with compelling EBITDA margin profile(1)
Profile
▪ Plan to double store count, sales and EBITDA in the next 5 years
▪ Free cash flow generation sufficient to self-fund growth
▪ Three year average same-store sales growth of 5.3%(2)
▪ The acquisition was financed through a combination of cash on hand and a new $400 million senior, unsecured, non-
Financial revolving two-year credit facility
Flexibility
▪ Rapid deleveraging profile
(1) For the period from FY2014 through the 52 weeks ended July 14, 2018
(2) FY2015 through FY2017.
17Appendix C
IFRS 16 Update
IFRS 16
OVERVIEW
• IFRS 16 intends to align the presentation of leased assets more closely to owned assets.
• Impact of the standard has been reflected in the financial statements for the second quarter and year-to-date of fiscal 2020.
• This standard will not impact Empire's strategy, business operations, or cash flow generation.
• The adoption of IFRS 16 had a material impact on balance sheet classifications.
• The Company expects that the adoption of IFRS 16 will not have a material impact on fiscal 2020 EPS.
INCOME STATEMENT IMPACT BALANCE SHEET IMPACT
13 Weeks Ended Adjustments to opening balances resulting from the initial adoption of IFRS 16:
($ in millions, except Aug. 3, Nov.
Nov. 2, Aug. 4,
3, Impact of Change
Change As at May 5, 2019 ($ in millions)
per share amounts) 2019 2018 IFRS 16(1) (excl. IFRS 16)
Asset increase (decrease):
EBITDA $460.0
$477.7 $278.7
$276.1 $181.3
$201.6 $129.0
$133.2 $52.3
$68.4
Prepaid expenses $(43.4)
Adjusted EBITDA
Adjusted EBITDA $460.0
$477.7 $278.7
$279.1 $181.3
$198.6 $129.0
$133.2 $52.3
$65.4
6.8% 4.3% 2.5% 1.9% 0.6% Current loans and other receivables 53.6
EBITDA
EBITDA margin
margin 7.4% 4.4% 3.0% 2.1% 0.9%
Finance $71.7 $23.1 $48.6 $46.3 $2.3 Non-current loans and other receivables 519.0
Finance costs,
costs, net
net $69.9 $22.7 $47.2 $47.2 -
Other assets (7.3)
Net earnings
Net earnings(2) $130.6
$154.6 $95.6
$103.8 $35.0
$50.8 $(0.9)
$0.8 $35.9
$50.0
Adjusted $133.9 $100.2 $33.7 $(2.0) $35.7 Property and equipment (22.3)
Adjusted net
net earnings
earnings(2) $158.0 $110.4 $47.6 $(0.3) $47.9
Right-of-use assets 3,800.7
Adjusted EPS (fully diluted) $0.49 $0.37 $0.12 $(0.01) $0.13
Adjusted EPS (fully diluted) $0.58 $0.40 $0.18 - $0.18 Intangibles (126.7)
26 Weeks Ended Deferred tax assets 127.3
Nov. 2, Nov. 3, Total assets $4,300.9
($ in millions, except Change Impact of Change
2019 2018 Liabilities and equity (increase) decrease:
per share amounts) IFRS 16(1) (excl. IFRS 16)
Current provisions $7.4
EBITDA $937.7 $554.8 $382.9 $262.2 $120.7
Long-term debt due within one year 6.5
Adjusted EBITDA $937.7 $557.8 $379.9 $262.2 $117.7
Lease liabilities due within one year (424.4)
EBITDA margin 7.1% 4.4% 2.7% 2.0% 0.7%
Long-term provisions 23.7
Finance costs, net $141.6 $45.8 $95.8 $93.5 $2.3
Long-term debt 22.6
Net earnings(2) $285.2 $199.4 $85.8 $(0.1) $85.9
Long-term lease liabilities (4,569.6)
Adjusted net earnings(2) $291.9 $210.6 $81.3 $(2.3) $83.6 Other long-term liabilities 164.4
Adjusted EPS (fully diluted) $1.07 $0.77 $0.30 $(0.01) $0.31 Deferred tax liabilities 36.5
(1) Reflects the impact of changing accounting standards from IAS 17 to IFRS 16 in the first quarter of fiscal 2020, Retained earnings 432.0
including the second quarter and year-to-date add backs of $3.5 million and $7.0 million ($2.6 million and $5.1 Total liabilities and equity $(4,300.9)
million after tax), respectively, in historical straight-line expense under IAS 17.
(2) Net of non-controlling interest. 18Appendix D
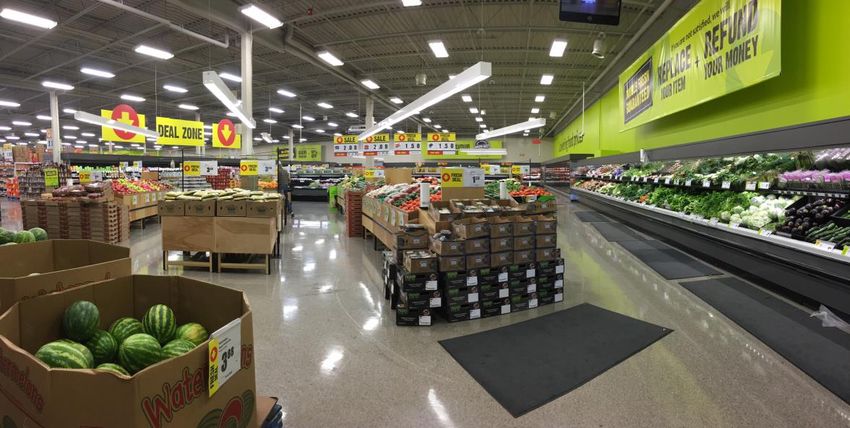
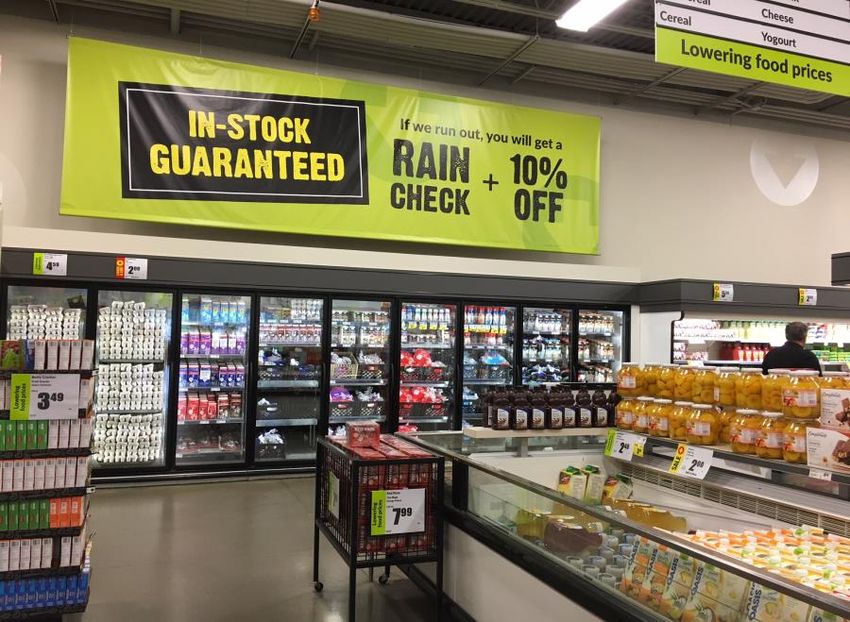
FreshCo 2.0
19FreshCo 2.0
20Appendix E
Voilà – Canada’s best online grocery home delivery service
Voilà by Sobeys promises to help Canadians stay one step ahead of their busy lives.
Key Facts:
• Powered by Ocado’s world-leading online grocery engine, Voilà by
Sobeys will offer an expansive product selection of up to 39,000
products, including high quality fresh produce, at prices comparable to
Sobeys and IGA.
• Construction of CFC in Vaughan, Ontario is on track to roll out
testing and soft launch in the GTA in late Spring 2020.
• Ocado is building the grid in the ambient & chilled portions of the
warehouse
• On-boarding suppliers in process
• Finalizing assortment
• Currently testing robots on the grid
• Delivery trucks are ordered and arriving
• Team on-boarding ongoing
• Second CFC announced to open in Montreal in 2021, serving major
cities in Quebec and the Ottawa Area.
• Empire has partnered with Crombie REIT to develop the second CFC in
Montreal.
21Voilà by Sobeys – Vaughan CFC
Inside View - Vaughn CFC Outside View – Vaugh CFC
View of grid construction at Vaughan CFC Ocado’s live CFC in Erith, UK
22You can also read