Building a Premier Mid-Tier African Gold Producer - Corporate Presentation AIM | TSX: ASO - Avesoro
←
→
Page content transcription
If your browser does not render page correctly, please read the page content below
Building a Premier
 Mid-Tier African Gold
 Producer

Corporate Presentation

June 2019
AIM | TSX: ASO
Forward Looking Information

Certain information contained in this presentation constitutes forward looking information or forward looking statements with the meaning of applicable securities laws. This information or statements may relate to future events, facts, or circumstances or Avesoro Resources (the “Company”)
future financial or operating performance or other future events or circumstances. All information other than historical fact is forward looking information and involves known and unknown risks, uncertainties and other factors which may cause the actual results or performance to be
materially different from any future results, performance, events or circumstances expressed or implied by such forward-looking statements or information. Such statements can be identified by the use of words such as “anticipate”, “plan”, “continue”, “estimate”, “expect”, “may”, “will”, “would”,
“project”, “should”, “believe”, “target”, “predict” and “potential”. No assurance can be given that this information will prove to be correct and such forward looking information included in this presentation should not be unduly relied upon. Forward looking information and statements speaks
only as of the date of this presentation.
Forward looking statements or information in this presentation include, among other things, statements regarding the Company’s New Liberty Gold Mine in Liberia and Youga Gold mine in Burkina Faso; statements regarding improvements in its unit cost base, increased mining rates, increased
plant throughputs, targeting gold production in 2019 of between 210 to 230koz of gold at an operating cash cost of US$850 to US$910 / oz and AISC of US$1.100 to US$1,190 / oz, the publishing of an updated Mineral Resource and Mineral Reserve for Youga during Q2 2019; and proposed
plans and exploration activities around New Liberty, Youga and the Company’s other target areas for exploration.
In making the forward looking information or statements contained in this presentation, assumptions have been made regarding, among other things: general business, economic and mining industry conditions; interest rates and foreign exchange rates; the continuing accuracy of mineral
resource and reserve estimates; geological and metallurgical conditions (including with respect to the size, grade and recoverability of mineral resources and reserves) and cost estimates on which the mineral resource and reserve estimates are based; the supply and demand for commodities
and precious and base metals and the level and volatility of the prices of gold; market competition; the ability of the Company to raise sufficient funds from capital markets and/or debt to meet its future obligations and planned activities and that unforeseen events do not impact the ability of
the Company to use existing funds to fund future plans and projects as currently contemplated; the stability and predictability of the political environments and legal and regulatory frameworks in Burkina Faso and Liberia including with respect to, among other things, the ability of the
Company to obtain, maintain, renew and/or extend required permits, licences, authorizations and/or approvals from the appropriate regulatory authorities; that contractual counterparties perform as agreed; and the ability of the Company to continue to obtain qualified staff and equipment
in a timely and cost-efficient manner to meet its demand.
Actual results could differ materially from those anticipated in the forward looking information or statements contained in this presentation as a result of risks and uncertainties (both foreseen and unforeseen), and should not be read as guarantees of future performance or results, and will
not necessarily be accurate indicators of whether or not such results will be achieved. These risks and uncertainties include the risks normally incidental to exploration and development of mineral projects and the conduct of mining operations (including exploration failure, cost overruns or
increases, and operational difficulties resulting from plant or equipment failure, among others); the inability of the Company to obtain required financing when needed and/or on acceptable terms or at all; risks related to operating in West Africa, including potentially more limited infrastructure
and/or less developed legal and regulatory regimes; health risks associated with the mining workforce in West Africa; risks related to the Company’s title to its mineral properties; the risk of adverse changes in commodity prices; the risk that the Company’s exploration for and development of
mineral deposits may not be successful; the inability of the Company to obtain, maintain, renew and/or extend required licences, permits, authorizations and/or approvals from the appropriate regulatory authorities and other risks relating to the legal and regulatory frameworks in Burkina
Faso including adverse or arbitrary changes in applicable laws or regulations or in their enforcement; competitive conditions in the mineral exploration and mining industry; risks related to obtaining insurance or adequate levels of insurance for the Company’s operations; that mineral resource
and reserve estimates are only estimates and actual metal produced may be less than estimated in a mineral resource or reserve estimate; the risk that the Company will be unable to delineate additional mineral resources; risks related to environmental regulations and cost of compliance, as
well as costs associated with possible breaches of such regulations; uncertainties in the interpretation of results from drilling; risks related to the tax residency of the Company; the possibility that future exploration, development or mining results will not be consistent with expectations; the risk
of delays in construction resulting from, among others, the failure to obtain materials in a timely manner or on a delayed schedule; inflation pressures which may increase the cost of production or of consumables beyond what is estimated in studies and forecasts; changes in exchange and
interest rates; risks related to the activities of artisanal miners, whose activities could delay or hinder exploration or mining operations; the risk that third parties to contracts may not perform as contracted or may breach their agreements; the risk that plant, equipment or labour may not be
available at a reasonable cost or at all, or cease to be available, or in the case of labour, may undertake strike or other labour actions; the inability to attract and retain key management and personnel; and the risk of political uncertainty, terrorism, civil strife, or war in the jurisdictions in which
the Company operates, or in neighbouring jurisdictions which could impact on the Company’s exploration, development and operating activities.
This presentation also contains mineral “resource” and mineral “reserve” estimates. Information relating to mineral “resources” and “reserves” contained in this presentation is considered forward looking information in nature, as such estimates are estimates only, and that involve the implied
assessment of the amount of minerals that may be economically extracted in a given area based on certain judgments and assumptions made by qualified persons, including the future economic viability of the deposit based on, among other things, future estimates of commodity prices. Such
estimates are expressions of judgment and opinion based on the knowledge, mining experience, analysis of drilling results and industry practices of the qualified persons making the estimate. Valid estimates made at a given time may significantly change when new information becomes
available, and may have to change as a result of numerous factors, including changes in the prevailing price of gold. By their nature, mineral resource and reserve estimates are imprecise and depend, to a certain extent, upon statistical inferences which may ultimately prove unreliable. If such
mineral resource or reserve estimates are inaccurate or are reduced in the future (including through changes in grade or tonnage), this could have a material adverse impact on the Company and its operating and financial performance. Mineral resources that are not mineral reserves do not
have demonstrated economic viability. Due to the uncertainty that may be attached to inferred mineral resources, it cannot be assumed that all or any part of an inferred mineral resource will be upgraded to an indicated or measured mineral resource as a result of continued exploration.
Although the forward-looking statements contained in this presentation are based upon what management believes are reasonable assumptions, the Company cannot provide assurance that actual results or performance will be consistent with these forward-looking statements. The forward
looking information and statements included in this presentation are expressly qualified by this cautionary statement and are made only as of the date of this presentation. The Company does not undertake any obligation to publicly update or revise any forward looking information except as
required by applicable securities laws.
Non IFRS Financial Performance Measures
The Company has included certain non-IFRS financial measures in this presentation, including operating cash costs and all-in sustaining costs ("AISC") per ounce of gold produced. These non-IFRS financial measures do not have any standardised meaning. Accordingly, these financial measures
are intended to provide additional information and should not be considered in isolation or as a substitute for measures of performance prepared in accordance with International Financial Reporting Standards (“IFRS”). Operating cash costs and all-in-sustaining cash costs are a common
financial performance measure in the mining industry but have no standard definition under IFRS. Operating cash costs are reflective of the cost of production. AISC include operating cash costs, net-smelter royalty, corporate costs, sustaining capital expenditure, sustaining exploration
expenditure and capitalised stripping costs. The Company calculates EBITDA as net profit or loss for the period excluding finance costs, income tax expense and depreciation. EBITDA excludes the impact of cash costs of financing activities and taxes and the effects of changes in working capital
balances and therefore is not necessarily indicative of operating profit or cash flow from operations as determined under IFRS. Other companies may calculate these measures differently.

NI 43-101 Statement
The Company’s Qualified Person is Mark J. Pryor, who holds a BSc (Hons) in Geology & Mineralogy from Aberdeen University, United Kingdom and is a Fellow of the Geological Society of London, a Fellow of the Society of Economic Geologists and a registered Professional Natural Scientist
(Pr.Sci.Nat) of the South African Council for Natural Scientific Professions. Mark Pryor is a technical consultant with over 25 years of extensive global experience in exploration, mining and mine development and is a “Qualified Person” as defined in National Instrument 43 -101 “Standards of
Disclosure for Mineral Projects” of the Canadian Securities Administrators and has reviewed and approved this presentation. Mr. Pryor is independent of the Company as determined under NI 43-101. Mr. Pryor has reviewed and approved the technical and scientific information contained in
this Presentation.
The information in this presentation relating to the Open Pit Mineral Resource Estimate for the New Liberty Gold Mine has been prepared by Dr. Belinda van Lente, who is a registered Professional Natural Scientist (Pr.Sci.Nat) of the South African Council for Natural Scientific Professions. Dr.
van Lente is a full-time employee of CSA Global (UK) Ltd and has sufficient experience which is relevant to the style of mineralisation and type of deposit under consideration and to the activity which she has undertaken to qualify as a “Qualified Person” as defined in National Instrument 43-101
“Standards of Disclosure for Mineral Projects” of the Canadian Securities Administrators. The information in this presentation relating to the open pit Mineral Reserves for the New Liberty Gold Mine has been prepared by Dr. Matthew Randall, who is Chartered Engineer and a registered
Member of the Institute of Materials, Minerals and Mining (IMMM) of the UK. Dr. Matthew Randall is an associate mining engineer of CSA Global (UK) Ltd and has sufficient experience which is relevant to the style of mineralisation and type of deposit under consideration and to the activity
which he has undertaken to qualify as a “Qualified Person” as defined in National Instrument 43-101 “Standards of Disclosure for Mineral Projects” of the Canadian Securities Administrators. The information in this presentation relating to the underground Mineral Reserves estimate for the
New Liberty Gold Mine has been prepared by Clive Brown, who is a registered Professional Engineer (Pr. Eng.) with the Engineering Council of South Africa and a fellow of the South African Institute of Mining and Metallurgy. Mr Brown is a director of Bara Consulting and an associate of CSA
Global (UK) Ltd and has sufficient experience which is relevant to the style of mineralisation and type of deposit under consideration and to the activity which he has undertaken to qualify as a “Qualified Person” as defined in National Instrument 43-101 “Standards of Disclosure for Mineral
Projects” of the Canadian Securities Administrators.

The information in this presentation relating to the Mineral Resource Estimates for the Youga Gold Mine has been prepared by Dr. Belinda van Lente, who is a registered Professional Natural Scientist (Pr.Sci.Nat) of the South African Council for Natural Scientific Professions. Dr. van Lente is a
full-time employee of CSA Global (UK) Ltd and has sufficient experience which is relevant to the style of mineralisation and type of deposit under consideration and to the activity which she has undertaken to qualify as a “Qualified Person” as defined in National Instrument 43-101 “Standards
of Disclosure for Mineral Projects” of the Canadian Securities Administrators. The information in this presentation relating to the Mineral Reserves for the Youga Gold Mine has been prepared by Dr. Matthew Randall, who is Chartered Engineer and a registered Member of the Institute of
Materials, Minerals and Mining (IMMM) of the UK. Dr. Matthew Randall is an associate mining engineer of CSA Global (UK) Ltd and has sufficient experience which is relevant to the style of mineralisation and type of deposit under consideration and to the activity which he has undertaken to
qualify as a “Qualified Person” as defined in National Instrument 43-101 “Standards of Disclosure for Mineral Projects” of the Canadian Securities Administrators
The Company has also filed current NI 43-101 technical reports in Canada at www.sedar.com These technical reports include relevant information regarding the effective dates and the assumptions, parameters and methods of the mineral resource and reserve estimates cited in this
presentation, as well as information regarding data verification, exploration procedures and other matters relevant to the scientific and technical disclosure contained in this presentation.

                                                                                                                                                                                                                                                    AIM | TSX: ASO                                       2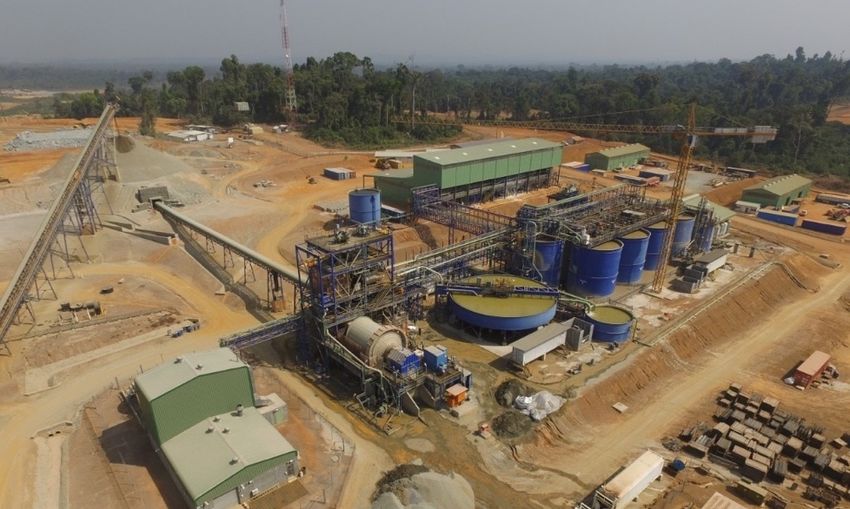
Avesoro Resources
Snapshot

 West African gold producer with producing mines in Liberia and Burkina Faso

 Low cost operator and mine builder

 Potential for further LOM extensions through Mineral Reserves increases

  Overview
  AIM/TSX listed                                             ASO
  Market Capitalisation                                      US$100 million1
  Cash                                                       US$9.3 million2
  Debt                                                       US$138.8 million2
                                                                                                       Burkina
  2018 Production                                                                                       Faso
                                                                                                             Youga
  Group Production                                           220koz
            New Liberty                                      109.8koz              New
                                                                                 Liberty
                                                                                             Kokoya*
            Youga                                            110.7koz                  Liberia

  2019 Production Guidance
  Gold Production                                          210 - 230koz
  Operating Cash Cost                                      US$850 – 910/oz
  AISC                                                     US$1,100 – 1,190/oz

 1 Asat June 3, 2019
 2 As at March 31, 2019                                                                                              AIM | TSX: ASO   3
 * Kokoya is owned by Avesoro Jersey, Avesoro Resources Majority Shareholder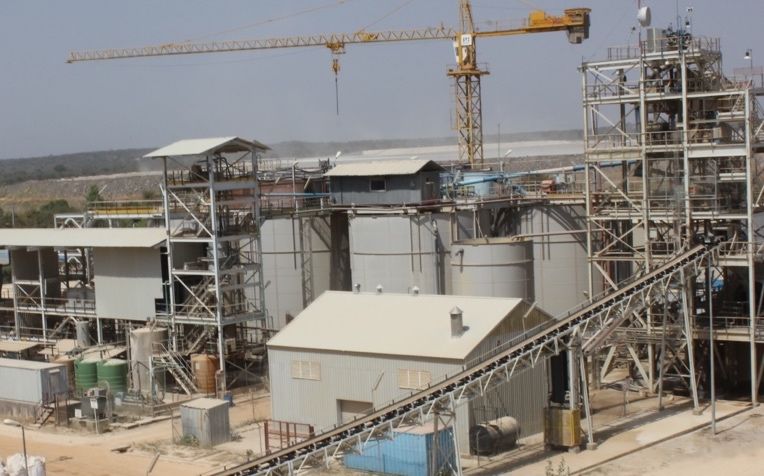
Avesoro Resources

 New Liberty & Youga Combined Metrics

      Group Assets Combined Metrics
      M&I Resources (inc. Reserves)                                                      42.6Mt @ 2.1 g/t Au – 2.94Moz
      P&P Reserves                                                                       31.6Mt @ 2.1 g/t Au – 2.17Moz
      LOM Production                                                                     1.99Moz
      Mining Cost                                                                        US$1.71/tonne mined
      Processing Cost                                                                    US$19.51/tonne processed
      LOM AISC                                                                           US$903/oz
      NPV                                                                                US$428.5m

                         300,000
                                                                          Combined Annual Gold Production
                                                                                Youga Gold Mine                 New Liberty Gold Mine
                         250,000
    Gold Produced (oz)

                         200,000

                         150,000

                         100,000

                          50,000

                              -
                                   2019      2020            2021         2022           2023           2024           2025           2026           2027           2028           2029           2030           2031
Combined metrics as per NI 43-101 compliant announcement dated 9 May 2019 and entitled “Avesoro Reports a 23% Increase In Mineral Reserves at the Youga Gold Mine, Burkina Faso” and Technical Report dated January 31, 2019
and entitled “NI 43-101 Pre-Feasibility Report, Mineral Resource and Mineral Reserve Update for the New Liberty Gold Mine, Liberia ”

NPV is calculated at 5% discount rate and US$1,300/oz gold price

                                                                                                                                                                                  AIM | TSX: ASO                          4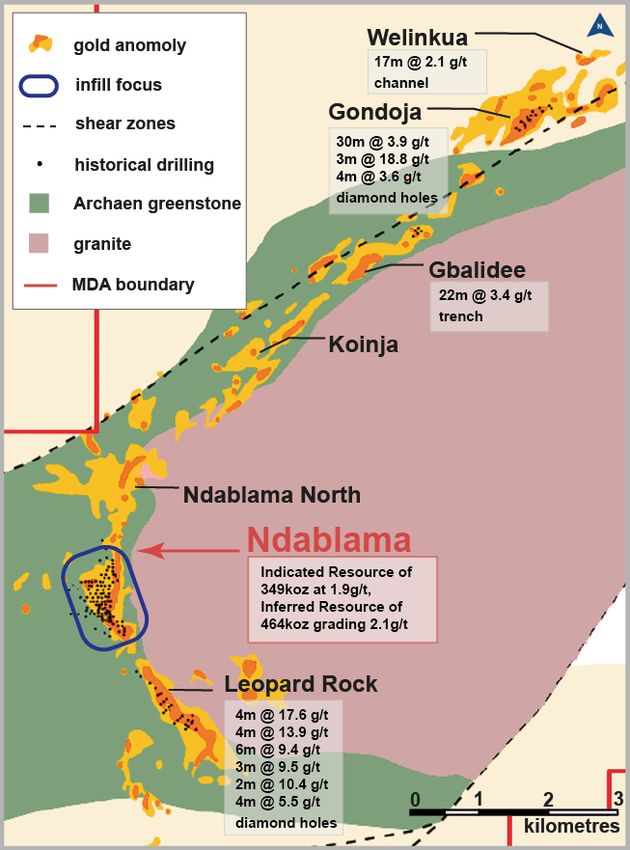
Avesoro Resources

   Production & Cost Performance Trends

                  Gold Production Oz            Operating Cash C ost          All In Sustaining Cost
                                                                                                                Physical performance at both assets
                                                                                                                slightly behind targeted production levels
                                                                                                                in Q1 2019 despite improvements in total
                                                                                                                material movement
 $2,153
                                                             68,088
            $2,067                                                                                              Operating cash costs and AISC have
                                                                                                                improved QoQ and are within FY2019
                                                                       60,231                                   guidance range
$1,971
                                                                                                                Q1 2019 New Liberty:
         $1,775                 $1,600
                                                                                                                   HME focused on waste stripping in Q1
                                         $1,447                                 47,177                             2019 with 26% increase in waste
                                                                                          44,962 45,098
                         $1,488                                                                                    mined QoQ
                                                       $1,206                             $1,226
                                                                                $1,155
                                                                                                                   Increased waste stripping focus to
                                                                                                       $1,148
                                                                                                                   increase access to ore faces
                                                                       $985
                    $1,051                                      $899
                                                                                                                   Plant feed grades increased by 23%
                             $1,035                 28,408
                                                                                           $982
                                                                                                                   QoQ to 3.0g/t
                                                                                                       $911
                                         $877                                    $877                              Gold production increased 5% QoQ
                                         19,885      $770
            18,872
                                                                       $698                                     Q1 2019 Youga:
                       14,907   15,825                          $624
 14,392
                                                                                                                   TMM increased by 11% to 4,764kt with
                                                                                                                   12% increase in waste mined QoQ
                                                                                                                   High strip resulted in a 7% decrease
                                                                                                                   QoQ in ore processed

Q3 2016 Q4 2016 Q1 2017 Q2 2017 Q3 2017 Q4 2017 Q1 2018 Q2 2018 Q3 2018 Q4 2018 Q1 2019                            Gold production decreased 6% QoQ

                                                                                                                                 AIM | TSX: ASO         5
Avesoro Resources

Q1 2019 Group Operating Highlights

Gold Production of 45.4koz
        New Liberty: 25.9koz, an increase of 5% on Q4 2018
        Youga: 19.2koz, a reduction of 6% on Q4 2018 as a result of additional lower grade blocks
        mined and continued unplanned ore dilution at Gassoré pit
        Total material mined of 13,201kt, a 19% increase on Q4 2018 & a 67% increase on Q1 2018
        Waste mining rates increased by 21% on Q4 2018 (+72% on Q1 2018), due an to increased
        focus on waste stripping to increase access to ore in future periods
        Significant reductions in mining costs achieved at both assets

                                                           Q1 19 vs Q4 18                  Q1 19 vs Q1 18
  Parameter         Unit         Q1 2019       Q4 2018                      Q1 2018
                                                              Variance                       Variance

  Ore Mined          kt           609            629            -3%          592                3%

 Waste Mined         kt          12,592         10,443          21%          7,312             72%

 Total Material
                     kt          13,201         11,073          19%          7,904             67%
  Movement
     Ore
                     kt           628            707            -11%         650                -3%
  Processed
     Gold
                  Ounces         45,098        44,962           0%          68,088             -34%
  Production

                                                                                      AIM | TSX: ASO        6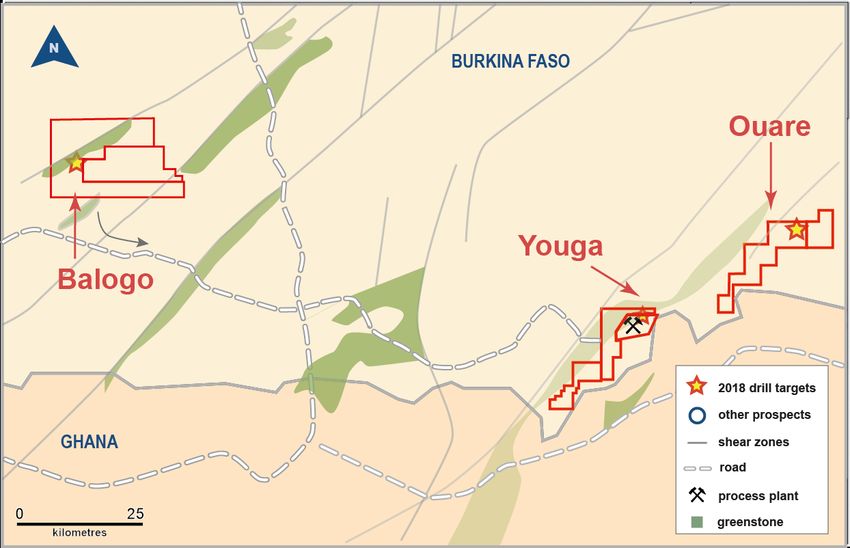
Avesoro Resources

Q1 2019 Financial Highlights

                                           Q1          Q4          YoY
 Parameter                                2019        2018       Variance
 Gold sold                  oz            45, 810     46,186          -1%
                                                                            Gold sales remained flat QoQ
 Average realised
                  US$/oz                     1,304     1,226          6%    5% increase in revenue from
 gold price
                                                                            gold sales QoQ due to higher
 Gold sales                 US$m              59.7     56.6            5%
                                                                            average realised gold price
 EBITDA 1                   US$m               9.5       4.7         102%
                                                                            7% improvement in operating
 EBITDA margin              %                    16          8       98%
                                                                            cash costs QoQ
 Cash flow from
                            US$m                5.1     10.7         -52%
 operations                                                                 6% improvement in AISC QoQ
 Operating cash             US$/oz                                          Cost improvements as a
                                                911     982           -7%
 costs 1                    sold                                            result of reduction in unit
 All in sustaining          US$/oz                                          mining cost
                                             1,149     1,226          -6%
 costs 1                    sold
  1   See “Non IFRS Financial Performance Measures”

                                                                                         AIM | TSX: ASO   7
Avesoro Resources

Ongoing Cost Reduction & Optimisation Strategy

Ongoing focus on cost reductions and operational efficiencies

  Headcount reduction program ongoing

  Transition to contractor mining at New Liberty and Youga

       Guaranteed fixed cost per tonne mined

       Provides access to additional mining equipment allowing increased material
       movement

       Reduction in procurement costs

  Cost reductions via changing explosives supplier at New Liberty

  Ore sorting and heap leach scenarios being considered to increase revenue from low
  grade marginal ore

                                                                     AIM | TSX: ASO    8
New Liberty Gold Mine
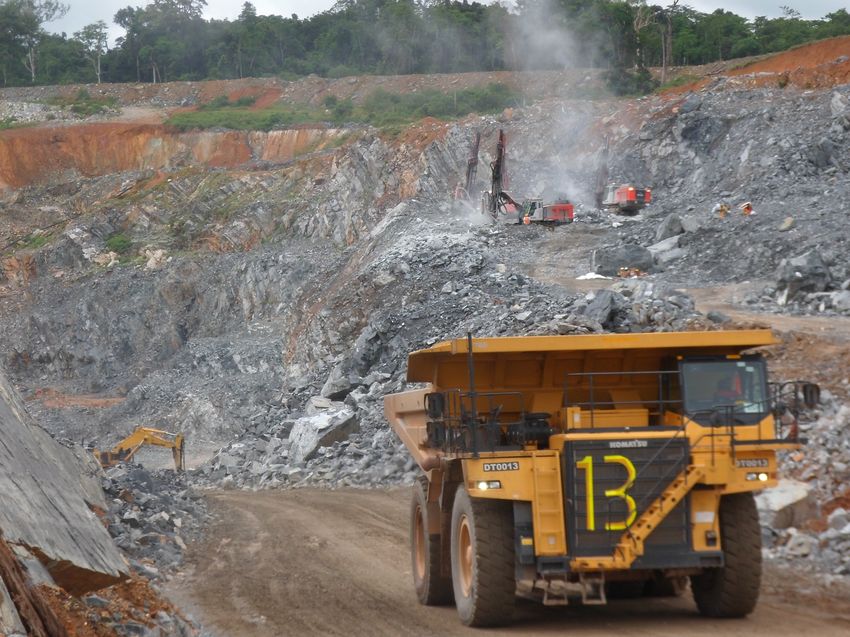
Asset Overview
Operations turned around by current
Liberia
management team 48,000 metres of diamond drilling completed in 2018 to increase Life of Mine
M&I Resources (inc. Reserves) 20.5Mt @ 2.66 g/t Au – 1.75Moz1
1.75Moz M&I Mineral Resources P&P Reserves 17Mt @ 2.49 g/t Au – 1.36Moz1
including 1.36Moz of P&P Mineral Life of Mine 11 years (2019 – 2029) 1
Reserves LOM Production 1.26Moz1
LOM Operating Cash Cost US$767/oz1
2018 Gold production of 109,707 LOM AISC US$862/oz1
ounces (+44% on FY2017) Project NPV US$286m2
New Liberty Process Plant
Due to transition from open-pit to
combined open-pit & underground
mining operation from 2020
Forecast 2019 gold production of 120 –
130koz at operating cash cost of
US$870 – US$925 & AISC of US$990 –
US$1,055 per ounce
Large under-explored exploration
portfolio within 20km of process plant 1 As per NI 43-101 compliant Technical Report dated January 31, 2019 and entitled “NI 43-101 Pre-Feasibility
Report, Mineral Resource and Mineral Reserve Update for the New Liberty Gold Mine, Liberia ”
2 5% discount rate (after debt repayment and associated finance charges) & US$1,300/oz gold price
AIM | TSX: ASO 9
New Liberty Gold Mine

                      Updated NI 43-101 Highlights

                           Updated NI 43-101 announced during March 2019
                           Mineral Reserves increased by 89% to 17Mt containing 1,355,000 ounces of gold
                           LOM extension to 2029 (+7 years), substantial potential to increase Mineral Reserves further

                         2017 NI 43-101 Mineral Reserves                                 2019 NI 43-101 Mineral Reserves

                                                                                                          NL        Ndablama
                                   NL Open Pit                                                        Underground   Open Pit

                                                                                                 460.6 koz               400.1 koz
                                       0.7Moz                                                                1.36Moz

                                       717.0 koz
                                                              + 89%                                        NL Open Pit
                                                                                                             493.8 koz

                      200,000                                                                                                                    4.00
Recovered Gold (oz)

                                                                                                                                                 3.50

                                                                                                                                                         Feed Grade (g/t)
                      150,000                                                                                                                    3.00
                                                                                                                                                 2.50
                      100,000                                                                                                                    2.00
                                                                                                                                                 1.50
                       50,000                                                                                                                    1.00
                                                                                                                                                 0.50
                           -                                                                                                                     -
                                2019       2020    2021     2022       2023       2024         2025      2026       2027       2028    2029

                                                      2019 NI 43-101          2017 NI 43-101          2019 PFS grade

                                                                                                                                AIM | TSX: ASO          10
New Liberty Gold Mine
Life of Mine Financials
1
Physicals LOM Financials (US$)
New Liberty Open Pit Revenue 1,637,279,430
Ore tonnes 4,917,490 Royalty 49,118,383
Waste tonnes 89,592,062 Opex 966,200,209
Strip 18.2 Upfront capex 35,941,382
Grade (g/t) 3.12 Sustaining capex 70,055,594
Pre tax cashflow 396,272,557
Ndablama Open Pit Post tax cashflow 370,332,266
Ore tonnes 7,282,325 Assumptions
Waste tonnes 50,753,437 Gold price (US$) 1,300
Strip 7.0 Tax rate 25%
Grade (g/t) 1.71 Contingency 10%
New Liberty Underground Costs (US$/oz)
Ore tonnes 4,658,920 C1 cash cost 767.2
Grade (g/t) 3.08 C3 cash cost 806.2
AISC 861.8
Processing
Milled tonnes 17,069,027 NPV (US$m)1
Average grade (g/t) 2.49 5.0% 285.8
Recovered gold 1,259,446 7.5% 253.9
10.0% 227.1
1
Post c.US$120m of existing bank debt, equipment loans and associated finance costs
AIM | TSX: ASO 11New Liberty Gold Mine
Life of Mine Production Schedule
Ore Mined and Strip Ratio
5,000,000 25.0
Strip Ratio (W: O)
4,000,000 20.0
Ore Mined (t)
3,000,000 15.0
2,000,000 10.0
1,000,000 5.0
- -
2019 2020 2021 2022 2023 2024 2025 2026 2027 2028 2029
New Liberty Open Pit Ore New Liberty Underground Ore Ndablama Ore New Liberty Strip Ratio Ndablama Strip Ratio
Gold Produced and Plant Feed Grade
180,000 4.00
160,000 3.50
Recovered Gold (oz)
Feed Grade (g/t)
140,000 3.00
120,000
2.50
100,000
2.00
80,000
1.50
60,000
40,000 1.00
20,000 0.50
- -
2019 2020 2021 2022 2023 2024 2025 2026 2027 2028 2029
2019 NI 43-101 2017 NI 43-101 2019 PFS grade
AIM | TSX: ASO 12New Liberty Gold Mine
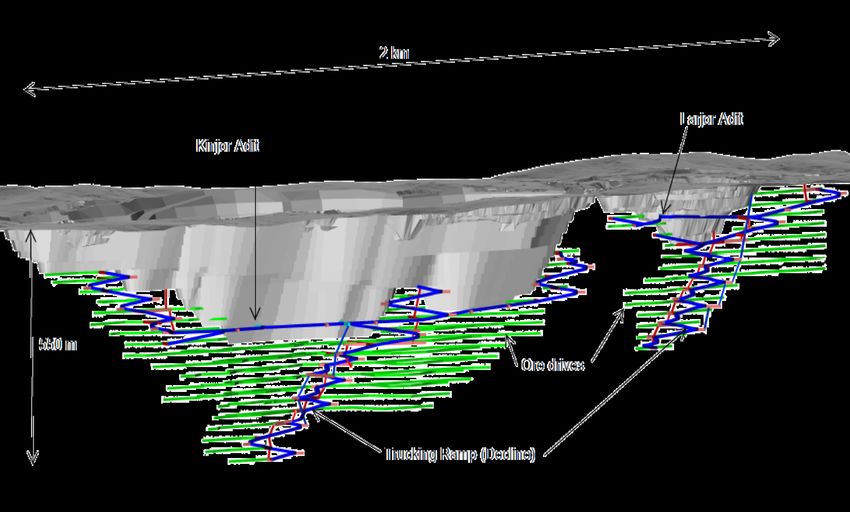
Underground Mine Design
Contractor mining
Long hole open stoping
Open at depth – potential to increase underground Mineral Reserves
AIM | TSX: ASO 13New Liberty Gold Mine
Potential For A Regional Scale Mine
Large 1,394km2
exploration
portfolio - only
partly explored
New Liberty plant
now optimised –
central processing
hub
Potential for
multiple satellite
pits
Ndablama on a
13km gold belt -
potential to host
multi-million ounce
resource
Matambo, Silver
Hills, Weaju and
other targets –
vast potential
AIM | TSX: ASO 14New Liberty Gold Mine
New Liberty Satellite Deposit - Ndablama
Ndablama – Satellite Deposit to New Liberty
45km north east of New Liberty
Ore haulage to New Liberty scheduled to commence in 2022
Heap Leach operation under consideration to further
optimise asset value
Ndablama Resource & Reserve from only 1km strike
13km gold corridor with multiple known and sampled targets
Ndablama Mineral Resource
Measured & Indicated – 9.7Mt at 1.9g/t Au (588koz of gold)
Inferred – 0.3Mt at 1.6g/t Au (16koz of gold)
Ndablama Mineral Reserve
Probable Reserve – 7.3Mt at 1.7g/t Au (400koz of gold)
AIM | TSX: ASO 15New Liberty Gold Mine
Q1 2019 Performance
Gold Sales & Costs Total material movement increased by 24% in
Gold Sales AISC Cash Cost Q1, following improvements in mining fleet
US$ 1,246 /oz
availability and in-pit efficiencies
US$ 1,095 /oz US$ 1,113 /oz
US$ 1,038 /oz US$/oz 1,031 Focus on waste stripping continued in Q1
(+26% QoQ) & led to a reduction in ore tonnes
US$ 781 /oz
US$ 982 /oz
of -9%
US$ 846 /oz US$ 849 /oz
US$ 831 /oz
28.1koz 28.0koz Increase in gold production due to 23%
28.6koz 26.0koz 26.3koz improvement in plant feed grades
AISC /cash cost delta decreased to
Q1 2018 Q2 2018 Q3 2018 Q4 2 018 Q1 2019
US$200/oz in both Q1 2019
Q2 2019 Outlook:
Q1 Q2 Q3 Q4 Q1
Parameter Increase in TMM and ore tonnes expected to
2018 2018 2018 2018 2019
Ore Mined, kt 359 375 396 347 317 continue
Waste Mined, kt 4,677 5,312 5,237 6,445 8,120 Monthly TMM expected to peak at c. 4Mt in Q4
Strip Ratio, W:O 13.0 14.2 13.2 18.6 25.6 2019
Ore Processed, Kt 344 352 354 362 308
Increase in mining rate is expected to drive
Feed Grade, g/t 2.91 2.81 2.82 2.44 3.00 further improvements in unit costs –
Gold Sales, oz 28,098 28,564 27,997 26,014 26,323 productivity improvements result from
increased utilisation rates of equipment
AIM | TSX: ASO 16New Liberty Gold Mine
Operational Review
Total Tonnes Mined Ore Tonnes Mined and Grade
Waste Mined Ore Mined Strip Ratio Ore Mined Grade Mined (g/t)
9,000,000 30.0 450,000 3.50
Grade Mined (g/t)
Strip Ratio (Waste: Ore)
8,000,000 400,000 3.00
25.0
7,000,000 350,000
Tonnes Mined
Tonnes Mined
2.50
6,000,000 20.0 300,000
5,000,000 250,000 2.00
15.0
4,000,000 200,000 1.50
3,000,000 10.0 150,000
1.00
2,000,000 100,000
5.0 0.50
1,000,000 50,000
0 0.0 0 0.00
Q1 Q2 Q3 Q4 Q1 Q2 Q3 Q4 Q1 Q1 Q2 Q3 Q4 Q1 Q2 Q3 Q4 Q1
2017 2017 2017 2017 2018 2018 2018 2018 2019 2017 2017 2017 2017 2018 2018 2018 2018 2019
Plant Throughput and Recovery Gold Produced and Feed Grade
Processed Tonnes Recovery (%) Gold Recovered Feed Grade (g/t)
400,000 92% 30,000 3.5
Plant Throughput (Tonnes)
350,000 91% 25,000 3.0
Feed Grade (g/t)
Gold Produced
300,000 2.5
90%
Recovery (%))
20,000
250,000 2.0
89%
200,000 15,000
88% 1.5
150,000 10,000
1.0
87%
100,000
5,000 0.5
50,000 86%
0 0.0
0 85%
Q1 Q2 Q3 Q4 Q1 Q2 Q3 Q4 Q1
Q1 Q2 Q3 Q4 Q1 Q2 Q3 Q4 Q1
2017 2017 2017 2017 2018 2018 2018 2018 2019
2017 2017 2017 2017 2018 2018 2018 2018 2019
AIM | TSX: ASO 17Youga Gold Mine
Asset Overview
Burkina Faso
147,500 metres of diamond drilling in 2018 to increase Life of Mine
Multiple open-pit mining operation M&I Resources (inc. Reserves) 22.16Mt @ 1.67 g/t Au – 1.189Moz
Reserves 14.74Mt @ 1.72 g/t Au – 814.9koz
Acquired by Avesoro Resources in LOM Production 734koz
December 2017 Mining Cost US$1.77/tonne mined3
Processing Cost US$18.51/tonne processed3
1.19Moz M&I Mineral Resources including LOM AISC US$ 973/oz3
815koz of P&P Mineral Reserves Youga NPV US$ 142.6m4
Youga Process Plant
2018 gold production of 110,751 ounces
(-4% on FY2017)
Forecast 2019 production of 90 –
100koz at operating cash cost of
US$750 – US$800 and AISC of
US$950 – US$1,015 per ounce
Study to increase process plant
throughput on-going
3
As per NI 43-101 compliant Announcement dated 9 May 2019 and entitled “Avesoro Reports a 23% Increase
In Mineral Reserves at the Youga Gold Mine, Burkina Faso”.
4 5% discount rate and US$1,300/oz gold price
AIM | TSX: ASO 18Youga Gold Mine
Updated NI 43-101 Highlights
Updated NI 43-101 announced during May 2019
Mineral Reserves increased by 23% to 14.7Mt containing 814,900 ounces of gold
LOM extension to 2031 (+4 years), potential to increase Mineral Reserves further
2018 NI 43-101 Mineral Reserves 2019 NI 43-101 Mineral Reserves
Ouare
141koz NL Ndablama
Underground Open Pit
Ouare Youga
0.66Moz
403koz 0.81Moz 372koz
Balogo
91koz
Youga + 23% NL Open Pit
428koz
120,000 4.00
3.50
Recovered Gold (oz)
100,000 Balogo
Feed Grade (g/t)
40koz 3.00
80,000
2.50
60,000 2.00
1.50
40,000
1.00
20,000
0.50
- -
2019 2020 2021 2022 2023 2024 2025 2026 2027 2028 2029 2030 2031
2019 NI 43-101 2017 NI 43-101 2019 NI 43-101 Grade
AIM | TSX: ASO 19Youga Gold Mine
Life of Mine Financials
Physicals LOM Financials (US$)
Youga Revenue 954,285,501
Ore tonnes 6,166,901 Royalty 47,714,275
Waste tonnes 62,948,481 Opex 643,411,666
Strip 10.2 Upfront capex 10,750,000
Grade (g/t) 1.67 Sustaining capex 24,834,230
Pre tax cashflow1 227,575,329
Ouaré Post tax cashflow1 173,392,336
Ore tonnes 6,722,789
Waste tonnes 42,392,769 Assumptions
Strip 6.3 Gold price (US$) 1,300
Grade (g/t) 1.86 Tax rate 23%
Contingency 10%
Balogo
Ore tonnes 197,390 Costs/oz (US$)
Waste tonnes 11,542,899 C1 cash cost 876.5
Strip 58.48 C3 cash cost 941.5
Grade (g/t) 6.11 AISC 973.1
Processing NPV (US$m)
Milled tonnes 14,743,622 5.0% 142.7
Average grade (g/t) 1.72 7.5% 130.9
Recovered gold 734,066 10.0% 121.0
1
Based on US$1,300/oz Gold price
AIM | TSX: ASO 20Youga Gold Mine
Life of Mine Production Schedule
Ore Mined and Strip Ratio
3,000,000 20.0
2,500,000
Strip Ratio (W: O)
15.0
Ore Mined (t)
2,000,000
1,500,000 10.0
1,000,000
5.0
500,000
- -
2019 2020 2021 2022 2023 2024 2025 2026 2027 2028 2029 2030 2031
Youga Open Pit Balogo Open Pit Ouare Open Pit Youga Strip Ratio Ouare Strip Ratio
Gold Produced and Plant Feed Grade
120,000 4.0
Recovered Gold (oz)
3.5
100,000
Feed Grade (g/t)
3.0
80,000
2.5
60,000 2.0
1.5
40,000
1.0
20,000
0.5
- 0.0
2019 2020 2021 2022 2023 2024 2025 2026 2027 2028 2029 2030 2031
2019 NI 43-101 2017 NI 43-101 2019 NI 43-101 Grade
AIM | TSX: ASO 21Youga Gold Mine
Youga LOM Plan
LOM runs to 2031 with potential to extend via additional drilling
Mining temporarily pauses at Youga during 2021, with the mill continuing to process Balogo and
Ouaré ore
Development of Ouaré, commences in Q4 2019 with production commencing in Q2 2020 and
continuing through to early 2024
Production from the Youga open-pits recommence in Q1 2023 until early 2027
The Youga mill continues to process ROM ore from the Ouaré deposit and stockpile reclaim
until Q1 2031
AIM | TSX: ASO 22Youga Gold Mine
Q1 2019 Performance
Gold Sales & AISC
Gold Sales AISC Cash Cost
US$ 1,113 /oz US$ 1,069 /oz
US$ 1,156 /oz Ore tonnes mined increased in Q1 vs Q4 2018,
40.5koz
US$ 852 /oz whilst both mined and feed grade also
US$ 707 /oz US$ 1,017 /oz improved by 2% to 2.07g/t
US$ 958 /oz US$ 943 /oz
Unplanned ore dilution whilst mining the
US$ 616 /oz Gassoré pit; and
US$ 470 /oz 28.7koz
21.0koz 20.1koz 19.5koz Plant feed supplemented by existing low
Q1 2018 Q2 2018 Q3 2018 Q4 2 018 Q1 2019
grade ROM stockpiles
Q1 Q2 Q3 Q4 Q1 Q2 2019 Outlook:
Parameter
2018 2018 2018 2018 2019
Ore Mined, kt 233 221 233 282 292 Increase in gold production to be driven by a
Waste Mined, kt 2,635 3,930 3,909 3,998 4,472
reduction in mining dilution and therefore an
improvement in mined grade
Strip Ratio, W:O 11.3 17.8 16.8 14.2 15.3
Ore Processed, Kt 306 307 279 345 320 Higher gold production expected to improve
Feed Grade, g/t 4.53 3.44 2.44 2.04 2.07 overall US$/oz cost profile
Gold Sales, oz 40,455 28,722 20,977 20,172 19,487
AIM | TSX: ASO 23Youga Gold Mine
Operational Review
Total Tonnes Mined Ore Tonnes Mined and Grade
Waste Mined Ore Mined Strip Ratio Ore Mined - Youga Ore Mined - Balogo
6,000,000 20.0 Grade Mined - g/t - Youga Grade Mined - g/t - Balogo
18.0
Strip Ratio (Waste: Ore)
Grade Mined (g/t)
5,000,000 350,000 18.00
16.0 16.00
300,000
Tonnes Mined
14.0
Tonnes Mined
4,000,000 14.00
12.0 250,000
12.00
3,000,000 10.0 200,000 10.00
8.0 150,000 8.00
2,000,000 6.0 6.00
100,000
1,000,000 4.0 4.00
2.0 50,000 2.00
0 0.0 0 0.00
Q1 Q2 Q3 Q4 Q1 Q2 Q3 Q4 Q1 Q1 Q2 Q3 Q4 Q1 Q2 Q3 Q4 Q1
2017 2017 2017 2017 2018 2018 2018 2018 2019 2017 2017 2017 2017 2018 2018 2018 2018 2019
Plant Throughput and Recovery Gold Produced and Feed Grade
Plant Throughput (Tonnes)
Processed Tonnes Recovery (%) Gold Recovered Feed Grade (g/t)
400,000 92% 45,000 6.00
350,000 40,000
91% 5.00
Gold Produced 35,000
Feed Grade (g/t)
300,000
Recovery (%))
90% 30,000 4.00
250,000
25,000
200,000 89% 3.00
20,000
150,000 15,000 2.00
88%
100,000 10,000
87% 1.00
50,000 5,000
0 86% 0 0.00
Q1 Q2 Q3 Q4 Q1 Q2 Q3 Q4 Q1 Q1 Q2 Q3 Q4 Q1 Q2 Q3 Q4 Q1
2017 2017 2017 2017 2018 2018 2018 2018 2019 2017 2017 2017 2017 2018 2018 2018 2018 2019
AIM | TSX: ASO 24Avesoro Resources
2019 Outlook
Achieved gold production of 220koz in FY2018 (+186% YoY)
FY2019 Production Guidance:
Forecast gold production of 210 – 230koz
Operating cash cost of US$850 – US$910 per ounce sold
AISC of US$1,100 – US$1,190 per ounce sold
Forecast capital expenditure of US$45.1 million
Multi-mine Mineral Reserve inventory of 2.0Moz across two West African countries
Positioned for further growth through maximizing upside potential at operating mines
and accretive M&A strategy
AIM | TSX: ASO 25AIM | TSX: ASO
UK Office – Octagon Point, 5 Cheapside, St. Paul’s, London, EC2V 6AA, United Kingdom
Investor Relations - Tel: +44 (0) 20 3405 9160 | Email: nick.smith@avesoro.com
www.avesoro.comCorporate Overview (TSX, AIM)
Balance Sheet at March 31, 2019 (in millions) Shareholder Register Composition
Institutions
Cash US$9.3
21.49%
5.61% Private / Ret ail Investors
Debt1 US$138.8
72.90%
Capitalisation Summary at June 3, 2019 Avesoro Holdings and
Board of Directors &
Management
AIM / TSX Ticker ASO
Shares Outstanding 81,575,260 Major Institutional Shareholders
Warrants Outstanding 315,245 Ora Capital Lombard Odier
Options Outstanding 4,209,233 Canaccord Genuity Condire Investors
Shares Outstanding Fully Diluted 86,099,738 Ruffer Miton
Market Capitalisation US$100m Earth Resource Group South River Asset Mgmt
1.Face value, comprised of principle outstanding four facilities: Senior Facility Tranche A, Subordinated loan facility, Senior Facility Tranche B and an Unsecured & Subordinated loan
facility with Avesoro Jersey Ltd.
AIM | TSX: ASO 27You can also read