A modular design strategy considering sustainability and supplier selection - J-Stage
←
→
Page content transcription
If your browser does not render page correctly, please read the page content below
Bulletin of the JSME Vol.14, No.2, 2020
 Journal of Advanced Mechanical Design, Systems, and Manufacturing

 A modular design strategy
 considering sustainability and supplier selection
 Masato INOUE*, Shuho YAMADA*, Shogo MIYAJIMA*, Katsuhide ISHII*,
 Rina HASEBE*, Kazuhiro AOYAMA**, Tetsuo YAMADA*** and Stefan BRACKE****
 *Department of Mechanical Engineering Informatics, Meiji University
 1-1-1 Higashi-Mita, Tama-ku, Kawasaki, Kanagawa 214-8571, Japan
 E-mail: m_inoue@meiji.ac.jp
 **RACE: Research into Artifacts, Center for Engineering, School of Engineering, The University of Tokyo
 7-3-1 Hongo, Bunkyo-ku, Tokyo 113-8656, Japan
 ***Department of Informatics, The University of Electro-Communications (UEC Tokyo)
 1-5-1 Chofugaoka, Chofu-shi, Tokyo 182-8585, Japan
 ****Chair of Reliability Engineering and Risk Analytics, University of Wuppertal
 Gaußstraße 20, Wuppertal 42119, Germany

 Received: 4 July 2019; Revised: 3 January 2020; Accepted: 30 January 2020

 Abstract
 To utilize the residual value, which remains an idle asset and disposed product based on the circular economy
 package, the definition or clarification of such a value and the development of a scheme for such a reutilization
 is essential. In addition, to facilitate an efficient utilization of the residual value, a product or its components
 needs to be designed considering its future reuse, remanufacturing, and upgrading. When companies monitor
 product usage using the Internet of things, they can make proposals to users of appropriate lifecycle options
 such as reuse, remanufacturing, and upgrading and such proposals are conductive to customer retention for
 these companies. Therefore, an ideal situation is one in which the product is appropriately modularly designed
 and its components will be reused in an upward product or another product family or be recycled at the end of
 life. A designer needs to consider resource efficiency not only in the reuse stage but also in the production and
 procurement stages. In addition, a company that designs and manufactures products needs to strive for the
 simultaneous attainment of cooperate social responsibility, higher profits, and higher user satisfaction.
 Therefore, proper supplier selection is necessary because products currently consist of many components and
 modules manufactured by various companies. This study proposes a modular design and a strategic evaluation
 method based on the viewpoint of supply chain management considering sustainability and supplier selection
 simultaneously. In particular, the proposed method evaluates the designed modular strategy from the
 perspectives of cost, environmental load in production and transportation, quality, and procurement lead time.
 As an evaluation, the proposed indicator evaluates the efficiencies of the candidate suppliers. This study
 applied the proposed method to the design problem of a laptop module and determined the more appropriate
 suppliers with respect to each destination.

 Keywords: Modular design, Supply chain management, Early design phase, Decision-making support, Product
 architecture, Upgrade design

1. Introduction

 The attainment of sustainable consumption and production has been discussed as a global agenda. In Europe, for
example, the European Commission adopted the circular economy (CE) package in 2015, which aims to obtain
environmental and economic benefits by reusing or recycling the residual value that remains due to idle assets and
disposed products (European Commission, 2020). In Japan, the concept of global multi-value circulation has also been
discussed and proposed (Sustainability Design Institute, 2020). This concept integrates the production capacity of Asian

Paper No.19-00351
[DOI: 10.1299/jamdsm.2020jamdsm0023] © 2020 The Japan Society of Mechanical Engineers
 1
Inoue, Shuho Yamada, Miyajima, Ishii, Hasebe, Aoyama, Tetsuo Yamada and Bracke,
 Journal of Advanced Mechanical Design, Systems, and Manufacturing, Vol.14, No.2 (2020)

countries with the system boundary of the CE and aims to promote the creation of sustainable societies not only in
developed countries but also in developing countries.
 To utilize the residual value that remains in an idle asset or a disposed product, defining and clarifying this value
and developing a scheme to ensure reutilization are essential. In addition, the products and their components need to be
designed taking into consideration future reuse or remanufacturing to facilitate the efficient use of the residual value. A
schematic depiction of the ideal situation is presented in Fig. 1, in which a product exhibits an appropriate modular
design and its components are reused in new products and other product families or are recycled at the end of the
lifecycle of the original product. To adequately assess and optimize these processes, designers also need to consider the
resource efficiency not only during the reuse stage but also during the production and procurement stages. In addition,
product designers and manufacturers need to strive to simultaneously integrate social responsibility, achieve higher
profits, and provide higher user satisfaction.
 This study proposes a modular design strategy and its evaluation method from the perspective of supply chain
management (SCM). More specifically, the proposed method evaluates the strategy from the perspectives of economic
cost, environmental load, procurement lead time, and component quality. The proposed method also designs and
evaluates the product architecture from the perspective of sustainability, in contrast to traditional modular design
methods that focus on reductions in the development lead time or various costs. This study simultaneously applies the
proposed method to a laptop PC design and derives an appropriate modular strategy from the same viewpoints as the
proposed method. Finally, this paper discusses the availability and additional considerations of the proposed method
based on the result of the case study.

 Fig. 1 Ideal material flow of a modular product during its lifecycle.

2. Modular design method
2.1 Previous studies on modular design
 In this section, the paper discusses previous studies that have investigated modular design methods, including a
method that was formulated as a multi-objective optimization problem related to the product performance in a family of
products using the commonality of modules (Nelson et al., 2001), an optimization method for module combinations
focusing on product function and production cost (Fujita and Sakaguchi, 2002), and a study focusing on the
functionality of integrations between components via modularization (Oizumi et al., 2016).
 As an approach to achieve modularization, a design structure matrix (DSM) method is a renowned,
straightforward, and flexible modeling technique that can be used to design, develop, and manage complex systems
(Sosa et al., 2003; Eppinger and Browning, 2012). A DSM is created so that the interfaces between modules can be
reduced. A DSM analysis can achieve partitioning and relocation using various analytical methods in the case of
modularization (Hino, 2009). Using DSM clustering (Sarkar et al., 2013), the row and column elements of the DSM are
rearranged, where the elements with strong interactions are grouped, and modularization can be pursued. The sorting

[DOI: 10.1299/jamdsm.2020jamdsm0023] © 2020 The Japan Society of Mechanical Engineers
 2
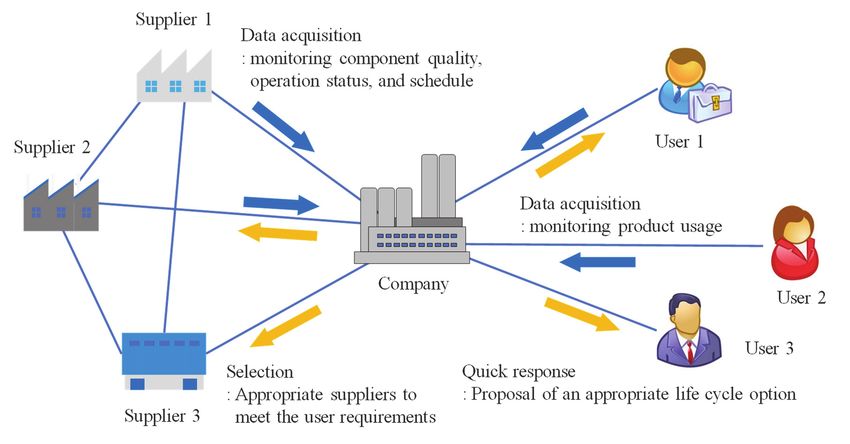
Inoue, Shuho Yamada, Miyajima, Ishii, Hasebe, Aoyama, Tetsuo Yamada and Bracke,
 Journal of Advanced Mechanical Design, Systems, and Manufacturing, Vol.14, No.2 (2020)

method is developed by consulting experts, using functions, or using unique algorithms such as the Newman method
and the p-median method. In particular, several methods that focus on the usage of functions have been proposed
(Tyson and Browning, 2015), whereas methods that simultaneously consider the environment and costs have rarely
been attempted.

2.2 New modular design strategy using Internet of Things
 Figure 2 shows a modular design strategy using the Internet of things (IoT). When the IoT can connect companies
to users and suppliers, companies can obtain data from users by monitoring the product usage and then forecast future
failures of the product and offer quick suggestions to users of appropriate lifecycle options, such as reuse,
remanufacturing, and upgrading. As a result, proposals of appropriate lifecycle options from companies to users are
conducive to customer retention for the companies due to after-sale services. In addition, companies can obtain data
from suppliers by monitoring the component quality, operation status, and schedule and then selecting the appropriate
suppliers to meet the user requirements.

 Fig. 2 New modular design strategy using IoT.

2.3 Supply chain management
 To resolve issues related to global warming, a low-carbon supply chain that can reduce the CO2 emissions is
necessary (Yoshizaki et al., 2016; Loo et al., 2018). Regardless of the components being considered, the environmental
load, personnel expenses, and transportation costs differ depending on the country of manufacture. In general, when the
components are produced in industrialized countries, the cost is higher and the environmental load is lower.
Conversely, when the components are produced in countries with emerging economies, the cost is lower and the
environmental load is higher (Kokubo et al., 2012; Horiguch et al., 2012). Therefore, a supplier selection method that
can achieve both low cost and a low environmental load is optimal. Urata et al. (2017) proposed a design method for
global supply chain networks including multiple Asian countries that balances both procurement and transportation
costs and material-based CO2 emissions to determine low-carbon suppliers and factory locations, while satisfying the
demand requirements.

2.4 Procedure for modular design
 As described in Section 2.1, there are several modular design methods that focus on functions; however, there are
very few methods that simultaneously consider both the environment and economics. Therefore, in this study, the
concept of SCM is applied to develop a modular design to consider the economic cost, environmental load,
procurement lead time, and component quality simultaneously. The component suppliers are evaluated, and indicators
are proposed to comprehensively evaluate the efficiency of the module strategy from the aforementioned viewpoints

[DOI: 10.1299/jamdsm.2020jamdsm0023] © 2020 The Japan Society of Mechanical Engineers
 23
Inoue, Shuho Yamada, Miyajima, Ishii, Hasebe, Aoyama, Tetsuo Yamada and Bracke, Journal of Advanced Mechanical Design, Systems, and Manufacturing, Vol.14, No.2 (2020) depending on the manner in which the decisions regarding the suppliers and module components are made when multiple suppliers are available for each component. Figure 3 depicts the design flow of the proposed method. For each component, a company selects suppliers from several candidates. For the components to be modularized via integration, the module production site is further set to an arbitrary global location. Finally, the processing site used to assemble all the modules and components is defined as the location where the product is completed. When different architectures, such as modular architecture and integral architecture (Inoue et al., 2011), are represented, the proposed method evaluates each architecture from the viewpoints of the economic cost, environmental load, procurement lead time, and component quality; then, our method further determines the module strategy by identifying the scenario having the highest score. Compilation / updating Company Input Output Database Input information Output information Supplier information Product information Results: Strategy Location Component structure Product architecture Exit port/airport Product architecture Score of supplier Distance between ports Cost : C Time of transport Supplier information Environmental load : E Candidate of suppliers Lead time : T Supply chain evaluation Quality : Q Component information Final process site Total evaluation: SCEI Evaluation equation Cost Environmental load Solver Lead time Quality Calculation of indicator Cost Environmental load Lead time Quality Total evaluation Fig. 3 Design flow to obtain the module strategy and supplier selection. 2.4.1 Evaluation of the economic cost To evaluate the economic cost, the total product cost C is defined as the sum of the costs associated with manufacturing, profit, and transportation of each component i expressed in Eq. (1). In Eq. (1), Cmanufacturing, i, Cprofit, i, and Ctransportation, i indicate the manufacturing cost, the supplier profit, and the transportation cost of each component i, respectively, and N is the number of components. The manufacturing cost of each component is the price of the components, which is determined by considering the material procurement and labor costs. While calculating the profits, the difference in labor costs varies depending on the component manufacturing location and can be expressed as the ratio of the gross domestic product (GDP) per capita of the country of manufacture (GDPmanufacturing) to the GDP per capita of the base country (GDPbase). = , = ( , + , + , ) (1) The supplier profit for each component is defined in Eq. (2) by multiplying the GDP ratio by the profit ratio (Pratio) and the manufacturing cost of each component (Cmanufacturing, i) to be modularized. [DOI: 10.1299/jamdsm.2020jamdsm0023] © 2020 The Japan Society of Mechanical Engineers 24
Inoue, Shuho Yamada, Miyajima, Ishii, Hasebe, Aoyama, Tetsuo Yamada and Bracke,
 Journal of Advanced Mechanical Design, Systems, and Manufacturing, Vol.14, No.2 (2020)

 , = , × × (2)
 100 −

 The transportation cost of each component is the cost incurred from the time at which the components are shipped
to the time at which the components arrive at the destination; these are essentially the fees charged by the shipping
company. In general, the transportation price is observed to vary depending on the transportation distance and means of
transportation. Transportation costs are calculated using Eqs. (3)–(6). The total transportation cost of each component is
indicated by the sum of the transportation costs from the site that manufactures the components to the final processing
site by considering the truck transportation cost of each component (Ctruck, i), the container shipping cost of each
component (Cshipping, i), and the air transportation cost of each component (Cair, i). Here, mi (kg) is defined as the mass of
each component to be transported. Cunit (Yen/kg) in the trucking cost part of Eq. (4) represents the freight rate of the
package, as defined by 69. The transportation cost using a container ship is presented in Eq. (5), whereas the air
transportation cost in Eq. (6) can be formulated by confirming the dependency relationship between the transport
distance and the mass using the actual tariff.
 , = , + , + , (3)
 , = × (4)

 , = (0.0016 + 120) + (0.4 + 1450) (5)

 10,269 < 20
 513 20 ≤ < 45
 , = (6)
 399 45 ≤ < 100
 342 ≥ 100

2.4.2 Evaluation of the environmental load
 To consider environmental impact of industrial product design and manufacturing, different officially accepted
sustainability indicators were investigated. The National Institute for Environmental Studies (NIES) had reviewed the
sustainable development indicators, which were developed by national governments and international organizations,
and created a database of the type of indicators [NIES, 2020]. Using the database, sustainability indicators such as CO2
emissions, amount of recycled and reused wastes, and use of renewable energy sources that are both directly and
indirectly related to the industrial product design and manufacturing were identified and then categorized into three
groups considering ecological, economical, and social aspects (Inoue et al., 2012). In this study, CO2 emissions was
chosen to evaluate the environmental load for further consideration. The converted CO2 emissions Ecomponent, i of each
component i associated with manufacturing and transportation are used as expressed in Eq. (7). In Eq. (7), Emanufacturing, i
and Etransportation, i indicate the converted CO2 emissions of manufacturing and transportation, respectively, for each
component i. As presented in Eq. (8), the converted manufacturing CO2 emissions for each component are calculated
by multiplying the converted manufacturing CO2 emissions for each component Ebase, i, the amount of production for
each component Vi, and the proportion of the thermal power generation ratio in the country of manufacture Pmanufacture to
the thermal power generation ratio in the base country Pbase.
 As shown in Eq. (9), the converted CO2 emissions for the transportation of each component Etransportation, i (kg-CO2e)
are calculated by multiplying the converted CO2 emission intensity of each transportation leg k (k = 1; truck: 0.1635
kg-CO2e/tkm, k = 2; container ship: 0.033 kg-CO2e/tkm, and k = 3; airplane: 1.005 kg-CO2e/tkm) (ek), the transport
distance of each component Li (km), the mass of each component to be transported mi (kg), and the amount of
production for each component Vi (Ministry of Economy, Trade and Industry Japan, 2012).

 = , = ( , + , ) (7)

 , = , × × (8)

 , = × × × (9)

[DOI: 10.1299/jamdsm.2020jamdsm0023] © 2020 The Japan Society of Mechanical Engineers
 25
Inoue, Shuho Yamada, Miyajima, Ishii, Hasebe, Aoyama, Tetsuo Yamada and Bracke,
 Journal of Advanced Mechanical Design, Systems, and Manufacturing, Vol.14, No.2 (2020)

2.4.3 Evaluation of the procurement lead time
 The procurement lead time T indicates the number of days between the time when an order is placed for a certain
item by a buyer to the time of delivery of the item. To simplify this comparison, the lead time for each form of
transportation (truck, container shipping, and air transportation) is defined and the maximum value of the number of
days for each type of transportation is calculated as represented in Eq. (10). With respect to truck and air transportation,
this study assumes that the lead time is one day when used once. The lead time of each component i due to the
transportation of the shipping container (Tshipping, i) (day) is assumed to be dependent on the transportation distance, as
defined in Eq. (11). To obtain the solution of Eq. (11), the value obtained by rounding down to the decimal point is
defined as the lead time.
 = max , , , , , (10)
 , = 0.0015 × (11)

2.4.4 Evaluation of the component quality
 A five-point scale is used to evaluate the differences in quality and manufacturing technology depending on the
manufacturing site of the supplier, with one being the lowest quality and five being the highest quality. It is assumed
that the quality can be judged using the data handled by a company, such as the failure and/or yield rate, and that the
total product quality Q is defined as the average of the quality scores of each component (Qcomponent, i) as presented in
Eq. (12).
 1
 = , (12)

2.4.5 Supply chain evaluation index
 The supply chain evaluation indicator (SCEI) defined in Eq. (13) is calculated using the evaluation variables that
were derived in Sections 2.4.1–2.4.4. As the value of SCEI increases, the modular strategy is considered to become
increasingly appropriate. More specifically, such a case with high SCEI indicates high quality, low cost, low
environmental load, and short delivery time and this determines the best modular strategy. Using the SCEI value, a
designer can search for a combination of clusters that can ensure appropriate modularization when considering multiple
suppliers.

 = (13)
 × ×

3. Case study: Supply chain strategy for laptop components
3.1 Setting the design problem
 This study demonstrates an application of the proposed method to compiling and assembling laptop components. In
particular, this case study focuses on the modularization of three laptop components: the CPU, motherboard, and
memory. By applying the proposed method to these three components, appropriate module suppliers are defined in
terms of SCM. A laptop was selected to perform this study because each component is standardized and because
individual modules are separately purchased from multiple manufacturers, which makes it easy to obtain information
about the pricing as well as the manufacturing location under realistic conditions. In actual laptop manufacturing, more
than three components are used. However, these components are assembled as independent modules from the
viewpoint of maintainability or are integrated to form a module from the viewpoint of appearance and miniaturization.
Therefore, because modularized products are mixed, a sustainable modular strategy can be validated using a
three-component evaluation scenario.
 This case study assumes that the target laptop is a mobile laptop with a 13.3-inch LCD screen and a weight of 1.6
kg. It is further assumed that production volume of each component is 100 (Vi = 100). Table 1 presents the component
information of the case study laptop. The cost of each component was determined by considering the actual selling
prices, and the masses of each component were estimated by disassembling and weighing the components of an actual
laptop, even though the change in weight due to the integration of the components was not considered. For each
component, Table 2 shows the locations of the candidate suppliers and the final processing site at which all the

[DOI: 10.1299/jamdsm.2020jamdsm0023] © 2020 The Japan Society of Mechanical Engineers
 26
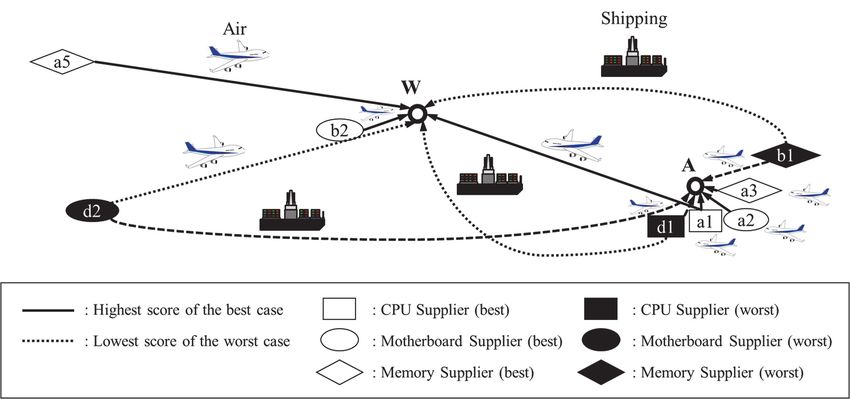
Inoue, Shuho Yamada, Miyajima, Ishii, Hasebe, Aoyama, Tetsuo Yamada and Bracke,
 Journal of Advanced Mechanical Design, Systems, and Manufacturing, Vol.14, No.2 (2020)

components are assembled. The capital letters represent the region, e.g., A = Asia and W = the west including Europe
and the United States, whereas the lower case letters represent the quality level of the supplier, Q, e.g., a = 5, b = 4, c =
3, and d = 2. Major companies that actually manufacture each component were researched and selected by identifying
the country in which their respective production factories are located. The final processing site was further chosen
using Table 2: Asia and the west were used to assemble all the components.

 Table 1 Information concerning each component.
 Component Mass (g) Cost (Yen)
 CPU 7 18,000
 Motherboard 100 10,000
 Memory 15 8,000

 Table 2 The location and quality of the suppliers of each laptop component.

 Components Supplier candidate (its quality)

 CPU A-a1 (Q: 5) A-d1 (Q: 2) W-a4 (Q: 5) –

 MB A-a2 (Q: 5) A-c1 (Q: 3) W-b2 (Q: 4) W-d2 (Q: 2)

 Memory A-a3 (Q: 5) A-b1 (Q: 4) W-a5 (Q: 5) –

 Final processing site A W

3.2 Results and Discussion
 For each of the two final processing sites, Asia (A) and the west including Europe and the United States (W), each
evaluation value was obtained using the proposed method. Tables 3 and 4 show the results for the suppliers used in
these final processing sites. In Tables 3 and 4, the supplier column provides the supplier and transportation means.
Transport by container shipping includes truck transportation from the supplier’s factory to the nearest port and
container vessel transport from that port to the port nearest to the final processing site. Transport by airplane includes
truck transportation from the supplier’s factory to the nearest airport and transportation from that airport to the airport
nearest to the final processing site.
 The supplier selections with the highest and lowest SCEI value are presented in Tables 3 and 4. The highest score
of the best case is well balanced in all perspectives including the economic cost, environment load, lead time, and
component quality. For example, Tables 3 in the case of Asia (A) as the final processing site shows that the best case
has a high score for the lead time and quality because the nearest and highest quality suppliers are selected, as shown in
Fig. 4, whereas the evaluations of the cost and environmental load are low due air transportation. Conversely,
container-shipping transportation has a long lead time but has the highest score with respect to the cost and
environmental load. Therefore, the second highest score includes container-shipping transportation.
 Table 4, in the case of Europe and the United States (W) as the final processing site, shows that the best case is well
balanced with respect to the cost and environmental load. A CPU supplier in Asia was selected even though the final
processing site is in Europe, as shown in Fig. 4, because the selected supplier has a high quality and a low thermal
power generation ratio in the country of manufacture.

[DOI: 10.1299/jamdsm.2020jamdsm0023] © 2020 The Japan Society of Mechanical Engineers
 27
Inoue, Shuho Yamada, Miyajima, Ishii, Hasebe, Aoyama, Tetsuo Yamada and Bracke,
 Journal of Advanced Mechanical Design, Systems, and Manufacturing, Vol.14, No.2 (2020)

 Table 3 Evaluation results for the suppliers (final processing site: Asia (A)).

 Suppliers (transportation means) C E T SCEI
 Q
 CPU Motherboard Memory (mil. Yen) (kg-CO2e) (hours) (×1014)
 High evaluation (top 3) values, final processing site: Asia (A)
 A-a1 A-a2 A-a3
 1 3.632 1927.5 25 5.00 2857.11
 (air) (air) (air)
 A-a1 W-b2 A-a3
 2 3.614 1458.5 34 4.67 2603.68
 (shipping) (air) (shipping)
 A-a1 A-a2 A-b1
 3 3.632 1899.7 26 4.67 2601.62
 (air) (air) (air)
 Lowest evaluation, final processing site: Asia (A)
 A-d1 W-d2 A-b1
 1 3.628 1896.8 329 2.67 117.780
 (air) (shipping) (air)

 Table 4 Evaluation result for the suppliers (final processing site: west including Europe and the United States (W)).

 Suppliers (transportation means) C E T SCEI
 Q
 CPU Motherboard Memory (mil. Yen) (kg-CO2e) (hours) (×1014)
 High evaluation (top 3) values, final processing site: west including Europe and the United States (W)
 A-a1 W-b2 W-a5
 1 3.965 1365.8 35 4.67 2462.21
 (air) (air) (air)
 A-a1 W-b2 A-a3
 2 3.880 1397.4 35 4.67 2459.26
 (air) (air) (air)
 W-a4 W-b2 W-a5
 3 4.156 1353.0 34 4.67 2440.76
 (air) (air) (air)
 Lowest evaluation, final processing site: west including Europe and the United States (W)
 A-d1 W-d2 A-b1
 1 3.779 1990.3 491 2.67 72.2169
 (shipping) (shipping) (shipping)

 Fig. 4 Best and worst case evaluation results for the suppliers (final processing sites: Asia (A) and the west (W)).

[DOI: 10.1299/jamdsm.2020jamdsm0023] © 2020 The Japan Society of Mechanical Engineers
 28
Inoue, Shuho Yamada, Miyajima, Ishii, Hasebe, Aoyama, Tetsuo Yamada and Bracke,
 Journal of Advanced Mechanical Design, Systems, and Manufacturing, Vol.14, No.2 (2020)

4. Conclusions

 This study proposed a modular design strategy and its evaluation method based on the concept of SCM to promote
the formation of sustainable societies. The proposed method includes an evaluation index that evaluates the modular
architecture and supply chain based on four perspectives, that is, the economic cost, environmental load in
manufacturing and transportation, procurement lead time, and component quality. The proposed index, referred to as
SCEI, evaluates the design of the modular strategy according to the four aforementioned perspectives. Finally, this
study applied the proposed method and index to the design problem of the module composition of a laptop and derived
the necessary supplier information with respect to each destination, i.e., Asia and the west including Europe and the
United States.

Acknowledgments

 This research was partially supported by the Japan Society for the Promotion of Science (JSPS), KAKENHI,
Grant-in-Aid for Scientific Research (C), 17K01273 and Grant-in-Aid for Scientific Research (A), 18H03824.

References

Browning, T. R., Design structure matrix extensions and innovations: a survey and new opportunities, IEEE
 Transactions on Engineering Management, Vol. 63, No. 1 (2016), pp. 27–52.
Eppinger, S. D. and Browning, T. R., Design Structure Matrix Methods and Applications (2012), MIT Press.
European Commission, Closing the loop: Commission delivers on Circular Economy Action Plan (online), available
 from < http://europa.eu/rapid/press-release_IP-19-1480_en.htm>, (accessed on 1 January, 2020).
Fujita, K. and Sakaguchi, H., Optimization methodologies for product variety design (2nd report, optimization method
 for module commonalization), Transactions of the Japan Society of Mechanical Engineers, Series C, Vol.68,
 No.666 (2002), pp.683–691 (in Japanese).
Hino, S., Practical Modular Design (2009), Nikkei BP (in Japanese).
Horiguchi, K., Tsujimoto, H., Yamaguchi, H. and Itsubo, N., Development of greenhouse gases emission intensity in
 Eastern Asia using Asian International input-output table, Proceedings of the 7th Meeting of the Institute of Life
 Cycle Assessment (2012), pp.236–239.
Inoue, M., Mogi, R., Nahm, Y-E. and Ishikawa, H., Design Support for "Suriawase": Japanese Way for Negotiation
 among Several Teams, Improving Complex Systems Today (2011), pp. 385-392, Springer-Verlag.
Inoue, M., Lindow, K., Stark, R., Tanaka, K., Nahm, Y-E. and Ishikawa, H., Decision-making support for sustainable
 product creation, Advanced Engineering Informatics, Vol. 26, Issue 4 (2012), pp. 782-792.
Kokubu, K., Itsubo, N., Nakashima, M. and Yamada, T., Constructing low-carbon supply chain in Asia and the role of
 accounting, Kaikei (Accounting), Vol.182, No.1 (2012), pp.82–97 (in Japanese).
Loo, H. S., Chew, B. C. and Hamid, S. R., Exploring the factors and strategies in implementation of sustainable land
 transport system in Ayer Keroh, Melaka”, Journal of Advanced Manufacturing Technology, Vol. 12, No. 1 (2018),
 pp. 159–174.
Ministry of Economy, Trade and Industry Japan, Carbon footprint of products system trial project CO2 reduced quantity
 common basic unit database ver. 4.01 (domestic data) (2012) (in Japanese).
National Institute for Environmental Studies (NIES), Sustainable Development Indicators Database (online), available
 from < http://www.nies.go.jp/sdi-db/search_e.php >, (accessed on 1 January, 2020).
Nelson, S. A., Parkinson, M. B. and Papalambros, P. Y., Multicriteria optimization in product platform design, Journal
 of Mechanical Design, Vol. 123, No. 2 (2001), pp. 119–204.
Oizumi, K., Aruga, K. and Aoyama, K., Module commonization in product family incorporating fine-tune
 improvement, Transactions of the JSME (in Japanese), Vol. 82, No. 843 (2016), DOI:
 10.1299/transjsme.16-00071.
Sarkar, S., Dong, A., Henderson, J.A. and Robinson, P.A., Spectral characterization of hierarchical modularity in
 product architectures, Journal of Mechanical Design, Vol. 136, No. 1 (2013), DOI: 10.1115/1.4025490.

[DOI: 10.1299/jamdsm.2020jamdsm0023] © 2020 The Japan Society of Mechanical Engineers
 29
Inoue, Shuho Yamada, Miyajima, Ishii, Hasebe, Aoyama, Tetsuo Yamada and Bracke,
 Journal of Advanced Mechanical Design, Systems, and Manufacturing, Vol.14, No.2 (2020)

Sosa, M. E., Eppinger, S. D. and Rowles, C. M., Identifying modular and integrative systems and their impact on
 design team interactions, Journal of Mechanical Design, Vol. 125 (2003), pp. 240–252.
Sustainability Design Institute, Global Multi Value Circulation (in Japanese, online), available from <
 http://susdi.org/wp/mvc/entrance/>, (accessed on 1 January, 2020).
Urata, T., Yamada, T., Itsubo, N. and Inoue, M., Global supply chain network design and Asian analysis with
 material-based carbon emissions and tax, Computers & Industrial Engineering, Vol. 113 (2017), pp. 779–792.
Yoshizaki, Y., Yamada, T., Itsubo, N. and Inoue, M., Material based low-carbon and economic supplier selection with
 estimation of GHG emissions and affordable cost increment for parts production among multiple Asian countries,
 Journal of Japan Industrial Management Association, Vol. 66 (2016), pp. 435–442.

[DOI: 10.1299/jamdsm.2020jamdsm0023] © 2020 The Japan Society of Mechanical Engineers
 10
 2
You can also read