Regulation of Power Sector in Singapore: Development and Current Practices
←
→
Page content transcription
If your browser does not render page correctly, please read the page content below
Regulation of Power Sector in Singapore:
  Development and Current Practices

                  Youngho Chang

                 School of Business
        Singapore University of Social Sciences

                   13 December 2017

                    The 11th Capacity Building for
           Officers of Electricity Regulatory Commissions

                           13 – 15 December 2017
                 Holiday Inn Orchard City Centre, Singapore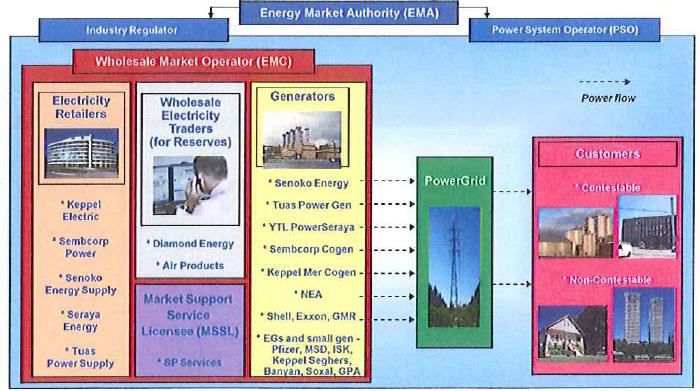
World at Night from Satellite

                                2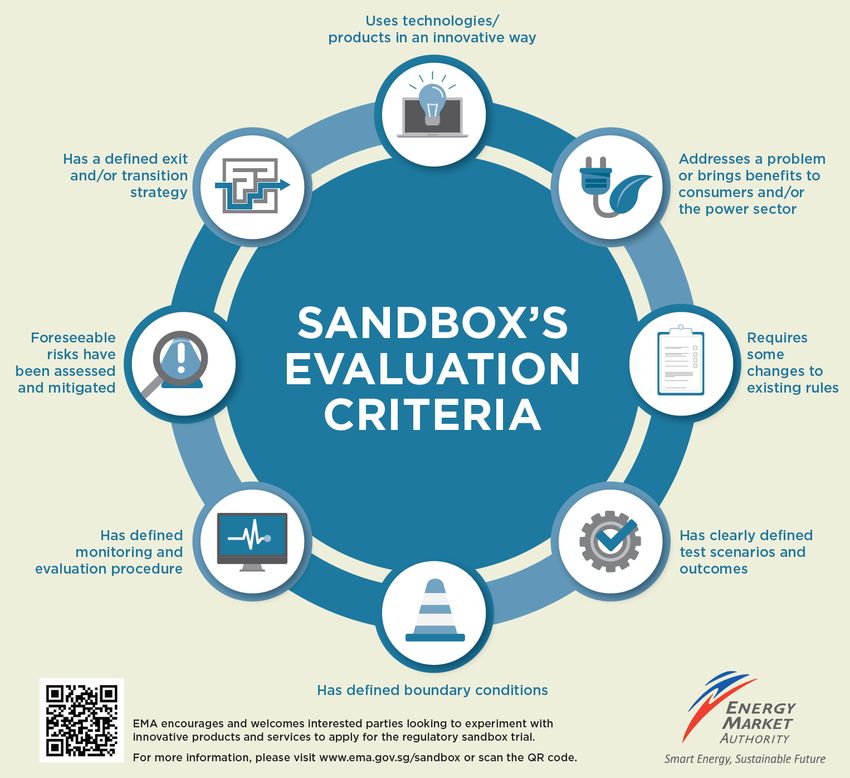
Agenda
• Descriptive statistics on electricity
• Why regulate the power sector
   – Natural monopoly and social losses
   – Social optimum in a natural monopoly market
   – Rate of return regulation
• Models for restructuring the electricity sector
• Regulation of the power sector in Singapore
   – Milestones, regulatory framework, industry structure and players
   – Market power, measures and tests
   – Vesting contracts
       • Game-theoretic approach based on the Cournot Model
       • Controlling market power and effectiveness

• Regulatory Sandbox
• Open Electricity Market
                                                                        3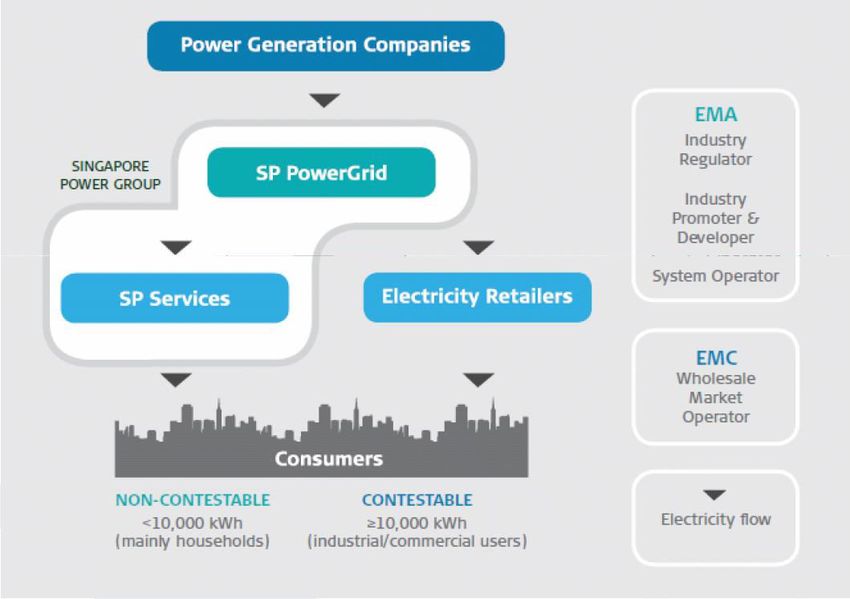
Electricity Consumption per Capita (kWh) in 2009
14000

12000

10000

 8000

 6000

 4000

 2000

    0

        Source: World Bank (2012)                      4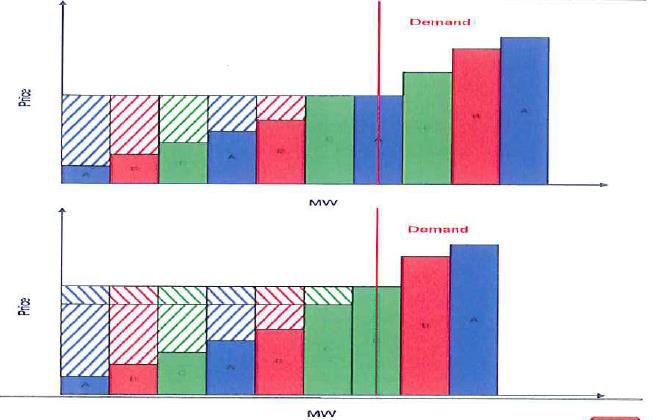
Electricity Consumption per Capita
             by Region in 2009 (kWh)
                Region          Consumption
Arab World                        2,154.8
East Asia and Pacific             2,797.4
Euro Area                         6,588.7
European Union                    6,063.6
Latin America and Caribbean       1,901.2
Middle East and North Africa      2,445.2
North America                     13,167.1
OECD                              7.981.8
South Asia                         516.9
Sub Saharan Africa                 517.4
World                             2,806.9

Source: World Bank (2012)                     5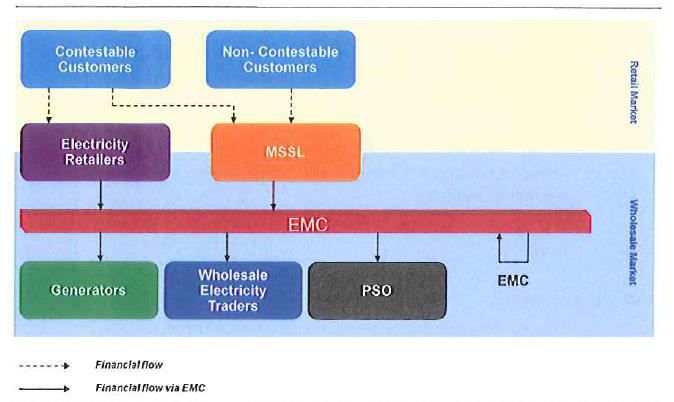
World Population Without Electricity
                   (Millions of People)
             Rural     Urban
S.
America          38          7
North
Africa-
Middle
East             30         17
Sub-
Sahara
Africa         438        109
S. Asia        580        126
S.E. Asia      182          41
                                       Worldwide 1.3 billion continue to live without access to electricity.
Total        1,268        300          This is equivalent to 18% of the global population;
                                       22% of those living in developing countries (IEA, 2014)
 Source: World Energy Outlook 2006 (IEA)                                                                 6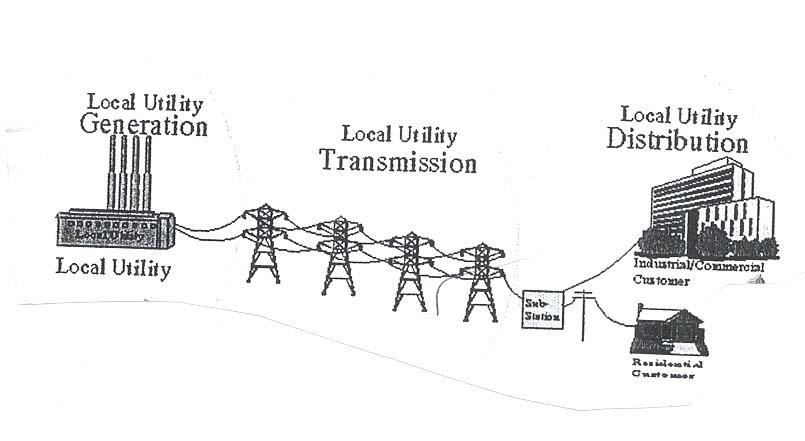
Why Does Economics Concern
Power Supply?
• Motivations
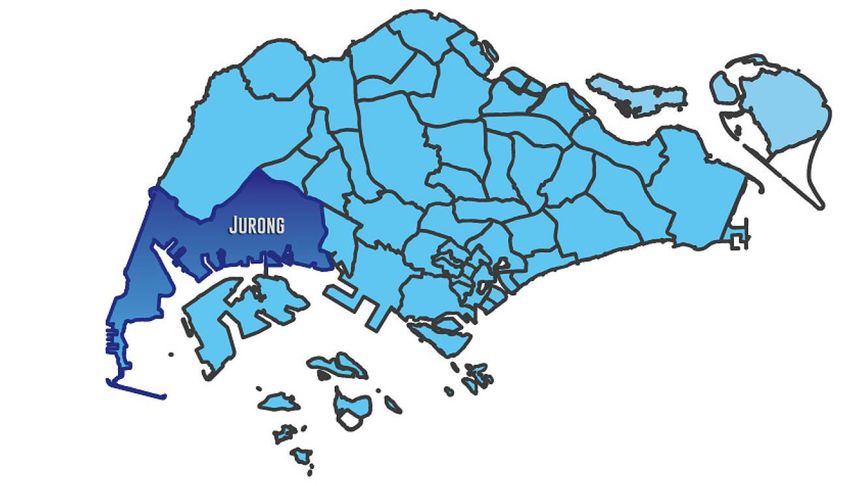
– Cost structure is rather unique
– Continuity requirement in power supply
– Efficiency
• Generation technologies and cost structures
– Long-Run Marginal Cost (LRMC)
• Fixed and variable costs
– Short-Run Marginal Cost (SRMC)
• Variable costs or avoidable costs
7Various Cost Structures of Firms TC = FC + VC(Q) 8
Electricity Generation, Transmission and
   Distribution: A Schematic Diagram

                                           9
Inverse Demand and Cost Curves
in a Decreasing Cost Industry
10Monopoly Production, Price and Profit
Objective: Maximize Profits
P = 75 – 4Q
TC = 19Q – 0.25Q2
ATC = 19 – 0.25Q
MC = 19 – 0.5Q
TR = P*Q = 75Q – 4Q2
MR = 75 – 8Q
Profit (πm) = (Pm – ACm)*Qm
11Social Losses from Monopoly: Illustration
12Social Optimum in a Natural Monopoly Market
Objective: Maximize Social Welfare
Social Optimum: P(Q) – MC(Q) = 0
13Government Policy for a Natural Monopoly
• Rate of Return Regulation
– The utility is allowed to earn a normal rate of return on
their capital stock or their rate base (RB)
– The accounting equation
n
PQ
i 1
i i expenses s( RB )
where Pi the price of the i - th service class
Qi the quantity of the i - th service class
n the number of service classes
s the allowable of " fair" rate of return
RB the rate base of the regulated firm' s investment
14Merit Order by Marginal Running Cost
15Generating Costs
D'
D
16Structures of Electricity Market
• Under regulation
– Vertically integrated, mostly government owned,
natural monopoly
– Instruments for regulation
• Price and quantity
• Under deregulation
– Separation of industry by ownership
– Horizontally unbundled
• Full competition in generation and wholesale/retail
• Still monopoly in transmission and distribution (T&D)
• Motivations for unbundling?
17In a Deregulated Electricity Market
• Market becomes competitive
– Non-existence (or little abuse) of market power
– Easy entry and exit of players
– Efficiency of allocation and lower and/or stable prices
• Market functions properly
– Informed decisions
– Allocation of risk
– Transactions at minimal cost and lower production costs
• Market leads close to marginal-cost pricing
– Prices would be close to the marginal cost under workable
competition and a reasonably well-functioning market
environment
• What do we expect?
– Right and Stable Prices
– Competition and Reliability
18Models for the Electricity Sector
• Model 1
– No competition, vertically integrated, publicly or privately owned
• Model 2
– Model 1 but with competition in generation. A single buyer (a
distribution company) may buy from a number of different
producers
• Model 3
– Model 2 but with common or contract carriage of high voltage
transmission lines offered to all wholesale sellers and buyers
• Model 4
– Model 3 but retail customers also choose their suppliers in full
retail competition
194 Electricity Restructuring Models – Model 1
• Hunt and Shuttleworth (1996) – 4 models
• depend on competition at each stage
• Model 1: no competition - vertical
integration Local Distribution
•
20Electricity Restructuring Models – Model 2
• Model 2: competition generation
(gencos)
•
21Electricity Restructuring Models – Model 3
• Model 3: distribution companies (distcos)
• own the distribution wires
• distcos and large buyers choose their
supplier
• competition in generation and wholesale
open access
wholesale market
224 Electricity Restructuring Models – Model 4
• Model 4: all customers choose suppliers
• full retail competition open access
•
23Model 4 is the Most Economically Efficient
• If there are
– A well-established electricity retailing system
– Mature market institutions
– Constant vigilance against market power
– Appropriate methods of dispatch
24Electricity Prices and Taxes, $/kWh, 2011
Chile U.K. New Norway Sweden U.S
Zealand
Price Price Price Price Price Price
(Tax) (Tax) (Tax) (Tax) (Tax) (Tax)
Industrial 0.18 0.12 0.06 0.04 0.08 0.07
(N/A) (0.00) (N/A) (0.01) (0.00) (N/A)
Households 0.25 0.19 0.18 0.10 0.18 0.12
(0.04) (0.01) (0.02) (0.03) (0.05) (N/A)
Observations:
25The Electricity Industry Milestones
1995 Corporatisation of PUB’s gas and electricity undertakings, Oct 1995
1998
Singapore Electricity Pool commenced operation, Apr 1998
1999
2000
Government decision on further deregulation, Mar 2000
2001 Energy Market Authority formed, Apr 2001
2002
2003 Commencement of National Electricity Market of Singapore, Jan 2003
Commencement of Phase 1 Retail Market Liberalisation, Jun 2003
Commencement of Phase 2 Retail Market Liberalisation, Dec 2003
2004
Vesting Contract & Interruptible Load scheme introduced, Jan 2004
2008
Completion of Temasek’s divestment of the 3 gencos, Dec 2008
2009
2010
2011
Contestability to all consumers (being studied)
26
Source: EMA (2012)The Electricity Industry Milestones (Cont’d)
• June 2011
– Electric Vehicle (EV) test-bed for the testability of EV prototypes and
technologies was launched
• October 2011
– The Singapore Energy Statistics report was launched
• March 2012
– An industry-led Power Manpower taskforce was formed
• May 2013
– The LNG terminal received its first commercial cargo and started
commercial operations
• October 2013
– A micro-grid incorporating solar photovoltaic technology was launched
– Demand response programme
• February 2014
– The official opening of the LNG Terminal
27The Electricity Industry Milestones (Cont’d)
• April 2015
– Electricity Futures Market
• October 2017
– Launch of Regulatory Sandbox (for energy sector innovations)
• April 2018
– Open Electricity Market in Jurong (Soft Launch)
28Schematic Diagram of Market Structure
Energy Market Company
Market Operator
Wholesale Electricity Market
Electricity Spot
Market Retailers Consumer
Gencos* s
Spinning
Reserve Market
Market Support
System
Bilateral Contracts
* Generation Companies
29
Source: EMAPolicies and Regulations
• Goals
– To ensure a reliable supply of electricity to consumers
at competitive prices
• Reliability
• Reasonable (or competitive) price
• Action
– Forward-looking or proactive regulation
• New policies reflecting the latest environment of the industry
• Regular and timely update or change of regulation
• Example: vesting contracts
30Policies and Regulations: Scope
• Electricity Legislation and Regulations
• Codes of Practice
– Enforcement Actions
• Market Rules
• Performance Standards
• Exemption Orders
• Agreements
• Electricity Licences
• Electricity Licensed Workers/Installation Licences
• Policy Papers
• Vesting Contracts
31Electricity Legislation and Regulations
• The Energy Market Authority of Singapore Act (Chapter
92B)
• The Electricity Act (Chapter 89A)
32Regulatory Framework
EMA Act Electricity Act
EMA
Key Features
•Authorized activities
•Separation of contestable and non-
contestable sectors
•Powers to request for information Licences
•Preparation for emergencies and
security arrangements
•Licence fees
•Powers to audit
Licensees
Electricity Market Codes of Practice Performance
Rules • Transmission Code standards
• Metering Code
• Market Support
Services Code
• Regulated Supply
MSCP Services Code
RCP
(Market Surveillance and • Code of Conduct for
(Rules Change Panel)
Compliance Panel)
Retail Electricity
Licences
33
Source: EMA (2012)Electricity Industry Structure
Non-Contestable Sector Contestable Sector
34
Source: EMA (2012)Codes of Practice
• Five Codes of Practices
– Market Support Services Code
– Metering Code
– Code of Conduct for Retail Electricity Licensees
– Transmission Code
– Regulated Supply Service Code
• Two enforcement actions
– Red Dot Power Pte Ltd’s contravention
– PacificLight Energy Pte Ltd’s contravention
35Market Rules
• Energy Market Company (EMC), the market operator or
company, administers the Market Rules
• The Rules Change Panel (RCP) reviews all proposed
modifications to the Market Rules
36Performance Standards: SP PowerAssets Ltd.,
the Transmission Licensee
Service Service Indicator Service Performance
Dimension Standard Target (%)
Availability of Minimum advance notice for planned interruption of electricity 7 c.d 95
Supply supply
Reliability of Number of power failure incidents*caused by failure of, 0 100
Supply damage to, or operation of Licensee’s equipment or cables
Restoration of Time taken to restore electricity supply for each power failure 3 hours 100
Supply due to failure of, damage to, or operation of Licensee’s 2 hours 90
equipment or cables rated at 22kV or above
Quality of Supply Time taken to rectify voltage complaint or limit violation 2 c.d. 95
Time taken to correct a voltage complaint that requires 6 months 99
network reinforcement
Number of voltage dip incidents*due to failure of, damage to, 0 100
or operation of Licensee’s equipment or cables
Providing Supply Time taken to implement electrification scheme requiring new 10 weeks 90
substation after take-over of substation (up to 22kV)
Time taken to implement service connection requiring cable 6 weeks 90
installation work, after premises to be supplied with electricity
is ready to receive cable
Customer Contact Time taken to reply to a written complaint 7 w.d. 95
Metering Services Time taken to attend to meter problem at site upon notification 8 c.d. 95
Notes: * only incidents where the Licensee is determined by the Authority to be at fault will be counted
c.d. is calendar days; w.d. is working days 37Performance Standards: SP Services Ltd.
the Marker Support Services Licensee
Service Service Indicator Service Performance
Dimension Standard Target (%)
Providing Time taken to process application for electricity supply and reply to 14 c.d. 85
Supply applicant
Lead time taken to inspect large electrical installation (supply capacity 7 w.d. 90
greater than 45kVA) and turn-on electricity supply upon request
Lead time taken to test small electrical installation (supply capacity less 10 c.d. 90
than or equal to 450kVA) and turn-on electricity supply upon request
Time taken to inspect pre-tested electrical installation and turn-on 3 w.d. 90
electricity supply upon request after opening of account
Waiting time at site for appointment to turn on or cut-off electricity supply 1.5 hours 90
Customer Time taken to reply to a written enquiry or complaint 7 w.d. 95
Contact
Queuing time at customer service counter (enquires and opening/closing 20 90
of accounts) minutes
Time taken by customer service officer to pick up telephone call 30 90
seconds
Metering Time taken to attend to meter disputes at site notification 8 w.d. 95
Service
Time taken to attend (make appointment, reply) to meter reading issues 5 w.d. 95
upon notification
Time interval between successive reading of billing meter(s) 2 monthly 95
Notes: c.d. is calendar days; w.d. is working days
38Exemption Orders
• The EMA may exempt any person or class of persons
from complying with the licensing requirement
39Agreements
• Agreements among various entities participating in the
Singapore electricity market
– Market Support Services Licensee (MSSL)-Market Participant
Agreement (a generation licensee/a contestable consumer)
– Power System Operator (PSO)-Market Participant Agreement
• PSO and each market participant under Market Rules
– Market Support Services Agreement (Retailer)
• MSSL (provider) and retailers (procurers)
– Market Support Services Agreement
• MSSL (provider) and demand response participants (procurers)
– Retailer Use of System Agreement
• The Transmission Licensee and an electricity retailer
– Generation Facility Operation Agreement
• Power System Operator (PSO) and a generation licensee
40Financial Flow between Market Players Source: EMC (2012) 41
Electricity Licences
•   Generation Companies
     – One or more generating units of 10 MW or above each
•   Retailers
     – Retail electricity to contestable consumers
•   Wholesalers
     – One or more generating units of 1 MW or more each but less than 10 MW
•   Market Support Services Licensee
     – SP Services: Metering, managing metered data and facilitating access to a
       wholesale electricity market, and supplying electricity to non-contestable
       consumers
•   Transmission Licensee/Transmission Agent Licensee
     – SP PowerAssets Ltd: Managing the electricity transmission system
     – SP PowerGrid Ltd: transmitting electricity
•   Market Company
     – Energy Market Company (EMC): Operating and administering Singapore’s
       wholesale electricity market (NEMS)

                                                                                    42
Industry Structure and Players Source: EMC (2012) 43
Schematic Diagram of NEMS
    with Financial Flows

                            44
Electricity Licensed Workers/Installation Licences
• Electrical Worker Licence
– Electrician’s Licence
– Electrical Technician’s Licence
– Electrical Engineer’s Licence
• Electrical Installation Licence
– An electrical installation of approved load exceeding 45 kVA for
non-domestic purposes
• Cable Detection Worker Licence
– Cable detection work prior to the commencement of any earth
works
45Electricity Tariff
• Tariff revised quarterly to reflect cost of electricity
• Forward fuel prices for 2.5 month period to set tariff
• Regulated tariff only for Non-contestable Consumers
(households and small businesses, using less than
10MWh monthly)
Forward fuel price from Jan
SPS calculates and Electricity tariff set
to mid-Mar 2012 used in
announces tariff for 2Q 2012
computation of tariff
Jan Feb Mar Apr May Jun
Source: EMA (2012)
46Electricity Tariff Breakdown
Energy Costs Generation Companies
23.03 ¢/kWh
Network Costs
4.78 ¢/kWh
SP PowerAssets
SP Services
MSS Fee
0.22 ¢/kWh
Market Admin & PSO Power System Operator
Fee & Energy Market
0.05 ¢/kWh Company
Tariff for Jul to Sep 2012: 28.08 ¢/kWh
Source: EMA (2012) 47Targeted Assistance for Households
• GST Voucher - U-Save: a rebate to help lower- and
middle-income households with their utilities bills.
• Eligible households will receive their U-Save rebates
once every 6 months, in January and July
• Lump sum rebate encourages people to save electricity
Source: EMA (2012) 48Policy Papers
• Nine policy papers
– Handbook for Photovoltaic (PV) Systems (2011)
– Developments in the Singapore Electricity Transmission Network (2011)
– Policy on Self-Supply of Electricity (2008)
– Net Treatment of Embedded Generators (2006)
– Exemption of Embedded Generating Units in Operation Prior to 1 Jan
2003 from the Licensing Requirement (2006)
– Guidelines on Evaluation of Merger and Acquisition Proposals in the
Electricity Industry (2004)
– Briefings on the Procedure for Application for Electricity Supply in the
New Electricity Market Framework (2002)
– Application for Exemption form Compliance with Code of Practice
(2002)
– Policy on Direct supply of Electricity by Generating Sets to On-site
Loads (2002)
49Singapore Load Curve
Daily peak production
tends to occur during
the day,
Shoulder production
early in the morning and
later in the evening,
Off-peak during the night
Source: Energy Market Authority (EMA) Singapore
50Determination of Market Clearing Price
Price
($/MWh) Total demand
100
The market clears
at this point
80
60 Clearing price = $50/MWh
40
20
0
Quantity
Offers below the clearing Marginal Offers above the clearing (MW)
- 20 price are accepted unit price are not accepted
above
Company A Company B Company C
Source: EMA (2012)Physical and Economic Withholding
Source: EMC (2012)
52Market Power and Measures
53Lerner Index
• The relative mark-up over marginal cost
– The difference between price and marginal cost as a
fraction of the price
– A ratio of price less marginal cost of supply to price
– Price-cost margin
• Zero (0): no market power
• One (1): infinite market power
• It measures a firm’s ability to maintain prices
above competitive level at its profit-maximizing
level of output
54Test Results of Market Power: An Example
Measures Values and Remarks
CS4 96%
CS8 Close to 100%
HHI 0.2662
SMA Negative for all gencos
RSI Larger than 1 for all gencos
Lerner Index 0.188 – 0.250
Source: Compiled from Chang (2007) Energy Policy, 35: 403 – 412
55Three Game-theoretic Models
• Cournot model
– Each firm chooses quantity to maximize profits given
the other firms output
• Duopoly
• Stackelberg model
– One firm is a leader in the market setting the quantity
knowing how the other firm will react
• Bertrand model
– The two firms set price instead of quantity
– The Bertrand solution is the same as the competitive
solution
56Perfect Competition Solution
57Cournot Game without Contracts
58Cournot Game with Contracts
59Vesting Contracts
• A contractual agreement between generation
companies and SP Services Ltd (MSSL)
– To sell a specifies amount of electricity (the vesting
contract level) at a specified price (the vesting
contract price)
– The vesting price is set by taking account both the
long-run marginal cost of the most efficient generation
technology that account for at least 25% of the total
electricity demand in Singapore
– The EMA reviews the vesting parameters every two
years or when necessary
60Definition of Net Generation Capacity
• Net Capacity = N x [G-C-R-(A+S+F+O) x G]
– N: Number of Units
– G: Gross Unit Capacity
– C: Cogeneration Use
– A: Auxiliary Usage Rate
– R: Reserve
– S: Scheduled Outage
– F: Forced Outage
– O:Other De-Rating
61Market Power in NEMS
• Various price levels in 2004 and 2005
– The Generation Weighted Average (GWA)
Pool Price
• The price observed in the wholesale market,
presumed a perfectly competitive solution
– Average Market SRMC
• The average price of all generators offered at their
SRMC, presumed a perfectly competitive market
– VC Strike Price
• LRMC of the next efficient new generator
62Evidence of Market Power 1
• Vesting Contract (VC) strike price (LRMC) is
close to the Generation Weighted Average
(GWA) pool price
Price ($/MWh) 2004 2005
VC Strike Price 96.95 110.94
GWA Pool Price 81.48 108.72
Average Market SRMC N/A 85.07
63Evidence of Market Power 2
• The 2004 prices were lower compared to the VC
Strike price (quarterly basis);
• The 2005 prices were much closer to the VC
Strike price
Price 2004 2005
($/MWh)
1 2 3 4 1 2 3 4
VC Strike 94.24 96.25 95.73 101.56 101.2 96.35 117.38 128.39
Price 9
GWA 68.86 82.78 82.06 92.11 85.84 107.90 116.22 124.42
Market
Price
64Evidence of Market Power 3
• Average Market SRMC is far lower than actual
market price in 2005
Price ($/MWh) Load Block GWA
Peak Shoulder Off-Peak
Average Market 84.37 84.68 86.43 85.07
SRMC
Actual Market Price 111.46 110.73 103.99 108.72
65Vesting Contract Level (%):
Suggested, Scheduled and Actual
2004 2005 2006 2007 2008 2009 2010 2011 2012
Suggested 54 55 62 46
Scheduled 65 50 50 50 50 40 40 40 40
Actual 65 65 65 65*/55 55 55 55 60 55
Suggested: PA Consulting or EMA Consultant
Scheduled: establish prior to 2004
Actual: EMA’s decision by every two-year review
*: For the first two quarters of 2007 (Jan – Jun 07)
66Vesting Contract Level (updates)
Period Vesting Contract Level (%)
2013 1H 55
2013 2H 50
2014 40
2015 1H 30
2015 2H 25
2016 20
67Market Share (%) and CS4: Updates
68CS4: 2005 - 2013
69HHI: Updates
70Total Capacity and SMA: Updates
71RSI: Updates
72Monthly USEP 2004 – 2012
Monthly USEP from 2004-2012
300
250
200
150
SGD
100
50
0
73USEP in 2008
USEP
(S$/MWh)
1200
1000
800
600
400
200
0
-200
74USEP in 2009
Half hour USEP in 2009
5000
4000
3000
2000
1000
0
01.Jän.09 01.Feb.09 01.Mär.09 01.Apr.09 01.Mai.09 01.Jun.09 01.Jul.09 01.Aug.09 01.Sep.09 01.Okt.09 01.Nov.09 01.Dez.09
-1000
75Lerner Index with LRMC
76Lerner Index with SRMC
77Regulatory Sandbox Framework
• To provide a ‘safe space’ in which interested parties can
experiment with innovative solutions without being
subjected to the prevailing regulatory requirements
• Safeguards will be introduced during the experiment to
minimize risks to consumers and industry
– The duration of the trial or the maximum number of consumers
78Regulatory Sandbox Regulation: Illustration
79Soft Launch of Open Electricity Market
• A pilot program
• It starts April 2018
• A total of 108,000 household and 9,500 business
accounts in Jurong will have the option of buying
electricity from a retailer of their choice or SP Group (the
current MSSL)
– Currently businesses with an average monthly electricity
consumption of at least 2,000 kWh have the option of buying
electricity from a retailer of their choice or SP Group
• The Energy Market Authority (EMA), the regulator, will
extend the option to the rest of consumers in Singapore
(about 1.3 million accounts) in the second half of 2018
80Map of Soft Launch in Jurong
81Thank you for your attention!
If you have any question or comment,
please contact me at
yhcahgn@suss.edu.sg
82You can also read