VIRTUAL SITE VISIT AND STATUS UPDATE OF THE SPANISH SOLAR PARKS TALAYUELA AND LA CABRERA INCLUDING THE IMPACT OF COVID-19 EPIDEMIC ON THE PROGRESS ...

Page created by Lewis Bennett
 
CONTINUE READING
VIRTUAL SITE VISIT AND STATUS UPDATE OF THE SPANISH SOLAR PARKS TALAYUELA AND LA CABRERA INCLUDING THE IMPACT OF COVID-19 EPIDEMIC ON THE PROGRESS ...
Virtual site visit and status update of the Spanish solar
parks Talayuela and La Cabrera including the impact of
CoVid-19 epidemic on the progress of construction
Encavis AG, Online Capital Markets Day 2020, www.encavis.de, April 22, 2020
VIRTUAL SITE VISIT AND STATUS UPDATE OF THE SPANISH SOLAR PARKS TALAYUELA AND LA CABRERA INCLUDING THE IMPACT OF COVID-19 EPIDEMIC ON THE PROGRESS ...
THE Pan-European platform
for renewables . . .
VIRTUAL SITE VISIT AND STATUS UPDATE OF THE SPANISH SOLAR PARKS TALAYUELA AND LA CABRERA INCLUDING THE IMPACT OF COVID-19 EPIDEMIC ON THE PROGRESS ...
3

Virtual site visit
at Talayuela
and La Cabrera
VIRTUAL SITE VISIT AND STATUS UPDATE OF THE SPANISH SOLAR PARKS TALAYUELA AND LA CABRERA INCLUDING THE IMPACT OF COVID-19 EPIDEMIC ON THE PROGRESS ...
4

 . . . definitely focussed:

Progress of construction
and status update at
Talayuela and La Cabrera
VIRTUAL SITE VISIT AND STATUS UPDATE OF THE SPANISH SOLAR PARKS TALAYUELA AND LA CABRERA INCLUDING THE IMPACT OF COVID-19 EPIDEMIC ON THE PROGRESS ...
5

Market entry in Spanish PPA market with 300 MW PV park “Talayuela” in realization

                                                           Highlights:

                                                           > Generation capacity:                   300 MW
                                                           > Total investment volume in EUR:       ~225 m
                                                             Equity/project debt finance level:     43:57
                                                             Full loan repayment within PPA
                                                             runtime of                             10 years
           Talayuela                                       > Co-investor: Solarcentury with        ~20%
                                                           > Long-term PPA contract with
                                                             fixed price for                        10 years
                                                           > Revenues 1st year of full operation
                                                             in EUR:                               ~25 m
                                                           > Post-tax IRR:                         >8%
                                                           > Connected to the grid                 late 2020
VIRTUAL SITE VISIT AND STATUS UPDATE OF THE SPANISH SOLAR PARKS TALAYUELA AND LA CABRERA INCLUDING THE IMPACT OF COVID-19 EPIDEMIC ON THE PROGRESS ...
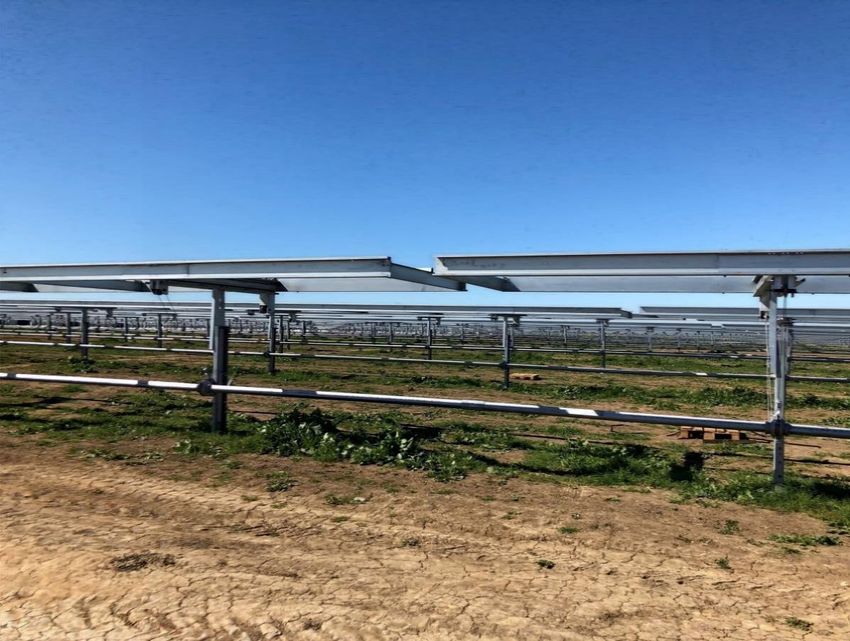
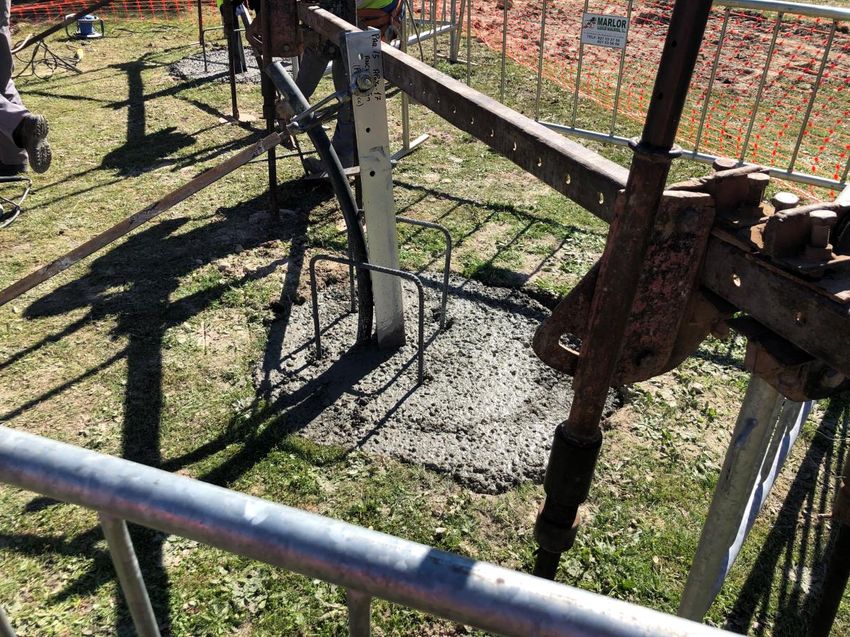
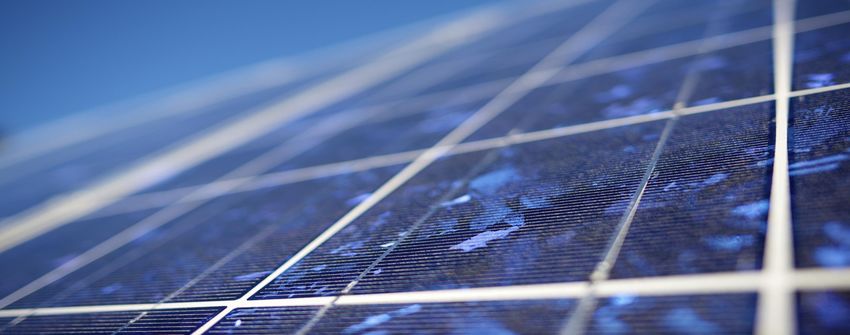
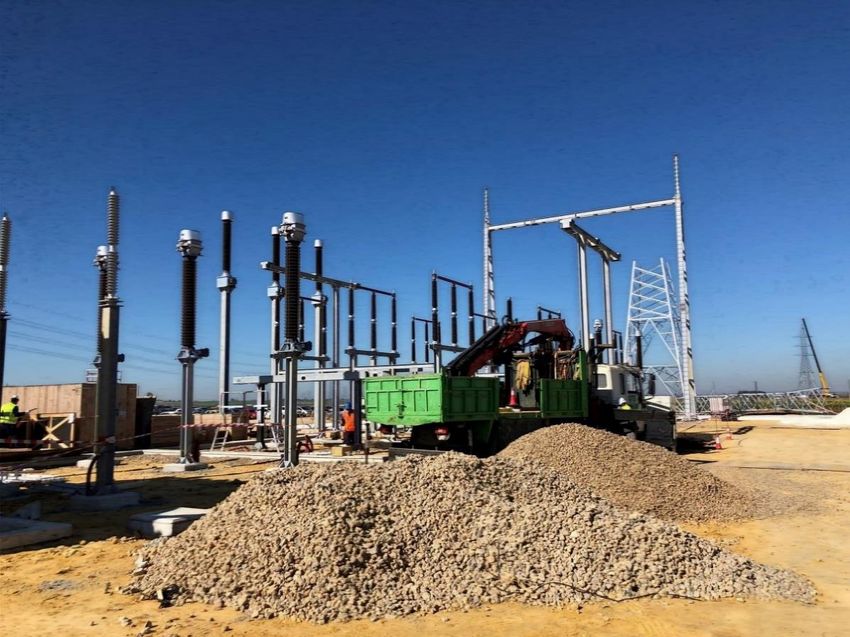
Talayuela

High voltage section of the PV plant at Talayuela (end of February 2020)

 Concrete foundation of a pylon                           Substation area
VIRTUAL SITE VISIT AND STATUS UPDATE OF THE SPANISH SOLAR PARKS TALAYUELA AND LA CABRERA INCLUDING THE IMPACT OF COVID-19 EPIDEMIC ON THE PROGRESS ...
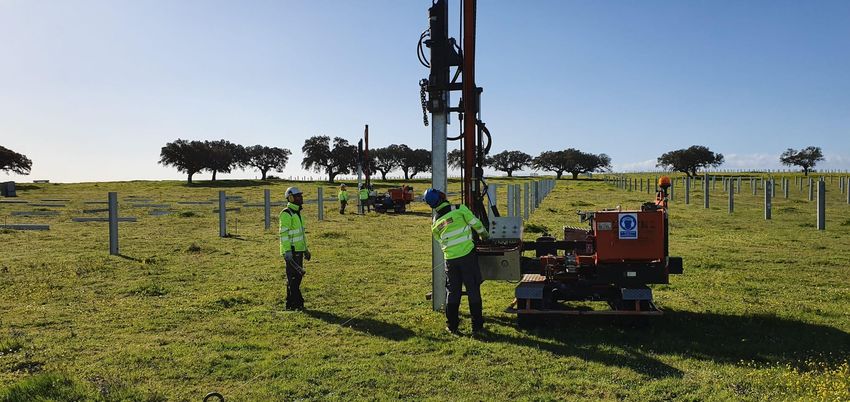
Talayuela

Ramming activities
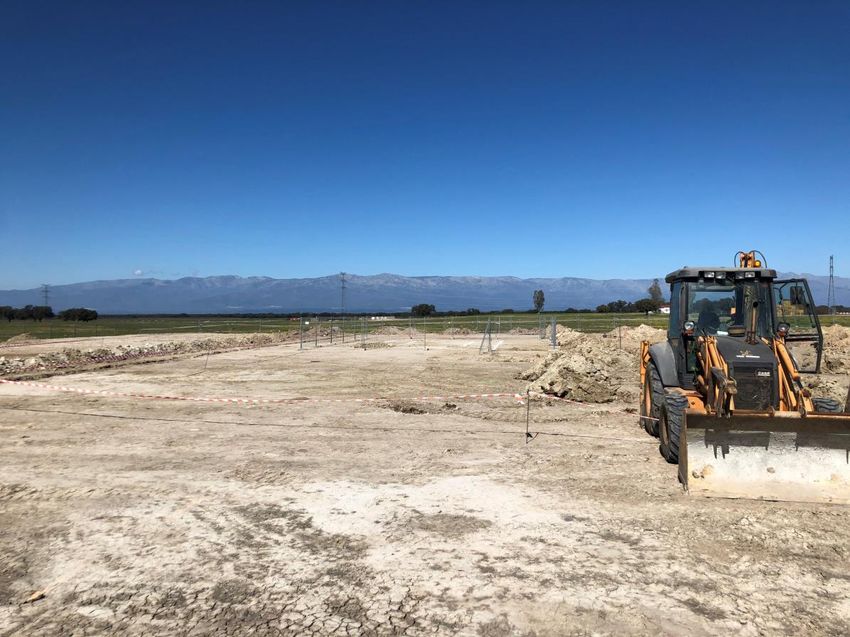
VIRTUAL SITE VISIT AND STATUS UPDATE OF THE SPANISH SOLAR PARKS TALAYUELA AND LA CABRERA INCLUDING THE IMPACT OF COVID-19 EPIDEMIC ON THE PROGRESS ...
Talayuela

Status of the construction of the PV plant as of March 25th, 2020

27% of the entire plant is completed                                            Planned             Required as per
Civil works and site preparation:                                               Key Dates           EPC contract
   a) 100% of compound areas & facilities
                                                                                Grid Connection     11/23/2020
   b) 80% of roads (approx.)
18% of the High Voltage section (substation and transmission line) is built up Date for             11/30/2020
                                                                                Commissioning
29% of the ramming task (approx.) of the photovoltaic section is completed
across the entire plant                                                         Date for            01/25/2021
                                                                                Completion
Main components and products delivered to site as of April 17 ,2020:
                                                              th
                                                                               Expected delay due to CoVid-19
   a) 29% of PV modules (additional 26% are on vessels and 7% are in EU)
                                                                               outbreak: 78 calendar days
   b) 35% of trackers
                                                                               Expected extra costs/day:
   c) 40% of cables (approx.)                                                  EUR 18,000 resulting in
   d) 81% of inverters                                                         EUR 1.4 million of total extra costs
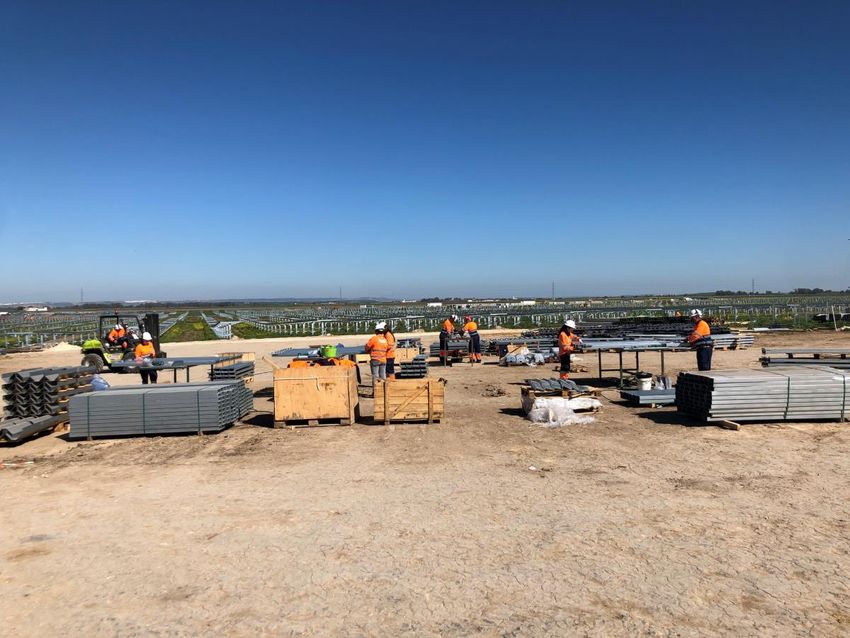
VIRTUAL SITE VISIT AND STATUS UPDATE OF THE SPANISH SOLAR PARKS TALAYUELA AND LA CABRERA INCLUDING THE IMPACT OF COVID-19 EPIDEMIC ON THE PROGRESS ...
9

Entering the Spanish Corporate PPA market with 200 MW PV park “Cabrera” in realization

                                                           Highlights:

                                                           > Generation capacity:                ~200 MW
                                                           > Total investment volume in EUR: ~158 m
                                                             Equity/project debt finance level:    ca. 50:50
                                                             Full loan repayment within PPA
                                                             runtime of                            10 years
                                                           > Co-investor: Solarcentury with      ~10%
                                                           > Long-term PPA contract (149 MW)
                                                             with Amazon with fixed price for      10 years
            Cabrera                                        > Revenues 1st year of full operation
                                                             in EUR:                             ~16.4 m
                                                           > Post-tax IRR:                       ~ 8%
                                                           > Connected to the grid               late 2020
VIRTUAL SITE VISIT AND STATUS UPDATE OF THE SPANISH SOLAR PARKS TALAYUELA AND LA CABRERA INCLUDING THE IMPACT OF COVID-19 EPIDEMIC ON THE PROGRESS ...
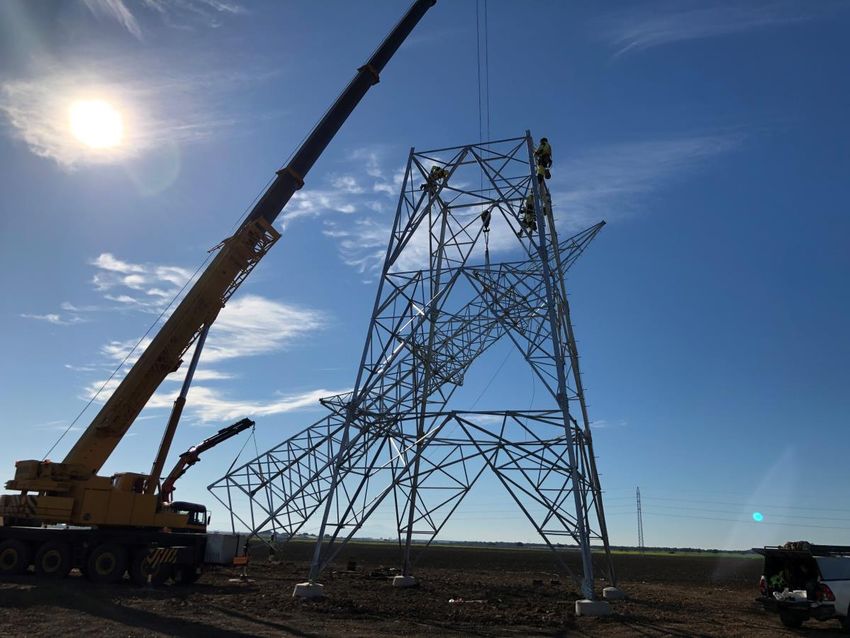
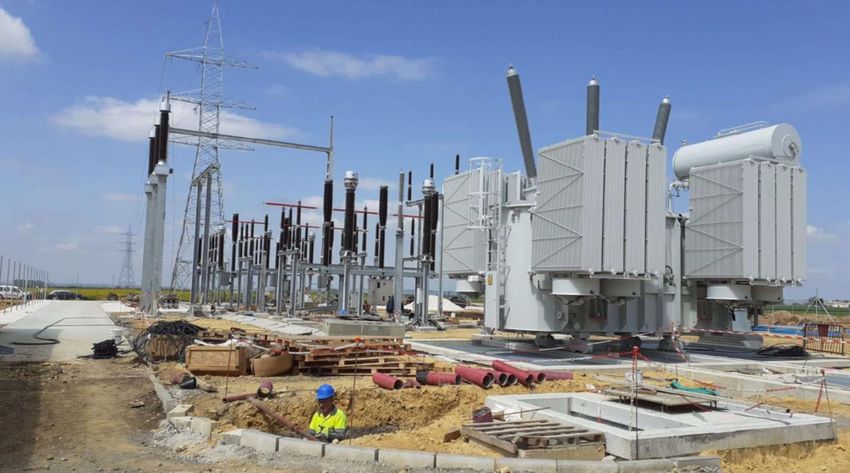
La Cabrera

High voltage section of the PV plant (as of February 27th, 2020)

 Tower #35                                                 Substation
La Cabrera

High voltage section of the PV plant (as of March 30th, 2020)

                                                                Substation
La Cabrera

La Cabrera (as of February 27th, 2020)

 Pre-assembly workshop                   Trackers
La Cabrera

Cerrado Cabrera (as of February 27th, 2020)

 Low voltage/medium voltage transformation platform   Medium voltage switchgears
La Cabrera

Status of the construction of the PV plant as of March 31st, 2020

61% of the entire plant is completed                                           Planned           Required as per
80% of the High Voltage section (substation and transmission line) is built up Key Dates         EPC contract

88% of the ramming task (approx.) is completed across the entire plant and
                                                                              Grid Connection    8/18/2020
36% of the trackers have been fully installed or pre-assembled of the
photovoltaic section                                                          Date for           8/25/2020
Main components and products delivered to site already:                       Commissioning
  a) 82% of PV modules (the remaining 18% arrived in EU as of April 20th)     Date for           10/20/2020
  b) 100% of trackers                                                         Completion
  c) 100% of cables                                                          Expected delay due to CoVid-19
  d) 100% of inverters                                                       outbreak: 90 calendar days
  e) 45% of Low/Medium Voltage transformers                                  Expected extra costs/day:
                                                                             EUR 27,370 resulting in
                                                                             EUR 2.5 million of total extra costs
15

(No) Impact of
CoVid-19 epidemic
on the progress
of construction
and on other solar projects
Corona impact on our spanish construction sites (500 MW)

                                                       Additional Health & Safety regulations allow
                                                       construction to continue @ increased working
  In response                                          distances of 2 metres
  to the virus outbreak,
  the Royal Decree
  10/2020 disallowed                                                   We are working with local authorities
  construction works                                                   to mitigate the impact of the 2 metres
  to continue, but                                                     rule in order to allow for as many
  has been softended                                                   activities to continue –
  since April 10th                                                     with the workers’ safety in focus

                                                           Currently,
                                                           no severe supply chain bottlenecks are observable
Talayuela EPC – Delay Damages in case of Force Majeure vs. not based on Force Majeure

In case the EPC Contractor could ask for an extension
of the construction time
because of a Force Majeure Event the SPV
would not be able to claim for delay damages

In case of a delay in construction
not based on Force Majeure the SPV
would be entitled to claim delay damages
in an amount of up to ~ EUR 17 million
Talayuela PPA – Impact on Term in case of Force Majeure

The Talayuela PPA is a pure financial power hedge based on the ISDA Master Agreement.
The term of the PPA for Talayuela is ten (10) years, starting from January 1, 2021

In case of a Force Majeure Event, which hinders the ability of the project to generate/or feed-in electricity
(Project Force Majeure), leads to a later COD, the term of the PPA for Talayuela would still be ten (10) years,
starting from January 1, 2021

During a Project Force Majeure Event the project company would be allowed to suspend any payment(s)
for up to six months, provided that the project company has provided the off-taker with an additional bank guarantee.
Generation would be assumed to happen on the agreed theoretical profile of the plant

Sensitivity analysis:
Delayed COD by one quarter would result in additional costs of ~ EUR 0.8 milllion, that …

Delayed COD by another quarter (two quarters in total) would result in additional costs of ~ EUR 1.5 million
(EUR 2.3 million in total), that could be reduced significantly by an additional hedging strategy.
La Cabrera EPC – Delay Damages in case of Force Majeure vs. not based on Force Majeure

In case the EPC Contractor could ask for an extension
of the construction time
because of a Force Majeure Event the SPV
would not be able to claim for delay damages

In case of a delay in construction
not based on Force Majeure the SPV
would be entitled to claim delay damages
in an amount of up to ~ EUR 11 million
La Cabrera PPA – Impact on Term in case of Force Majeure

The term of the PPA for La Cabrera is always ten (10) years, beginning with actual COD of the project

In case the COD of the project is after the Expected COD, delay damages, capped at EUR 9 million,
would have to be paid to the off-taker until COD happens. This would not apply if the Expected COD
can be shifted due to a Force Majeure Event:

  The Expected Commercial Operation Date and Guaranteed Commercial Operation Date,
  and related damages provisions and termination rights, will be extended by the number of days
  equal to the duration of
  (i) any Force Majeure Event, up to a maximum of 180 days and
  (ii) any Grid Delay Event, up to a maximum of 180 days.

  In such case the term of the PPA for La Cabrera would still be ten (10) years,
  beginning with actual COD of the project
21

 Speaker

 Dr. Dierk Paskert
 Chief Executive Officer

 CEO since Sep 2017
 Reappointed until Aug 2025

 CEO Rohstoffallianz GmbH
 Member of the Management Board of E.ON-Energie AG
 SVP Corporate Development of E.ON AG
 Member of the Management Board of Schenker AG

The information provided in this document has been derived from sources that we believe to be reliable. However, we cannot guarantee the accuracy or completeness of this
information and we do not assume any responsibility for it. Encavis AG assumes no liability for any errors or omissions or for any resulting financial losses. Investments in
capital markets, in particular in stock markets and futures markets, are fundamentally associated with risks and a complete loss of the invested capital cannot be ruled out.
Recommendations provided herein do not represent an offer to buy or sell and are not intended to replace comprehensive and thorough advice before making a decision to
buy or sell. Copies of the content of this presentation, in particular prints and copies or publications in electronic media, will only be authorized by written consent from
Encavis AG.
22

Appendix:
23

Worldwide growth in generating capacity of renewables by technology

Capacity growth                                                                 82 %      Percentage of
in GW                                                                                     PV/Wind of total
                                                                 68 %
               1000
                                                                               44
                 800                               45 %           45           119
                                                                 215
                 600                                                                       Other
                                       28 %                                    438         Hydropower
                 400                                             260                       Solar
                                                    31
                                                                                           Wind
                                                   176
                 200                  14                                       321
                                                   36            285
                                      92           134
                      0               39
                                  1994 - 2004   2005 - 2010   2011 - 2016   2017 - 2022

 Source: International Energy Agency 2017
24

Demand for power from renewables from two strong players: public & private sector

                         Public Sector: Goal to limit global warming
                         o   COP 21 Paris: 196 countries united to limit global warming below 2°C
                         o   Europe 20-20-20 targets
                         o   China: largest installed renewables fleets
                         o   Denuclearization in Germany and Japan
                         o   Creation of low-carb economies
                         → Demand via FIT-schemes and competitive auctions

                         Private sector: Sustainability goals and long-term supply security
                         o   Private companies create global initiatives in order to take action on climate change.
                         o   Multinational companies such as Google, Facebook and Microsoft go ahead with ambitious targets
                         o   100% renewable targets help to create a positive brand awareness
                         o   Furthermore, direct Power Purchase Agreements between companies and power producers
                             from renewable energy resources offer long-term supply at fixed rates
                         → Demand via PPAs and purchase of green certificates
25

Conservative acquisition strategy for markets with FiT (Feed-in-Tariffs) will be pursued as in the past

 We acquire ready-to-build, turnkey-projects
 or existing parks with Feed-in-Tariffs and
 operate them over their technical and
 commercial life time                                                                   >7%
                                                                    >7%
 >10 years of experience in these markets still                                       >6%
 allow for numerous acquisition opportunities
 in established markets with satisfying IRRs                                                >5%

 Falling interest rates create an increasing
                                                                                >6%
 competition for FiT projects
 However, Encavis reiterates its commitment                                                         >8%
                                                                                                          Post tax equity IRR for FiT
 to stated IRR expectations                                                                               PV projects/higher for wind
                                                                                                          Market presence for FiT
                                                                                                          Market entry planned
                                                                                                          for FiT
26

Competitive generation costs of PV & wind projects opens new business opportunities
Development of global levelized costs of electricity                                            Forecasted generation costs for large-scale PV
(USD real 2018 /MWh)                                                                            and 2021 Forward Prices1 (EUR/MWh)
                                                                                                                                                  52                            Merchant PPA
     350                                                                                                                                                                         opportunity
                                                                                                50                  45                                                  44
     300
                                                                                                                                                  46
     250                                                                                        40
                                                                                                                                                                        40
                                                                                                                    38
     200                                                                                        30
     150
                                                                                                20
     100
                                                                                                10
         50
          0                                                                                       0
              2010      2012           2014     2016               2018 2019                                    Spain                   Italy                          France
               1H        1H             1H        1H                1H   1H                                   2020 expected generations cost for PV
                 Solar-PV              Onshore wind                                                           2021 Electricity Forward Price (Feb)

               In Southern-European markets the generation costs of renewables are already below prices of
     !
               2019 Electricity Forwards. This boosts PPA-Markets in countries such as Spain and Italy.
Source: : BNEF, Fraunhofer ISE, Fraunhofer ISE Energy Charts, Goldman Sachs Global Investment Research, 1. Baseload Futures Year Ahead last price as of Feb 14, 2020
27

Conservative acquisition strategy for markets with PPA projects with increasing importance

 We acquire ready-to-build, turnkey-projects
 or existing parks and negotiate Power Purchase
 Agreements with companies with very good
 ratings and operate them over their technical
 and commercial life time
 Our experience from PPA negotiations in Spain                                  >7%
 (500 MW PV) and UK (40 MW PV) enables
 Encavis to move to emerging PPA markets
 like Italy and – in time to come – Germany
 and France
 IRR minimum requirement depends more on                                       >8%                 Post tax equity IRR for PPA
                                                                                             >8%
 risk distribution and rating of the off-taker,                                                    PV projects/higher for wind
                                                                                                   Market presence for PPA
 to a lesser extent on regulatory risk                                                             Market entry planned
                                                                                                   for PPA
28

Strong growing PPA-markets – ENCAVIS is a European first mover in solar

Annual capacity additions through PPAs in EMEA                                   Three pillars of the Encavis PPA Strategy
(MW)1
                                                                                 1   Encavis has secured preferred access to dedicated
                                                                         2 260       IP for PPA related risks by investing in market
           PV                                                             262        leading competence platform
           Wind

                                                     1 213                       2   Founding investor in a newly created fund,
                                                                 1 129
                                                      193          84                targeting to satisfy the demand of leading global
                                                                         1 998       corporates for green energy through customized
                                          698
                                          140                                        Wind- and PV-projects and attractive PPAs
                                                     1 020       1 045
                               281
                   165                     558                                   3   Leveraging our knowledge and network as
           9                   236
                   117                                                               experienced investor with various potential
      2012        2013        2014        2015       2016        2017    2018        offtakers

Source: IEA, BNEF; 1: 11.02.2019; signing date estimated by Bloomberg
29

 Steadily growing volume of globally signed corporate PPAs

 Global corporate PPA volumes                                           PPA capacity by offtaker type
Annual volume in GW                                               Annual volume in GW
          25                                                           14,0
                                                                                                                               12.7
                                                           19.5        12,0
         20
                                                           1,3                                                                  3,4
                                                           2,6         10,0
         15                                         13.6                                                                        0,9
                                                                        8,0                                                     1,2
                                                     2,1
                                                                        6,0                                       5.6           2,1
         10                                         2.3                            4.9
                                                                                                                  1,0
                                             6.2           15,7                    0,7            3.9             0,3           0.8
                       4.7          4.3                                 4,0        0,6            0,3             0,4
                                             1,3                                   0,3
                                                                                   0,1            0,4             1,4
           5                                                                       0.5            0,3
                                                                                                  0,3
                 2.3   0,5
                       0.8          0,7      1.1    9.2                                           0.6             0.4
                                    1.2                                 2,0                                                     4.3
                 0,1
                 0.5   3.9                   3.8                                   2.7            2.0             2.1
                 1.8                2.6
           0                                                            0,0
                2014   2015         2016     2017   2018   2019                   2015            2016         2017             2018
                             AMER     EMEA   APAC                                 Technology             Government & University
                                                                                  Manufacturing          Consumer Staples
                                                                                  Materials              Others
 Source: BNEF
30

The need for green energy supply is driving PPA markets

Top offtakers by capacity and source                                                        Market developments

   Google LLC                          4001                         1970         5,971 MW
                                                                                            North American market with pioneering role
    Facebook             1935                            3027         4,962 MW              US companies search partners for PPAs in Europe

     AT&T Inc           1674           529 2,303 MW
                                                                                            ENCAVIS registers increasing demand for PPAs
                                                                                            also in Europe (Nordics, Spain, Italy, Ireland, Germany)
      Amazon        1289           895        2,184 MW
                                                                                            Major PPA deal in Europe in 2017:
Microsoft Corp     1104          979      2,083 MW                                          Norsk Hydro signed PPA until 2039 for 650 MW
                                                                                            wind park in Sweden
     Wal-Mart       1300        285 1,585 MW
                                                                                            PPAs are contracted for time periods
  Norsk Hydro
                       1411      1,411 MW
                                                                                            from 6 – 20 years
      ASA

     Apple Inc         729     1,056 MW
                 327                               Wind     Solar
 Source: Bloomberg NEF, 2020
31

Strong growing PPA-markets – ENCAVIS is a European first mover in solar

Pillars of the Encavis Growth Strategy >> Fast Forward 2025

> Encavis has secured preferred access to know-how for PPA by establishing a dedicated in-house
  competence team and by investing in market leading competence platform Pexapark (CH).

> Leveraging knowledge and network as experienced investor based on recently signed PPAs
  with a leading European Utility and Amazon for in total 500 MW of Spanish solar parks.

> Strong Balance Sheet with equity ratio > 24% giving corporates adequate comfort to handle risks
  from long-term PPA contracts.
> Access to early stage projects without taking direct development risk by signing numerous
  partnership agreements with exclusive rights in Italy, France, Spain, Netherlands, Denmark
  and Germany.
32

ENCAVIS is an Independent Power Producer (IPP) from renewable energy sources (solar/wind)
Business model: risk structure of an investment over time (solar/wind)

           Risk                                            Project life cycle
       +                            Project Developer                            Investor & Operator

                                    Completion
                                       risk

                                                  Technical
                                                     risk
                                                                          Production risk
                                                                                                           Dismantling
                                                                                                              risk
       –
                         Planning                       Construction       Operation         Dismantling

                           Selected risks                         COD Connection on the grid
33

Three year project pipeline status of Dec 2019 with >750 MW in total to come

                              PV park in The Netherlands PV park in Spain
Solarcentury                  with Solarcentury          with Solarcentury
Exclusive PV pipeline         43.9 MW                               200 MW PV park incl. 149 MW /
in Europe and overseas        Attractive FIT for 15 years           10-year PPA with Amazon                    > 40 % of
of some 1.1 GW                First project out of pipeline         Grid connection planned                1.3 GW pipeline
                              with Solarcentury                     for Q3 2020                          realized in < 2 years
December 2017               March 2018                                           Dec 2019

             January 2018                                     Oct 2018 / Sep 2019
              ISIF/Power Capital                     PV park in Spain with Solarcentury
              Exclusive PV pipeline in Ireland       300 MW biggest PV park in the history of Encavis
              of 200 MW                              Contracting of 10-year PPA with (tier-1) offtaker
                                                     Grid connection planned for Q4 2020
34

Appendix:
Operational excellence and battery storage
35

Insight into our on-site activities (examples)

                            Thermography                 Repairs
                            Identification of strings    For instance repair of
                            with short circuits          string-inverters with
                            Adjustment of the polarity   lightning damages
                                                         (350 in the past 24 months)

                            Performance tests            Replacing modules
                            Performance                  In 2014 and 2015 our
                            measurements for strings     team replaced more than
                            or single modules show       20,000 defect modules
                            performance reductions
36

Optimizing the performance of our Wind Portfolio

Power Uprates                                                          Optimizing power curves

Power Uprates for installed turbines increase annual                   Improve efficiency of turbine at lower wind speeds
electricity production of turbines by up to 3% without                 through software updates and the optimization of
effecting the turbine design life                                      regular downtimes, of blade pitch angle and of
                                                                       gondola alignment
Power (kW)                                                             Power (kW)
  3.500                                                                  3.500
  3.000                                                                  3.000
  2.500                                                                  2.500
                                                                                                                      Optimized power curve
  2.000                                                                  2.000
                                                                                                                      Baseline
  1.500                                                                  1.500
                                               Power Uprate
  1.000                                                                  1.000
                                               Baseline
    500                                                                    500
      0                                                                      0
          3   4   5   6   7   8   9 10 11 12 13 14 15 16 17 18 19 20             3   4   5   6   7   8   9 10 11 12 13 14 15 16 17 18 19 20
37

Increasing share of renewables in power sector creates new challenges

Electricity demand and historic supply mix                              Conceptual supply mix in the future
MW                                                                 MW
                                                                                           Battery
                                                                                          charging                   Solar-PV
                                     Peak Load                                Battery
                                                                            discharging                                            Hydro
                               Intermediate Load
                                                                                                                                   Natural Gas

                                     Baseload                                                                                      Wind

                                                                                                                    Biomass

     0   2   4   6    8   10   12    14   16   18   20   22   24        0   2     4       6    8     10   12   14     16      18   20     22   24
                          Hour of Day                                                                Hour of Day
   Supply based on coal, nuclear and gas                            Supply based on Renewables and flexible gas power plants
   Large, centralized power plants                                  Electricity storage with increasing importance
   National markets are not interconnected                          Decentralized power generation with prosumers
38

New business cases for electricity storage

                                        Application                                                          Possible battery technologies
                                                                   >   Time of sale of electricity
                                        Price-arbitrage for
                                                                       is independent of the time
                                        electricity trading
                                                                       of its generation

                                                                   >   Optimising utilization of available
                                                                                                             Redox
                                        Congestion management          infrastructure (generation and
                    Required Capacity

                                                                                                             Flow
                                                                       transmission)

                                                                   >   Reduce costly peak-loads
                                        Peak Shaving
                                                                       of large consumers

                                                                                                                      Lithium-
                                        Voltage stability (SDL*)   >   Stabilization of network operations
                                                                                                                      ion

                                                                   >   Participation in the control energy
                                        Supply of control energy
                                                                       market, for which RES power plants
                                        (SDL*)
                                                                       are not qualified
* System services
39

 Market for electricity storage is already growing – Promising outlook

 Annually commissioned utility-scale storage                                    Future market outlook for storage applications
In MW 1800                                                                     In GW 140
     1600                                                                                                                                                    124
                                                                                    120        Short duration balancing
     1400                                                                                      Peaking
                                                                                                                                                        98
     1200                                                                           100        RE integration
     1000                                                                                      Transmission                                        80
                                                                                     80
       800                                                      1675                           Distribution                                   66
                                                                                     60                                                  52
       600                                                                                     Residential
                                                       998                                                                         41
       400                                   854                                     40        C&I                           34
                                   600                                                                                  27
                                                                                                                   21
       200               315                                                         20               13      17
               179                                                                         7    10
         0                                                              94
              2013       2014      2015     2016      2017      2018    2019          0
                                                                                                     2020                         2025                       2030
                     Global annual battery storage capacity additions
 Strong increase in annual commissions                                          Strong growth in all regions until 2030 as storage is needed
 Growth distributed globally                                                    to integrate renewables into power sectors and thus guarantee
                                                                                security of supply
 Lithium-ion technology currently standard technology
                                                                                Decreasing costs drive capacity additions
40

Costs are forecasted to fall as installed capacities increase

Reduction of costs for energy storage systems                                Case example: Xcel Energy‘s tender
In real 2017 USD/kWh
                                                                             Resource solicitation for RES generation plus storage
   700
            631
                    581                   CAGR --6%
   600                        544
                                    495
                                                                             Submission of 400 individual proposals
   500      100                            462
                     96                           435
                              93                         410     389
   400                                                                 369
             68
                                    87
                                            83     81
                                                                             Median price for wind-plus-storage projects
                     65                                   78
   300       80
                     74
                              63
                                    59      57
                                                                 76    74    was USD 21/MWh and for solar-plus-storage
                              71                   55
   200                              64      60     57
                                                          53
                                                          54
                                                                 52    50    was USD 36/MWh
            241                                                  52    50
   100              214       193   172    156    142    129     118   109
      0                                                                      Combined bids are only USD 3 -- 7 higher than
            2017   2018   2019 2020        2021 2022 2023 2024 2025
                                                                             standalone wind and solar power plants
          Battery pack                     EPC
          Power Conversion System          Developer overheads
          Balance of System                Developer margin
          Energy Management System
41

Battery Storage: Possible market entrance for ENCAVIS

                                          Business model with minimised risks…   … and great opportunities

                                          >   Encavis is owner and operator
                                                                                 >   Diversification of Portfolio
                                              of utility-scale batteries

                                          >   Encavis transfers usage
    Established                                                                  >   Complementary to
   technologies                               of batteries via long-term
                                                                                     RES power generation
    (Wind & PV)                               contracts

                                          >   Projects are bankable              >   Early bird advantages

Established markets     Established
 (Germany, UK, …)     business models     >   Partner is responsible for the
                                                                                 >   Increase revenues of parks
                                              marketing of the battery-
                                                                                     after end of FIT (“golden end”)
                                              services
You can also read