October 2018 - BMO 2018 Global Energy Leadership Forum NYSE American: SRCI - SRC Energy Inc

Page created by Michael Rios
 
CONTINUE READING
October 2018 - BMO 2018 Global Energy Leadership Forum NYSE American: SRCI - SRC Energy Inc
October 2018 – BMO 2018 Global Energy Leadership Forum
                                                         NYSE American: SRCI
October 2018 - BMO 2018 Global Energy Leadership Forum NYSE American: SRCI - SRC Energy Inc
Forward-looking Statements and Other Disclaimers
This presentation contains “forward-looking statements” within the meaning of Section 27A of the Securities Act of 1933 and Section 21E of the Securities Exchange
Act of 1934. All statements, other than statements of historical fact, included in this presentation that address activities, events or developments that SRC Energy
Inc. (the “Company”) expects, believes or anticipates will or may occur in the future are forward-looking statements.

Forward-looking statements contained in this presentation include statements, estimates and projections regarding the availability of midstream services and
infrastructure and the Company's future financial position, operations, performance, costs, business strategy, oil and natural gas reserves, drilling program, capital
expenditure budget and sources of financing for the budget, liquidity and capital resources, the timing and success of projects, derivative activities and matters
relating to Initiatives 97 and 74. The words “estimate,” “project,” “predict,” “believe,” “expect,” “anticipate,” “potential,” “could,” “may,” “foresee,” “plan,” “goal”
or other similar expressions that convey the uncertainty of future events or outcomes are intended to identify forward-looking statements. However, the absence
of these words does not mean that the statements are not forward-looking. These statements are based on certain assumptions made by the Company based on
management's experience, expectations and perception of historical trends, current conditions, anticipated future developments and other factors believed to be
appropriate. Forward-looking statements are not guarantees of performance. Although the Company believes the expectations reflected in its forward-looking
statements are reasonable and are based on reasonable assumptions, no assurance can be given that these assumptions are accurate or that any of these
expectations will be achieved (in full or at all) or will prove to have been correct. Moreover, such statements are subject to a number of assumptions, risks and
uncertainties, many of which are beyond the control of the Company, which may cause actual results to differ materially from those implied or expressed by the
forward-looking statements. These include the risk factors discussed or referenced in the Company's most recent Form 10-K; risks relating to declines in the prices
the Company receives, or sustained depressed prices the company receives, for its oil and natural gas; uncertainties about the estimated quantities of oil and
natural gas reserves; drilling and operating risks; the adequacy of the Company’s capital resources and liquidity including, but not limited to, access to additional
borrowing capacity under the Company’s credit facility; the effects of government regulation, permitting and other legal requirements, including new legislation or
regulation of hydraulic fracturing and the export of oil and natural gas; the impact of potential changes in the Company’s credit ratings; environmental hazards,
such as uncontrollable flows of oil, natural gas, brine, well fluids, toxic gas or other pollution into the environment, including groundwater contamination; difficult
and adverse conditions in the domestic and global capital and credit markets; risks related to the concentration of the Company’s operations in the DJ Basin of
northeast Colorado; disruptions to, capacity constraints in or other limitations on the pipeline systems that deliver the Company’s oil, natural gas liquids and natural
gas and other processing and transportation considerations; the costs and availability of equipment, resources, services and personnel required to perform the
Company’s drilling and operating activities; potential financial losses or earnings reductions from the Company’s commodity price risk-management program; risks
and liabilities related to the integration of acquired properties or businesses; uncertainties about the Company’s ability to replace reserves and economically
develop its current reserves; general economic and business conditions, either internationally or domestically; competition in the oil and natural gas industry;
uncertainty concerning the Company’s assumed or possible future results of operations; and other important factors that could cause actual results to differ
materially from those projected. Estimates of the net present value of a property do not necessarily correspond to the current or future fair market value of the
property in part due to the foregoing risks and uncertainties.
Accordingly, you should not place undue reliance on any of the Company’s forward-looking statements. Any forward-looking statement speaks only as of the date
on which such statement is made, and the Company undertakes no obligation to correct or update any forward-looking statement, whether as a result of new
information, future events or otherwise, except as required by applicable law.

                                                                                                                                                                           2
October 2018 - BMO 2018 Global Energy Leadership Forum NYSE American: SRCI - SRC Energy Inc
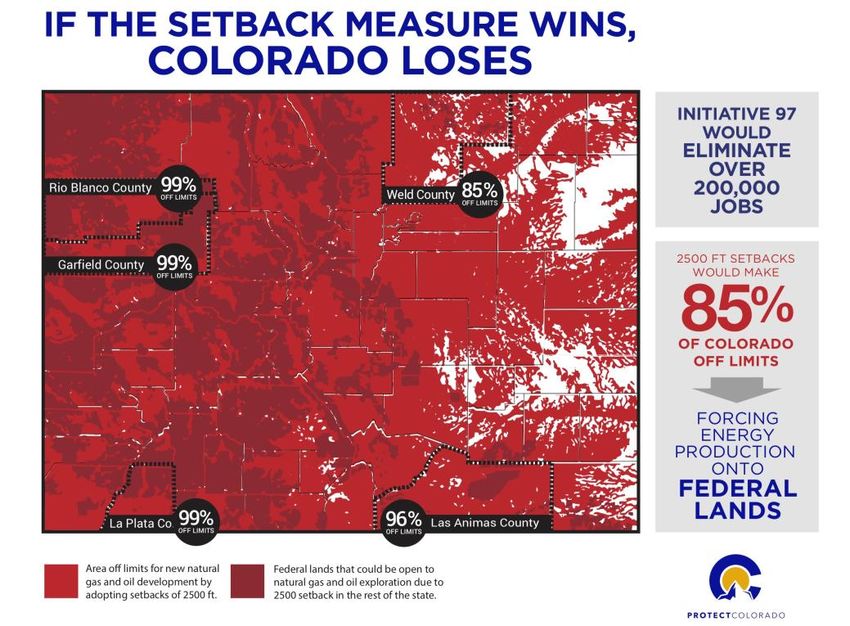
SRC Energy – Enhancing Quality of Life

▪   Pure Play DJ Basin Operator with Contiguous Acreage Position

▪   2018 operations funded by cash flow and existing liquidity

▪   Multi-year inventory of high return development

▪   Expanding infrastructure

▪   Strong balance sheet with over $475 million of liquidity
    providing capital flexibility

▪   Active pursuit of environmental and social excellence

▪   Engaged with local communities in which we live and operate

                                                                   3
October 2018 - BMO 2018 Global Energy Leadership Forum NYSE American: SRCI - SRC Energy Inc
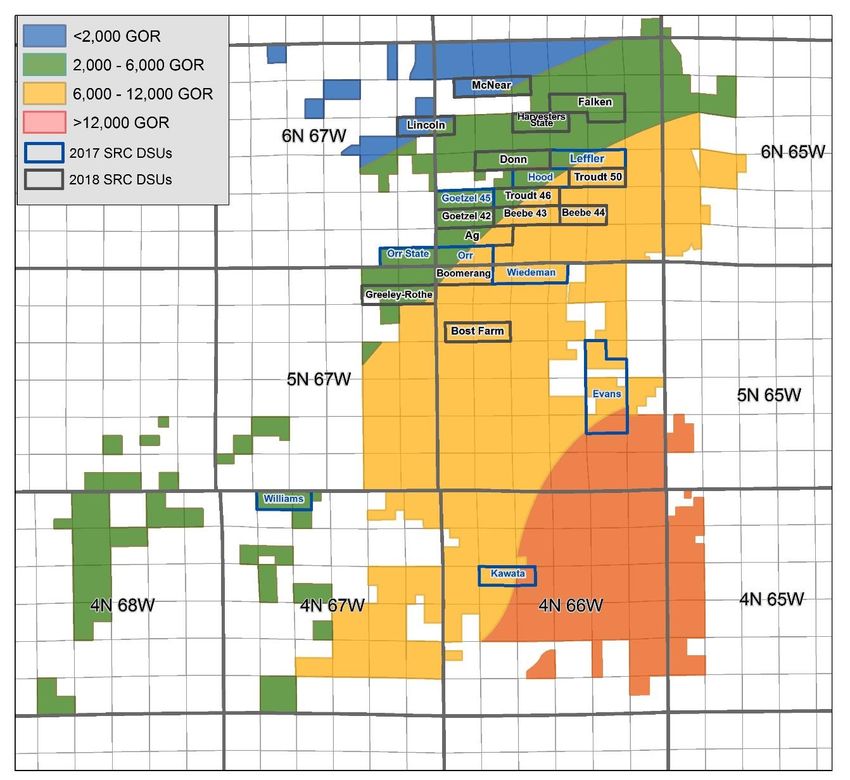
Activists’ Attempt to Ban Oil & Gas Putting Private
    Property Values at Stake
                                                         Walker Stapleton (2018 Republican candidate for Governor of Colorado) “ I oppose the
Proposition #112 [Initiative #97] – 2,500’ Setback       energy ban disguised as initiative 97“
requirement for oil and gas development                  Jared Polis (2018 Democratic candidate for Governor of Colorado) “In spite of the
                                                         challenges we face, Colorado’s economy remains today the envy of the nation. And if we
•    Effectively bans oil and gas development in         want to keep it that way, we can’t ignore the role that the oil and gas industry has played in
                                                         our growth, or the significant wages and tax revenue it creates in our state”. He also said,
     Colorado                                            “Let me be very clear where I stand on this: As I said during the Democratic primary, I
                                                         oppose initiative 97.”

•    Both candidates for the Colorado State              Ken Salazar (Former Secretary of the Interior under the Obama Administration and former
                                                         Colorado Attorney General) Called the initiative “fundamentally unconstitutional” because it
     Governor’s office have publicly apposed the         would effectively seize mineral rights from private property owners.
     initiative

•    Intensive and well funded public education
     program has begun and will ensure that
     Colorado voters understand the amendment’s
     devastating impact on energy development in
     Colorado and on Colorado’s economy

Amendment #74 [Initiative #108]– Just compensation for
reduction in fair market value by government law or
regulation

•    The Colorado Farm Bureau is the sponsor of this
     constitutional amendment

                                                                                                                                                     4
October 2018 - BMO 2018 Global Energy Leadership Forum NYSE American: SRCI - SRC Energy Inc
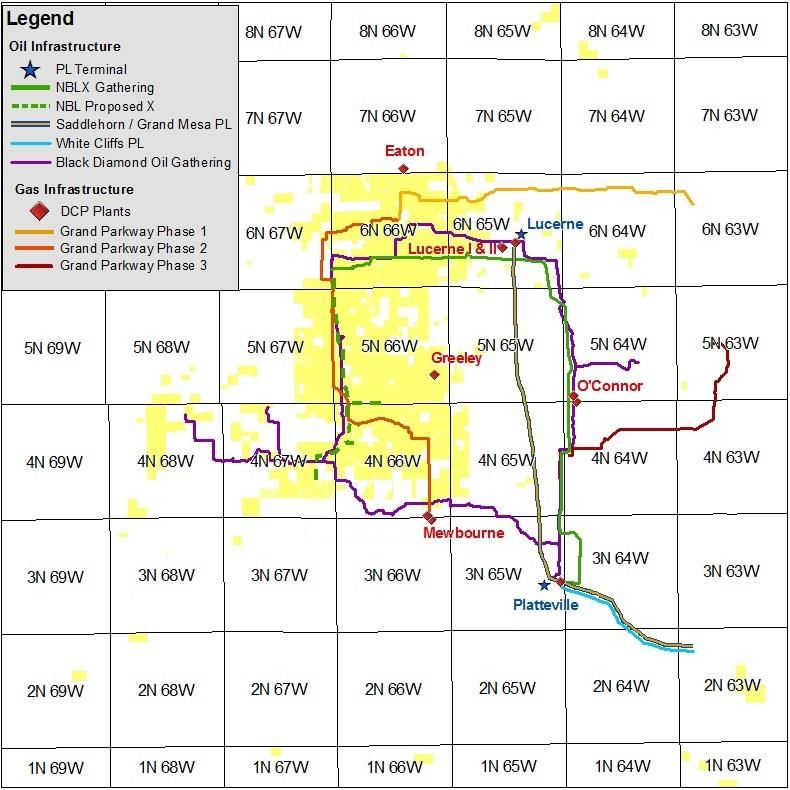
Health, Safety and the Environment – SRC’s highest priority

  ▪ Engaged at multiple levels
       ▪   Front Range Emergency Response Committee
       ▪   COGA – Operational Safety, Urban Operations, HSE Committees
       ▪   Rocky Mountain HSE Peer Group
       ▪   DJ Basin Safety Council and Operators Consortium

  ▪ Active vertical well remediation and reclamation program
       ▪   ~160 wells in 2017 with ~500 acres reclaimed
       ▪   Similar program underway in 2018

  ▪ Focus on safety
       ▪   Incident Reporting & Tracking System
       ▪   Community & First Responder Engagement
       ▪   Stop Work Authority – any worker, any time
  ▪   Reduce emissions
       ▪   Tier-4 (low emission) engines utilized in completion fleets
       ▪   Significant use of vapor recovery equipment in facilities
       ▪   Direct pipeline take-away reduces truck traffic and vehicle emissions

                                                                                   5
October 2018 - BMO 2018 Global Energy Leadership Forum NYSE American: SRCI - SRC Energy Inc
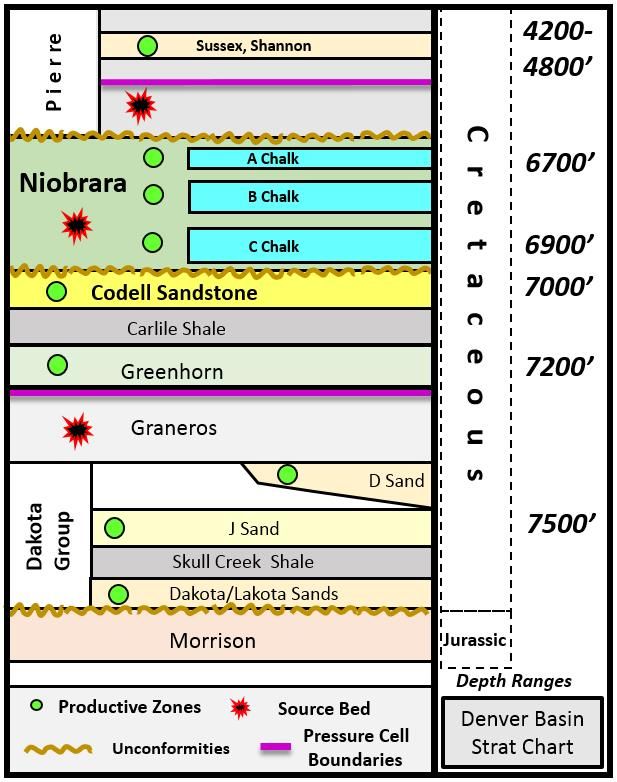
Midstream – Delivering Affordable Energy to Local
Residents and Beyond
                               DCP Midstream
             5
                                          ▪    Mewbourn 3 processing plant with 200 MMcf/d currently
                                               filling capacity
                                          ▪    O’Connor 2 with 200 MMcf/d of processing capacity plus 100
                                               MMcf/d of bypass capacity is under construction and
                                               expected to be in service Q2 of 2019
                                          ▪    Bighorn permitted for 1 Bcf/d of capacity to begin taking gas in
                                               2020
                                          ▪    Gas and NGL pipeline expansions out of the DJ Basin aligned
                                               with processing
                         1
                               Noble Midstream
                                          ▪    Gathering oil and water in current development area

                     3   2
                                          ▪    Oil trunk line being extended south through footprint,
                                               providing access to multiple sales points

                               #      Plant Name                 Operator                  In-Service          Capacity MMcf/d
                 4
                               1      O’Connor 2 (Plant 11)      DCP                       Q2 2019             200 +100 of bypass

                               22     Bighorn (Plant 12)         DCP                       2020 & beyond       1Bcf/d

                               3      Latham I/II                Western Gas Partners      Q1/Q3 2019          200/200

                               4      Ft. Lupton                 Discovery Midstream *     Late 2018/2019      200/450

                               55     Pierce                     Rimrock                   2019                200

                                    * Discovery Midstream was recently acquired by a joint venture between KKR and Williams

                                                                                                                                    6
October 2018 - BMO 2018 Global Energy Leadership Forum NYSE American: SRCI - SRC Energy Inc
Maximizing NPV Per Section

                                                                                              Niobrara/Codell
                                                $50,000                                                                       12,000

 ▪ Optimizing NPV per section requires
   balancing well density per section against   $45,000                                                                       10,000

                                                   Value(NPV-10)/Recovery (MBOE)
   EUR per well
                                                $40,000                                                                       8,000
 ▪ Maximizing corporate returns focuses on
   the development of the overall leasehold     $35,000                                                                       6,000
   position versus simplified well-level
   economics                                    $30,000                                                                       4,000

 ▪ SRC’s contiguous leasehold position
                                                $25,000                                                                       2,000
   enhances efficiency
                                                $20,000                                                                       -
                                                                                   2 10   5     8   1125   14      17    20
                                                                                                                        40

                                                                                               Wells Per Section

                                                                                                                                       7
October 2018 - BMO 2018 Global Energy Leadership Forum NYSE American: SRCI - SRC Energy Inc
Corporate Execution
                                                                                                                                                   Net Daily Production (MBOE/D) (1)
  ▪ Growth of acreage footprint and drilling locations                                                                                                                                     52
    with longer laterals is supportive of efficient                                                                                                                          47

    production and reserves growth                                                                                                                                                         48
                                                                                                                                                                      34

  ▪ Effective management of capital and cost structure
                                                                                                                                                    12
    leading to balancing of cash flows

                                                                                                                                                   2016           2017     H1 2018      2018 Est.

   D&C Capex vs EBITDA ($MM)                                                         Locations / Wattenberg Acreage                    (2)               Proved Reserves (MMBOE) (1)
                                                                            2,000                                                        100,000
                                                                                                                             ~90,000                                                 227
   CAPEX                                     $480 - $540                                           Acreage                                                 PUD
                                                                                                                             ~1,700                        PDP
   EBITDA                $461                                               1,600                  Locations                             80,000
                                                                                                            ~69,300
                                                                                                                                                                                     38%
                                                  $447
                                              H1 EBITDA                     1,200                                                        60,000
                                              Annualized                                                             ~1000
                                                                                          ~41,000
                        $283                                                  800                                                        40,000                  93

                                                  $223                                    ~600                                                                   19%
   $131                                                                                                                                                                              62%
                                               H1 EBITDA                      400                                                        20,000
                                                                                                                                                                 81%
   $65
                                                                                 0                                                       0
   2016                  2017                 2018 EST.                                      2016 (3)                2017    2018                           12/31/2016            12/31/2017

            (1)   2016 production data converted to 3-stream using 3.5 GPM wet gas yield and 25% gas volume shrink
            (2)   Acreage and location counts based on values at the beginning of the period
            (3)   Well counts in 2016 are normalized to ML equivalents

                                                                                                                                                                                                    8
2018 Exploitation Program
                  2018 Guidance
   Total production of 48-52 Mboe/d

   D&C Capex of $480-$540 MM

   2018 operations funded by operating cash flow
    and existing liquidity

   Protect capital program by hedging 30%-50% of
    estimated production

   Drill ~117 gross (100 net) wells and complete 116
    gross (103 net) wells in 2018

   D&C costs of ~$4.2 MM for 8,000’ ML wells and
    ~$5 MM for 10,000’ LL wells

       Attractive returns across the GOR spectrum

       2,000
Current D&C Operations

                                                                                                                                                          Troudt Pad I: 12 (~12 Net) 12 LL
                                                                                                                                                           wells
                                                        Waiting on             Troudt Pad II: 12 (~12 Net) 12                   Completion                Harvesters State Pad: 12 (~11
                McNear Pad: 12 (~11 Net) LL
Drilling                                                                        ML wells                                                                   Net) ML wells
                 wells                                  Stimulation                                                             in Progress
24 wells        Lincoln Pad: 12 (~8 Net) LL wells
                                                                               Greeley Rothe Federal: 12 (~8                                              Boomerang Pad: 16 (~13 Net)
                                                            24 wells            Net) LL wells                                     53 wells
                                                                                                                                                           12 ML wells & 4 LL wells
                                                                                                                                                          Donn Pad: 13 (~13 Net) LL wells

                                                                                                                On production earlier in 2018: 12 LL Leffler, 12 LL Ag, 12 ML Goetzel, 18 SL & LL Falken

 Standard Completion                    Niobrara     Niobrara          Comments                                                                                                                   4200-
       Design                          A & Codell     B&C                                                                                                                                         4800’

Average stage length                        200’       200’            36 stages in ML, 50 stages in LLs and 60 stages in XLs
                                                                                                                                                                                                  6750’
Perf clusters/stage                           4         4              Actively managing entry points to improve proppant
                                                                       distribution and stimulated reservoir volume
Average Proppant load                     800#/ft    1,300#/ft         Engineered completions will pinpoint proppant                                                                              7050’
                                                                       placement to optimize productivity
Surfactant                                   yes       yes             Surfactant designed for higher GOR reservoirs                                                                              7200’

Frac Fluid                              Slickwater    Hybrid           Experimenting with fluid designs in some zones
Other completion details:
                                                                                                                                                                                                  7500’
▪ Utilize monobore, plug & perf designs with the added implementation of dissolvable plugs

▪ Utilizing a completion fleet with integrated noise reduction technology in an effort to further reduce environmental
  impact in urban areas

                                                                                                                                                                                                           10
Appendix

           11
Operational and Financial Performance

Commodity Mix                                                     Cash Cost ($ / Boe)
                      Gas       NGLs      Oil                                          Cash G&A     Production Taxes   LOE

    36%     35%         33%              31%      31%       34%
                                                                                                                                 $7.59
                                                                     $6.71     $6.54                      $6.56         $6.89
                        20%              18%      19%                                                                            $1.44
    21%     22%                                             23%                             $5.58
                                                                               $1.66                      $1.39         $1.67
                                                                     $3.46                  $1.47                                $3.47
                                                                               $3.19                      $3.63         $3.29
                        47%              51%      50%                $0.92                  $2.71
    43%     43%                                             43%
                                                                     $2.33                                              $1.93    $2.68
                                                                               $1.69        $1.40         $1.54

   1Q17     2Q17        3Q17            4Q17      1Q18     2Q18      1Q17      2Q17         3Q17          4Q17          1Q18     2Q18

Cash Margin ($/Boe)                                               Net Leverage (Net Debt / LTM EBITDAX)

                                                                                                          1.8x
                                                $29.15
                                       $26.79            $26.33
                       $22.31                                                                                          1.3x
   $20.70                                                                                                                       1.2x
            $18.74                                                                          1.1x
                                                                                1.0x

                                                                      0.5x

    1Q17    2Q17       3Q17            4Q17     1Q18     2Q18         1Q17     2Q17        3Q17          4Q17          1Q18     2Q18

                                                                                                                                         12
Reserves Report Summary
Ryder Scott Reserves – YE 2017 (1)
   Proved Reserves by Category                                                Proved Reserves by Commodity                 Pre-tax PV-10 by Category (2)

                                                                                 NGL 28%                       OIL 31%
                                              PDP 33%

                 227                                                                              227                    PUD 43%
                                                                                                                                    $1.8 B          PDP 49%
                MMBoe                                                                            MMBoe
   PUD 62%
                                            PDNP 5%

                                                                                                     GAS 41%                       PDNP 8%

           ▪ Reserves based on a 3-year development plan
           ▪ Represents development of approximately 15% of identified locations

           (1) Reserves per SEC price deck reserve report representing pricing of $51.34 WTI / $2.98 HH
           (2) Reserves split based on NYMEX pricing at 1/2/2018

                                                                                                                                                              13
Delivering Long-Term Shareholder Value

                                                       Full-Cycle NPV & IRR Per Well Economics
                                                                                       NPV ($MM)
                                 Acreage Cost                     ~600 MBOE                             ~800 MBOE    ~1 MMBOE
                                    $20k/acre                           $2.5                                  $3.5     $4.7
                                    $15k/acre                           $2.7                                  $3.9     $4.9

                                                                                                  IRR
                                 Acreage Cost                     ~600 MBOE                             ~800 MBOE    ~1 MMBOE
                                    $20k/acre                           45%                                   53%      57%
                                    $15k/acre                           50%                                   59%      64%

                              ▪ Full cycle Wattenberg well economics are
                                competitive with other major basins

     Note:     Price Deck: Oil = $60 Flat, NGL = 30% of WTI, Natural Gas = $3.00 Flat
               Assumed differentials: oil = $6.50 / NGL = 17% / gas = $0.45
     •   Full cycle NPV and IRR information assumes $4.2 MM ML lateral well costs and $5 MM LL lateral well cost.
     •   Rate of return and NPV estimates do not reflect corporate, general and administrative expenses.
     •   Estimated EURs may not correspond to estimates of reserves as defined under SEC rules.
     •   Production volumes reflect 3-stream equivalent

                                                                                                                                14
Hedging Summary as of October 2018
                                                            2018                                                  2019
                                                     4th QTR     Total               1st QTR     2nd QTR        3rd QTR       4th QTR          Total
               Oil Costless Collars
                  Volume (Bbl)                          920,000  920,000              540,000  546,000 552,000 552,000  2,190,000
                  Ceiling Price per Bbl             $     61.29 $ 61.29          $      74.31 $ 74.31 $ 74.31 $ 74.31 $     74.31
                  Floor price per Bbl               $     43.63 $ 43.63          $      55.00 $ 55.00 $ 55.00 $ 55.00 $     55.00

               Gas CIG Costless Collars
                 Volume (MMBtu)                     1,380,000 1,380,000
                 Ceiling Price per MMBtu            $    2.82 $    2.82
                 Floor price per MMBtu              $    2.25 $    2.25

               Gas CIG Price Swaps
                 Volume (MMBtu)                                                   1,800,000 1,820,000 1,840,000 1,840,000    7,300,000
                 Price per MMBtu                                                 $    (0.76) $  (0.76) $  (0.76) $  (0.76) $     (0.76)

               Propane Price Swaps
                  Volume (Gallons)                  3,864,000 3,864,000           7,560,000 7,644,000 7,728,000 7,728,000 30,660,000
                  Price per Gallon                  $    0.80 $    0.80          $     0.89 $    0.89 $    0.89 $    0.89 $     0.89

                   * Oil price is based on NYMEX WTI, gas price is based on NYMEX Henry Hub or CIG, and propane is based on Mont Belvieu

     Disclosure on Derivative Instruments

     The Company has entered, or may enter in the future, into commodity derivative instruments utilizing, price swaps, collars, put or call options to reduce the effect of
     price changes on a portion of future oil and gas production. The Company’s commodity derivative instruments are measured at fair value and are included in the
     condensed balance sheet as derivative assets and liabilities.

     All derivative positions are carried at their fair value on the condensed balance sheet and are marked-to-market at the end of each period. Both the unrealized and
     realized gains and losses resulting from the contract settlement of derivatives are recorded in the gain on derivatives line on the condensed statement of operations.

     The Company has a master netting agreement on each of the individual oil and gas contracts and therefore the current asset and liability are netted on the
     condensed balance sheet and the non-current asset and liability are netted on the condensed balance sheet.

                                                                                                                                                                               15
Adjusted EBITDA Reconciliation

                                                       SRC ENERGY INC.
                                       RECONCILIATION OF NON-GAAP FINANCIAL MEASURES
                                                   (unaudited, in thousands)

                                                                        Three months ended         Six months ended
                                                                      6/30/2018     6/30/2017   6/30/2018      6/30/2017
Adjusted EBITDA
  Net Income (loss)                                                   $ 49,624     $ 27,936     $ 115,420     $ 47,816
  Add back:
     Depreciation, depletionand amortization                             41,877        26,427      78,958        39,656
     Full cost ceiling impairment                                             0             0           0             0
     Income tax expense (benefit)                                         3,347             0       9,158             0
     Stock based compensation                                             3,146         2,685       5,942         5,360
     Mark to market of commodity derivatives contracts:
        Total (gain) loss on commodity derivatives contracts             14,294      (1,328)       20,075       (4,707)
        Cash settlements on commodity derivatives contracts              (4,566)        153        (6,121)         234
        Cash premiums paid for commodity derivatives contracts                0           0             0            0
     Interest, net                                                           (5)        (20)          (14)         (31)
  Adjusted EBITDA                                                     $ 107,717    $ 55,853     $ 223,418     $ 88,328

                                                                                                                           16
PV-10 Reconciliation

                                                     SRC ENERGY INC.
                                     RECONCILIATION OF NON-GAAP FINANCIAL MEASURES
                                                 (unaudited, in thousands)

                                                                             12/31/2017    12/31/2016   12/31/2015
  Standardized measure of discounted future net cash flows:
            Add: 10 percent annual discount, net of income taxes            $ 1,600,675    $ 434,261    $ 390,953
            Add: future undiscounted income taxes                             1,267,258      427,587       408,939
            Future pre-tax net cash flows                                       285,349       90,195       108,172
            Less: 10 percent annual discount, pre-tax                         3,153,282      952,043       908,064
                                                                             (1,396,998)    (475,695)     (469,921)
  PV-10                                                                     $ 1,756,284    $ 476,348    $ 438,143

                                                                                                                      17
You can also read