CITYCON PRESENTATION Q2/2016

Page created by Dorothy Curry
 
CONTINUE READING
CITYCON PRESENTATION Q2/2016
CITYCON PRESENTATION
      Q2/2016
CITYCON PRESENTATION Q2/2016
LEADING OWNER, MANAGER AND DEVELOPER OF
SHOPPING CENTRES IN THE NORDICS AND BALTICS
    KEY FIGURES 30 JUNE 2016
    – 52 shopping centres1)                     – Market cap EUR 2 billion
    – 13 managed/rented assets – Moody’s Baa1
    – Gross leasable area                       – Standard&Poor’s BBB
                                                                                                                                FINLAND
      1,190,390 s.qm.
    PORTFOLIO VALUE                                                                                NORWAY
                    Baltics and
                                                                                                                                 20
                     Denmark
                        7%                                                                                                                2
                                                                                                          20                9
                                                                                                                                  ESTONIA
                                                                                                                   SWEDEN
                                                Finland
                                                  34%
         Sweden1)
           29 %
                          4.7
                         EUR billion
                                                                                                DENMARK
                                                                                                               1
                                                                   Number of shopping centres

                                                                 1) Including Kista Galleria
                                       Norway
2                                       29%
CITYCON PRESENTATION Q2/2016
CREATING URBAN CROSSPOINTS

          Right assets                             Responsible shopping
    Pure retail player focusing
                                                    centre management
   on necessity-based shopping             Commitment to sustainable management
     centres in growing urban              and development and contributing to the
               areas                        communities surrounding our shopping
                                                          centres
                           WHAT                OUR
                           WE DO               APPROACH

     Strong capital base                                  Retail experts
                                      OUR
         Allocating capital        RESOURCES        Using our retail expertise
   efficiently and maintaining                    at each stage of the shopping
   a conservative gearing level                   centre value chain in order to
       in order to maximize                         create pleasant shopping
              returns                                      experiences
CITYCON PRESENTATION Q2/2016
TRUE PAN-NORDIC LEADER
RETAIL GLA (THOUSAND SQ.M.)1)

                         360
 FINLAND                                 140             125             120             110

                          360            350
SWEDEN                                                   200             200             200

                         1 290
                                                                                                                                      #3   #1
NORWAY

                                                                                                                 #2
                                          400

                                                                                                                                                #2
                                                         325             175             110

                           145
ESTONIA                                         110
                                                                    80                  60

    1)Source: Company reports, Pangea Property Partners analysis, as per April 2016. Includes only majority-owned shopping centres.
4
    Includes some assumptions on retail proportion out of total GLA, where retail data not available.
CITYCON PRESENTATION Q2/2016
URBAN CROSSPOINTS
DRIVEN BY STRONG DEMOGRAPHICS

                                CORE ASSETS:
                                –Urban environments,
                                 located where people live
                                 and work
                                –Strong population growth
                                 and natural footfall
                                –Integrated with public
                                 transportation
                                –Shared access to
                                 education, health care,
                                 culture, municipal services

5
CITYCON PRESENTATION Q2/2016
CORE PORTFOLIO OF GROCERY-ANCHORED
    SHOPPING CENTRES
              RENTAL INCOME BY CATEGORY
                      31 DEC 2015
                          4%      2%

               7%
                                               25%    Fashion

                                                      Groceries
        10%
                                                      Leisure and home
                               Rental income          supplies
                                                      Services and offices
                                224                   Health and beauty
                                EUR million
       10%
                                                      Cafés and restaurants

                                                20%   Other specialty stores

                                                      Department stores

                    21%
6
CITYCON PRESENTATION Q2/2016
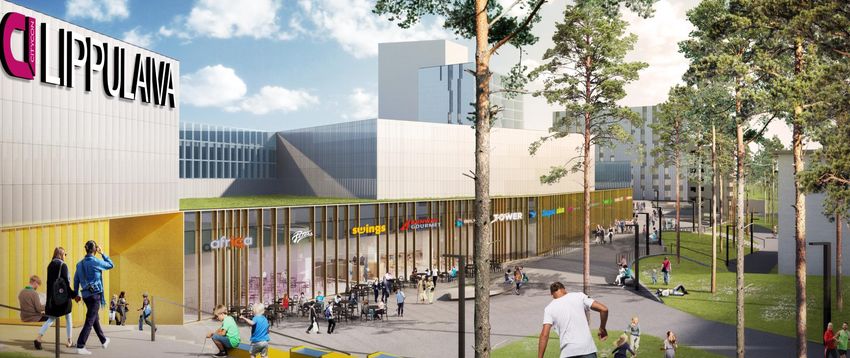
CITYCON’S FIVE MAIN CORE ASSETS

    Kista Galleria           Iso Omena            Liljeholmstorget Galleria   Koskikeskus                   Herkules

                              City            GLA (sq.m.)          Fair value, MEUR         Visitors, million          Sales, MEUR
Kista Galleria                Stockholm           95,300                       631                        19                  216
Iso Omena                     Helsinki area       62,700                       443                         8                  182
Liljeholmstorget Galleria     Stockholm           41,000                       292                        10                  147
Koskikeskus                   Tampere             33,000                       185                         6                  109
Herkules                      Skien               49,700                       184                         3                  131
Note: Figures are for 2015
7
CITYCON PRESENTATION Q2/2016
URBANISATION & OMNICHANNEL DRIVE RETAIL
RETAIL TRENDS                        NORDIC CAPITALS FASTEST GROWING IN EUROPE
                                                                                 CITYCON’S RESPONSE
                                        Oslo                        20.3
                                  Stockholm                        18.3
                                Copenhagen                   14.7
URBAN            MORE ELDERLY        Helsinki               13.1                   URBAN CROSSPOINTS                      90% main cities
                  & SINGLE
GROWTH           HOUSEHOLDS
                                 Amsterdam
                                     London
                                                       11.2
                                                       11.2
                                                                                   where people live and work            65% capital cities
                                       Paris          8.9
                                      Berlin    2.7

                                                                                                                        MULTIFUNCTIONAL
URBAN            MORE THAN                 • Convenience
                                           • Social experience                                                          MAINSTREAM RETAIL
LIFESTYLE        SHOPPING                  • Price consciousness                                                          More cafés and
                                                                                                                          entertainment
                                                                                               100%

FOCUS ON           Increasing                                  Consumers             RESPONSIBLE SHOPPING
                 demand from                                    drawn to             CENTRE MANAGEMENT                        66%
SUSTAINABLE       tenants and                                  sustainable              at the heart of our                   BREEAM
BEHAVIOUR           partners                                    retailers                   operations                        certified

                                                                                       LOYALTY BUILDING &                    Growing
ONLINE CREATES         ENRICHED CUSTOMER DATA                                           PERSONALISATION
                                                                                                                          ONLINE CITYCON
                                                                                   shopping centre apps, gift cards &
OMNICHANNEL           TECHNOLOGICAL INNOVATIONS
                                                                                    digital dialogue with customers        COMMUNITY
CITYCON PRESENTATION Q2/2016
SUSTAINABLE
SHOPPING CENTRE MANAGEMENT

              Acting as a sustainable business partner

           People                                   Environment
      An excellent place                         Energy-efficient and
      to work and to be          OUR APPROACH   environmentally sound
          proud of                                shopping centres

                                           SOLID
       Community &                        ECONOMY      Economy
      Companionship                                 Creating long-term
     Urban multifunctional                          shareholder value
  shopping centres with strong
     ties to the community
      Offering sustainable
   customer flows to tenants
CITYCON PRESENTATION Q2/2016
SUSTAINABLE MIND-SET –
  FORERUNNER IN THE NORDICS                                                         KEY RESULTS 2015

  >70% of Citycon’s shopping centres are BREEAM In-Use certified
         –most retail certificates in the Nordics
                                                                                    Energy
                                                                                    consumption,
                                                                                    kWh/sq.m.
                                                                                                      -6%
                                                                                                      (target -2%)
80%

60%
                                                                                    Recycling rate    95%
40%                                                                                                   (target >90%)

20%
                                                                                    Within top 10%
                                                                                    of reviewed
0%
       Dec.                     Dec.                            Dec.         Dec.
                                                                                    companies
       2014                     2015                            2016         2017

                                       Certified %   Target %

                                                                                    Among the top
  Target - majority of the portfolio has an environmental certification by          of the industry
  year 2017

  10
Q2/2016
STABLE RESULTS, COSTS SAVINGS PROGRAM IMPLEMENTED
HIGHLIGHTS Q2/2016

     STABLE FINANCIAL RESULTS DRIVEN BY GOOD PERFORMANCE IN SWEDEN AND
     NORWAY
     - EPRA Earnings +28% mainly due to the acquisition of Norwegian operations
     - EPRA EPS EUR 0.084 close to last year’s level with 40% more shares

     POSITIVE OVERALL LFL NRI AND IMPROVED OCCUPANCY
     - Adjusted like-for-like net rental income +0.9% including Norway and Kista Galleria 100%
     - Occupancy increased +30 bps to 96.5%

     SUCCESSFUL DISPOSAL OF NON-CORE ASSETS
     - 100 MEUR disposed at above IFRS fair value in 2016

     NORWEGIAN INTEGRATION COMPLETED
     - Reorganisation and cost savings programme to result in 5 MEUR additional savings in 2017

     OUTLOOK SPECIFIED
12   - EPRA EPS EUR 0.1575-0.1725
FINANCIAL HIGHLIGHTS

     MEUR                                          Q1-Q2/2016    %1)

     Net rental income                                   112.2   36.3

     Direct Operating profit                              98.4   35.8

     EPRA Earnings                                        74.6   29.9

     EPRA EPS (basic)                                    0.084   -7.0

     EPRA NAV per share                                   2.80   -6.3

     Fair value change                                    31.0      -

     Loan to Value (LTV), %                               45.4    9.5

     1) Change   from previous year (Q1-Q2/2015)
13
SUCCESSFUL INTEGRATION IN NORWAY
                                                             INITIAL TARGET           STATUS Q2/2016
                                                                                      Increased to
                        – Savings in Citycon Norway SG&A
     ORGANIZATION                                            ≥ 1 MEUR p.a.            approx. 3.5 MEUR p.a.
                          of ≥10%
                                                                                      on group level

                        – Tenanting, specialty leasing,
                                                             LFL NRI growth of        H1/2016 pro forma LFL
     OPERATIONS           marketing, digital optimisation
                                                             100 bps above CPI        NRI +3.0%
                        – Improved purchasing power

                        – Extension / (re)development
                                                             ≥150 bps over required
     (RE)DEVELOPMENTS     investments of approx.                                      On track
                                                             valuation yield
                          EUR 30–40 million p.a.

     FINANCE            – Lower average cost of debt,        ~ EUR 2-3 million p.a.   ~ EUR 6 million p.a.
     RESTRUCTURING        decreased net financing expenses   (tentative)

14
STABLE OVERALL OPERATING PERFORMANCE
POSITIVE OVERALL LIKE-FOR-LIKE NRI GROWTH
DRIVEN BY NORWAY AND SWEDEN

LIKE-FOR-LIKE NET RENTAL INCOME GROWTH                                                                           –Operating results reflect the general
                                                                                                                  performance of the main economies
                                                                                                                 –The standard like-for-like portfolio
                     4.5%
                                                                                        3.8%
                                                                                                                  includes only 42% Citycon’s portfolio
                                                                       3.0%
                                                                                                                 –Finland impacted negatively by main
                                                                                                         0.9%
                                                                                                                  properties being under
                                                                                                                  (re)development
                                                      -1.1%
                                     -2.9%
                                                                                                                 –Baltics impacted by increased
    -4.2%                                                                                                         competition
                                                                                                                 –The like-for-like NRI growth including
                                                                                                                  pro forma Norway and Kista Galleria
                                                                                                                  100% was 0.9%
   Finland         Sweden          Baltics &           Total        Pro forma          Kista          Adjusted
                                   Denmark                           Norway           Galleria          total    –The adjusted total including Kista
                                                                                      (100%)                      Galleria 50% was 0.7%
16 The width of each column refers to the weight of the business unit in the like-for-like portfolio
   Citycon’s ownership in Kista Galleria is 50%, but management follows it as if it was fully consolidated
OCCUPANCY REMAINS AT HIGH LEVEL > 96%
OCCUPANCY RATE

                                 96.8%              96.5 %
                         96.3%            96.2%
      95.7%      95.7%

      2012       2013    2014    2015    Q1/2016   Q2/2016

17
OVERALL STABLE SALES AND FOOTFALL DEVELOPMENT

LIKE-FOR-LIKE SHOPPING CENTRE SALES                                                        LIKE-FOR-LIKE SHOPPING CENTRE FOOTFALL

                                 3%

                                                                                  1%              0%                                           0%

                                                                                                              -1%

        -1%                                              -1%

                                                                                                                              -4%

       Finland                 Sweden           Baltics & Denmark               Total           Finland     Sweden     Baltics & Denmark      Total

                           Norway 3%              Kista Galleria -7%                                      Norway -2%     Kista Galleria -2%
18   The width of each column is weighted by the sales or footfall of the business unit.
SUCCESSFUL DELIVERY ON CITYCON’S DISPOSAL PLAN

                                           – Disposal of Magistral in
                                             Tallinn in February
                                           – Disposal of 5
                                             supermarket and shop
                                             properties in Finland in
                                             April
                                            100 MEUR divested at
                                           above IFRS fair value in
                                           Q1-Q2/2016
                                           – Citycon intends to
                                             divest an additional
                                             EUR 200-250 million
                                             within the coming 1-2
                                             years

19
DEVELOPMENT PORTFOLIO
(RE)DEVELOPMENTS PROGRESSING –
ISO OMENA FIRST PHASE OPENING WITH 95% LEASED

                                                                                         Expected          Cumulative
                                                           Area before/                                                 Yield on     Pre-leasing    Completion
                              City                                                    investment,         investment,
                                                            after, sq.m.                                                   cost1)                       target
                                                                                            MEUR                MEUR
                                                                                                                                      Part 1: 95%   Q3/2016 &
Iso Omena                     Helsinki area               63,300/99,000             182.0 (250.0)               121.5      6.0%
                                                                                                                                    Total SC: 90%     Q2/2017

Mölndal Galleria              Gothenburg                         - /24,000            60.0 (120.0)               21.2      7.0%             60%       Q2/2018

Porin Asema-aukio             Pori                        18,800/23,000                            40.0          25.8           -          100%       Q2/2017

1) Calculated   on total development costs, also including financing and Citycon internal costs.

21
RENEWED ISO OMENA SHOWS INTERNATIONAL APPEAL

                                        – Successful pre-leasing:
                                          4 shops still to be signed
                                          (out of total 66 shops)
                                        – 2000m2 Zara signed for
                                          phase 2 (only one in
                                          Western Helsinki area)
                                        – New M.E.E.T food
                                          concept - 50 cafés and
                                          restaurants in total
                                        – Creating an alternative
                                          for Helsinki CBD
                                        – Metro opening delayed
                                          to approx. end of the
                                          year

22
DEVELOPMENT PIPELINE –
URBAN LOCATIONS IN CAPITAL CITIES

                                          Area before/after,   Expected investment,        Target for project
                       City
                                                      sq.m.                   MEUR    initiation/completion

Tumba Centrum          Stockholm              25,500/35,500                     55               2016/2017

Lippulaiva             Helsinki area          19,200/42,000                160–180               2016/2020

Norwegian properties   Mainly Oslo area                                  30–40 p.a.

23
LIPPULAIVA – REBUILDING AN URBAN
EVERYDAY SHOPPING CENTRE IN WEALTHY ESPOONLAHTI

                                         – Exceptional pre-leasing
                                           result ≥ 50% signed in
                                           Q2
                                         – Temporary 10,000 m2
                                           centre fully leased
                                         – Start of demolition in
                                           mid-July 2017
                                         – Daily shopping concept
                                           in area with strong
                                           population growth
                                           (+18% in 10 yrs)
                                         – New metro line to be
                                           integrated in the centre

24
450 MEUR OF DEVELOPMENTS COMING ONLINE WILL STRONGLY
SUPPORT EARNINGS GROWTH
INVESTMENT VOLUMES THAT COME ONLINE
MEUR                                                                   Q2/2018
                                                                       Mölndal Galleria completion
500                                   Q2/2017
                                                                       + Buy-out of NCC's 50%
                                      Iso Omena part 2 completion
                                      Q3/2017
400                                   Straedet, buy-out from
                                      TK Development

300       Q3/2016
          Iso Omena part 1
          completion                                                –Average YoC 6.5% incl.
200       + Buy-out of NCC's 50%                                     financing and internal
                                                                     expenses
100                                                                 –Corresponds to approx. 30
                                                                     MEUR p.a. additional NRI
                                                                     when stabilised
     0
                   2016                        2017                             2018

25
KEY TARGET AREAS 2016 AND ONWARDS

     SUCCESSFUL COMPLETION OF ONGOING DEVELOPMENTS
     - 150-200 MEUR p.a.
     - Uplift in rental income and earnings 2017 onwards

     IMPROVE QUALITY OF THE PORTFOLIO
     THROUGH CONTINUED EXECUTION OF DIVESTMENT STRATEGY
     - Additional divestments of 200-250 MEUR, mainly in Finland

     OVERALL LONG-TERM LIKE-FOR-LIKE NRI GROWTH TARGET
     OF 100 BPS ABOVE INFLATION
     - After larger (re)developments have come online in 2017/2018

26
FINANCIAL OVERVIEW
FINANCIAL RESULTS

                                                                                       Q1-Q2/2016
     MEUR                         Q2/2016       Q2/2015 Q1-Q2/2016 Q1-Q2/2015
                                                                                        INCL. KISTA
     Gross rental income                62.2         46.6        125.4          92.6          142.8

     Net rental income                  57.0         42.6        112.2          82.3          127.6

     Direct Operating profit            50.5         37.6         98.4          72.5          113.1

     EPRA Earnings                      38.7         30.2         74.6          57.5            n.a.

     EPRA EPS (basic)                  0.043        0.047        0.084         0.090            n.a.

     EPRA NAV per share                 2.80         2.99         2.80          2.99            n.a.

      – Direct Operating profit and EPRA Earnings up by ≥ 30% due to Norwegian acquisition
      – EPRA EPS EUR 0.084, close to last years level
          – 40% increase in average number of shares due to rights issue in July 2015
      – Kista Galleria contributed to the IFRS based profit for the period by approx. 4.9 MEUR
        in Q1-Q2/2016
28
NET RENTAL INCOME +37%
FOLLOWING THE ACQUISITION OF NORWEGIAN OPERATIONS
NRI DEVELOPMENT
MEUR

                     +37.0            +0.5
                                                                                           0.2              112.2
                                                      -7.3            -0.5

        82.3

     Q1-Q2/2015   Acquisitions   (Re)development   Divestments   LFL properties   Other (incl. exchange   Q1-Q2/2016
                                     projects                                       rates & IFRIC 21)

29
POSITIVE RELEASING SPREAD IN SWEDEN AND
     NORWAY, NEGATIVE IN FINLAND AND ESTONIA
                                                                  Q1-Q2/2016        Q1-Q2/2015
     Average rent                                  EUR/sq.m.             22.4              21.9
     Average remaining length of lease portfolio       years              3.2               3.2

     Leases started                                      pcs              515               392
     Average rent of leases started                EUR/sq.m.             20.3              21.5
     Leases ended                                        pcs              646               492
     Average rent of leases ended                  EUR/sq.m.             20.3              20.5

     Leasing spread of renewals and re-lettings           %               -8.3                  -

     – Q2/2016 leasing spread was -2.7%, improving from Q1 (-11.6%). Including Kista Galleria
       (100%) the leasing spread was +0.2%
     – Q1-Q2/2016 leasing spread including Kista Galleria (100%) was -6.2%. Excluding one large
       renewal in a non-core property outside Helsinki the leasing spread was -2.4%
30
POSITIVE VALUATION DRIVEN BY NORWAY AND
     SWEDEN
     FAIR VALUE CHANGES, MEUR                Q2/2016    Q2/2015       Q1-Q2/2016    Q1-Q2/2015

        Finland                                  -6.9      -14.3            -15.2         -17.0

        Norway                                    0.2             -          24.3                -

        Sweden                                   12.9       14.6             21.8          18.1

        Baltics & Denmark                        -1.6        1.6              0.2           2.0

     Total                                        4.7        1.8             31.0           3.0

     WEIGHTED AVERAGE YIELD REQUIREMENT, %                  30 JUN 2016             30 JUN 2015

        Finland                                                       5.8                   6.1

        Norway                                                        5.2                        -

        Sweden                                                        5.3                   5.6

        Baltics & Denmark                                             6.7                   7.0

     Average                                                          5.6                   6.1

     – Fair value change for Q1-Q2/2016 including Kista Galleria (100%) was 34.9 MEUR

31
INCOME STATEMENT
MEUR                                          Q2/2016    Q2/2015    Q1-Q2/2016    Q1-Q2/2015       %
Gross rental income                              62.2       46.6         125.4          92.6    35.4

Service charge income                            20.2       13.6          40.2          27.6    45.5

Property operating expenses                      -25.1      -17.2         -52.9         -37.4   -41.5

Other expenses from leasing operations            -0.2       -0.4          -0.6          -0.6    1.6

Net rental income                                57.0       42.6         112.2          82.3    36.3

Administrative expenses                           -7.3       -5.6         -14.8         -11.2   32.2

Other operating income and expenses               0.8        0.6           1.0           1.3    -27.0

Net fair value gains on investment property       4.7        1.8          31.0           3.0        -

Net gains on sale of investment property          3.5        0.0           3.5           -0.4       -

Operating profit                                 58.6       39.4         132.9          75.1    76.9

Net financial income and expenses                -13.0       -7.1         -26.5         -16.3   62.4

Share of profit/loss of joint ventures            -0.2       3.8           3.8           7.3    -48.2

Profit/loss before taxes                         45.4       36.0         110.2          66.1    66.7

Profit/loss for the period                       37.5       35.4          95.3          62.1    53.5

32
EPRA NAV IMPROVED DUE TO POSITIVE RESULTS
SUPPORTED BY FAIR VALUE GAINS
CHANGE OF NET ASSET VALUE (EPRA NAV)
EUR, per share
                                                                 +0.02
                             +0.11            +0.00

                                                                                                          0.01     2.80
                                                                                       -0.07
        2.74

       Q4/2015            EPRA Earnings   Indirect result   Translation reserve Dividends and equity      Other   Q2/2016
                                                                                     return paid
                                                                          Q2/2016                      Q2/2015              2015
EPRA NAV per share, EUR                                                        2.80                       2.99               2.74
EPRA NNNAV per share, EUR                                                      2.42                       2.64               2.46

33
STRONG BALANCE SHEET

MEUR                                         30 JUN 2016    30 JUN 2015    31 DEC 2015

Investment properties                             4,110.0        2,819.6        4,091.6

Total non-current assets                          4,590.8        3,046.8        4,573.6

Investment properties held for sale                 21.3           13.8             1.7

Total current assets                               116.3           81.0           89.1

Total assets                                      4,728.4        3,141.6        4,664.4

Total shareholders’ equity                        2,290.0        1,630.9        2,245.5

Total liabilities                                 2,438.4        1,510.7        2,418.8

Total liabilities and shareholders’ equity        4,728.4        3,141.6        4,664.4

34
FINANCING OVERVIEW
FINANCING KEY FIGURES –
NO MAJOR DEBT TRANSACTIONS IN Q2

KEY RATIOS                                                                 30 JUN 2016    30 JUN 2015    31 DEC 2015

Interest bearing debt, fair value                                  MEUR         2,055.5        1,286.4        2,037.1

Available liquidity                                                MEUR          384.6          343.6          377.1

Average loan maturity                                              years            5.0            5.3            5.5

Interest rate hedging ratio                                           %           84.6           81.5           84.8

Weighted average interest rate1)                                      %           3.02           3.39           3.04

Loan to Value (LTV)                                                   %           45.4           41.5           45.7

Financial covenant: Equity ratio (> 32.5%)                            %           48.5           52.0           48.3

Financial covenant: Interest cover ratio (> 1.8)                      %             3.6            4.0            3.8

36   1) Including   cross-currency swaps and interest rate swaps
DEBT TYPE AND CURRENCY SPLIT
 DEBT BY TYPE                             DEBT BY CURRENCY
           Bank term loan
                 5%                          SEK
      CP
                                             17%
      9%

RCF
10%

            2,055.5         Bonds
                             77%                   2,055.5     EUR
                                                               54%
                  MEUR              NOK               MEUR
                                    30%

                                                             Part of EUR debt has been
                                                             converted to SEK and NOK
                                                             using cross-currency swaps

 37
BALANCED MATURITY PROFILE WITH LONG AVERAGE LOAN
MATURITIES AND LIMITED NEAR-TERM MATURITIES
DEBT MATURITIES
MEUR
700
                                                 628
600

500

400                                                                                                350
                                                                         300
300                                                     258    274
                                                                  242

200    177
                138                                                                                              151

100                   58                  75
                                     37
 0
         2016     2017     2018       2019          2020          2021     2022         2023         2024          2025   2025+

                                  Loans        Floating to fixed swaps   Undrawn loan facilities         Bonds

38
85% OF DEBT FIXED RATE,
LIMITED EXPOSURE TO INCREASED INTEREST RATES

                                   DEBT BY FIXING TYPE

                            Floating rate debt
                                  15.4%

                                                         Fixed rate
         Fixed rate swaps                                debt 70.0%
              14.6%

39
OUTLOOK 2016 SPECIFIED
DIRECT OPERATING PROFIT                                       EPRA EARNINGS
220                                                           170
                                               192.4-201.4                                                     141.8-150.8
200                                                           150
180                                    175.4                                                         130.8
                                                              130
160                  149.1   149.8
                                                              110                         99.7
140     135.7
                                                                              86.7
                                                                  90
120                                                                    69.3
100                                                               70

 80                                                               50
 60                                                               30
        2012         2013    2014      2015       2016E                2012   2013        2014        2015       2016E

– Direct Operating profit     + 17 to 26 MEUR (previously 16-30)                     The guidance includes the impact of
– EPRA Earnings               + 11 to 20 MEUR (previously 9-23)                      the divestments, weaker NOK and Iso
                                                                                     Omena metro delay
– EPRA EPS (basic)            0.1575-0.1725 EUR (previously 0.155-0.175)
40
PROPERTY PORTFOLIO
LEASE PORTFOLIO
OCCUPANCY RATE                                                     AVERAGE LEASE MATURITY
                                                                    Years
                                        96.8%       96.5%                3.5   3.5
                            96.3%                                                       3.2    3.3      3.2
     95.7%      95.7%

     2012       2013        2014        2015       Q2/2016              2012   2013     2014   2015   Q2/2016

– 4,054 lease agreements with an average length of 3.2 years
– Total GLA 1,190,390 sq.m.
– Rents linked to CPI (nearly all agreements)
– Annualised potential rental value for the portfolio is EUR 322.2 million

42
PROPERTY PORTFOLIO
                 TOP 5 TENANTS                                                       OCCUPANCY COST RATIO
                                                                            SHOPPING CENTRES, ROLLING 12 MONTHS
                                       PROPORTION OF
2015
                                     RENTAL INCOME, %                   Total                                       8.7%
Kesko                                               8
                                                                      Finland                                         9.3%
S Group                                             5
                                                                     Norway                                        8.3%
VarnerGruppen                                       4
                                                                     Sweden                                 7.1%
ICA Gruppen                                         3

NorgesGruppen                                       2       Baltics & Denmark                                                10.9%

Top 5, total                                       22                           0%      2%    4%    6%      8%        10%     12%

–The like-for-like properties accounted for 42.2% of the total portfolio measured by net rental income
–Actual rental contract level vs. valuation market rents is +1.7%
        –Indicates how much higher/lower Citycon’s actual rental level is compared to the market rents applied in the
         external valuations

43
VALUATION YIELD DEVELOPMENT
                            VALUATION YIELD DEVELOPMENT

 8%

 7%

 6%

 5%
      Q2/2011     Q2/2012              Q2/2013            Q2/2014            Q2/2015   Q2/2016

                Finland       Norway     Sweden    Baltics and Denmark   Total

44
BACK-UP INFORMATION

45
HISTORY OF CITYCON
+25 YEARS OF RETAIL EXPERIENCE AND PORTFOLIO GROWTH
     Foundation                                    International expansion                           New management and new strategy
     1988                                          2003                                              2011
        Founded by Sampo Pension Ltd, Imatran        Citycon business to include development as       Citycon’s new CEO, Marcel Kokkeel, joins
         Voima Oy, Rakennustoimisto A.                 well as owning, leasing and managing retail       the company
         Puolimatka Oy and Postipankki                 premises                                         New strategy re-defined core portfolio and
        Listed on Helsinki Exchange                  Ownership base changed as the former main         expansion plans
        Initial strategy was to invest                owners sold shareholdings and international
                                                       investors became interested
                                                                                                     2012
         in office assets
                                                                                                        First property acquisition in Denmark
     1998                                          2005
                                                      Citycon enters foreign markets
                                                                                                     2013
        New business concept focusing
         on retail properties                          by acquiring its first properties                Acquisition of Kista Galleria in Stockholm in
                                                       in Sweden and Estonia                             a JV with CPPIB
        Two large retail portfolio acquisitions
                                                                                                        Citycon receives investment
        Office portfolio divested                 2006                                                  grade credit ratings from S&P and Moody’s
     1999                                             Citycon continues to expand, acquiring
                                                                                                     2014
                                                       several retail properties in Sweden
        Carried out major EUR 320 million                                                              CPPIB becomes a strategic shareholder in
                                                       and its first property in Lithuania
         property deal, which almost doubled the                                                         the company with a 15% ownership
         value of Citycon's property assets        2007                                              2015
        Citycon became Finland's leading listed      Acquisition of Iso Omena in Finland              Acquisition of Norwegian Sektor Gruppen
         property investment company                                                                     for EUR 1.5 billion
         specialising in retail premises
                                                   2008
                                                      GIC becomes joint venture partner in Iso         Moody’s upgrades Citycon’s credit rating to
46                                                     Omena                                             Baa1
ECONOMIC OUTLOOK
                                                                                      INFLATION
GDP GROWTH                                                                            Change %
Change %
5%                                                                                    3%

4%
                                                                                      2%
3%

2%                                                                                    1%

1%
                                                                                      0%
0%

-1%                                                                                   -1%
           Finland    Norway         Sweden       Denmark       Estonia   Euro area              Finland       Norway       Sweden     Denmark       Estonia    Euro area
                          2014        2015      2016E     2017E                                                    2014      2015    2016E     2017E

UNEMPLOYMENT                                                                          PUBLIC SECTOR DEBT AS % OF GDP
Change %                                                                              Change %
12%                                                                                   70%

10%                                                                                   60%
                                                                                      50%
8%
                                                                                      40%
6%
                                                                                      30%
4%
                                                                                      20%
2%                                                                                    10%
0%                                                                                    0%
           Finland    Norway         Sweden       Denmark       Estonia   Euro area                  Finland              Sweden             Denmark           Estonia
                         2014        2015       2016E     2017E                                                    2014      2015    2016E       2017E
 47   Source: SEB Nordic Outlook & SEB Eastern European Outlook reports
OWNERSHIP, 30 JUNE 2016

     –Established and listed on Nasdaq            SHAREHOLDERS 30 JUNE 2016
      Helsinki in 1988
                                                Direct
     –Market cap EUR 1,824.5 million          registered
                                                30 .4%
                                                                      Nominee-
                                                                      registered
     –Total registered shareholders 10,343                              69.6%

     –Largest shareholders:
         –Gazit-Globe 43.5%
         –CPPIB 15.0%
         –Ilmarinen 7.13%
     –Included in e.g. FTSE EPRA/NAREIT Global Real Estate Index, Global Real
      Estate Sustainability Benchmark Survey Index, iBoxx BBB Financial Index
      (EUR 500 million bond)

48
DISCLAIMER
This document and the information contained herein is strictly confidential and is being provided to you solely for your information. This document may not be retained by you and neither this document nor
the information contained herein may be reproduced, further distributed to any other person or published, in whole or in part, for any purpose.

These materials do not constitute an offer or solicitation of an offer to buy securities anywhere in the world. No securities of Citycon Oyj (the “Company”) have been or will be registered under the U.S.
Securities Act of 1933, as amended (the “Securities Act”). Certain ordinary shares of the Company have been offered to “qualified institutional buyers” (as such term is defined in Rule 144A (“Rule 144A”))
under the Securities Act, in transactions not involving a public offering within the meaning of the Securities Act. Accordingly, such shares are “restricted securities” within the meaning of Rule 144 and may not
be resold or transferred in the United States, absent an exemption from SEC registration or an effective registration statement. There will be no public offering of the securities in the United States.

Subject to certain exceptions, neither this document nor any part or copy of it may be taken or transmitted into the United States or distributed, directly or indirectly, in the United States, or to any “U.S.
Person” as that term is defined in Regulation S under the Securities Act. Neither this document nor any part or copy of it may be taken or transmitted into Australia, Canada or Japan, or distributed directly or
indirectly in Canada or distributed or redistributed in Japan or to any resident thereof. Any failure to comply with this restriction may constitute a violation of U.S., Australian, Canadian or Japanese securities
laws, as applicable. The distribution of this document in other jurisdictions may also be restricted by law, and persons into whose possession this document comes should inform themselves about, and
observe, any such restrictions.

This document is not intended for potential investors and does not constitute or form part of any offer to sell or issue, or invitation to purchase or subscribe for, or any solicitation of any offer to purchase or
subscribe for, any securities of the Company, nor shall it or any part of it or the fact of its distribution form the basis of, or be relied on in connection with, any contract or investment decision.

No representation or warranty, express or implied, is made or given by or on behalf of the Citycon Oyj (the “Company”), or any of their respective members, directors, officers or employees or any other
person as to, and no reliance should be placed upon, the accuracy, completeness or fairness of the information or opinions contained in this document or any other information discussed orally. None of the
Company or any of their respective members, directors, officers or employees or any other person accepts any liability whatsoever for any loss howsoever arising from any use of this presentation or its
contents or otherwise arising in connection therewith.

This presentation includes forward-looking statements. The words “believe,” “expect,” “anticipate,” “intend,” “may,” “plan,” “estimate,” “will,” “should,” “could,” “aim,” “target,” “might,” or, in each case,
their negative, or similar expressions identify certain of these forward-looking statements. Others can be identified from the context in which the statements are made. By their nature forward-looking
statements are subject to numerous assumptions, risks and uncertainties. Although we believe that the expectations reflected in these forward-looking statements are reasonable, actual results may differ
materially from those expressed or implied by the forward-looking statements. We caution presentation participants not to place undue reliance on the statements

The information and opinions contained in this presentation are provided as at the date of this presentation and are subject to change
without notice. Such information and opinions have not been independently verified.

By attending the presentation you agree to be bound by the foregoing limitations.

49
citycon.com

 CONTACT INFORMATION

        Eero Sihvonen

THANK YOU.
        CFO, Exec. VP
   Tel. +358 50 557 9137

      Henrica Ginström
  VP, IR & Communications
   Tel. +358 50 554 4296
You can also read