OOh!media Covid-19 Pulse Report - Getting you ahead of the curve Making Brands Powerfully Unmissable
←
→
Page content transcription
If your browser does not render page correctly, please read the page content below

oOh!media
Covid-19 Pulse Report
Getting you ahead of the curve

Monday 17th August, 2020
Edition 15 – The changing path to ‘big ticket’ purchase

Making Brands Powerfully Unmissable
As another week passes with promising signs of Covid-19
    containment across much of the country, Australians
    outside of Victoria continue to re-emerge and celebrate
    missed freedoms of being outside the home for social,
    work and ‘life-admin’ activities.

    And while across the globe the race is on to find a
    vaccine, in the meantime Australians are adjusting
    behaviours beyond just their health and wellbeing, with
    marked adjustments now visible when it comes to the
    path to purchase and engagement in bigger-ticket
    purchases.

    In this week’s report we take a deep dive into Australians
    purchasing power in the second half of 2020 and how this
    differs across generations, trends into what categories are
    experiencing spikes as a result of pent-up demand and
    how adjusting behaviours have changed the path to
    purchase for bigger ticket items such as housing, larger-
    scale home renovations, car purchases and technology.

2
Trends covered

    Here and Now:
    Year on Year Out of Home audience
    volumes and movement trends

    A Look to the Future:
    Updated transactional and consumer
    attitudes and intentions data capturing
    adjusting behaviours on the path to
    purchase to bigger ticket items

3
Dspark
    data usage disclaimer

    Whilst we endeavor to share as much as we can        For Dspark, “Competitor” means each of the entities below and their Related
                                                         Bodies Corporate:
    with our valued partners, due to commercial          (a) Telstra Corporation Limited, only where the Customer Group is providing
                                                              services directly to Telstra Corporation Limited or its Related Bodies Corporate
    agreements the insights provided by Dspark                (services provided by a media agency or other intermediaries to Telstra
    within this Pulse report are not available for use        Corporation Limited or its Related Bodies Corporate shall not be deemed to be
                                                              in breach of clause 2.3);
    by competitors to Dspark.                            (b) Google LLC;
                                                         (c) Here Global B.V.;
                                                         (d) TomTom International BV;
                                                         (e) Any person or entity (other than Dspark or its Related Bodies Corporate) which
    We thank you for your understanding as we            is in the business of providing geospatial insights from telecommunications, GPS,
                                                         WiFi and other similar data that informs movement to the public, in the Territory,
    abide by our contractual agreements                  using the retail brand names used or owned by any of the persons or entities listed
                                                         above in (a) to (d), or the Related Bodies Corporate of any such person or entity;
                                                         and
                                                         (f) Any person or entity (other than Dspark or its Related Bodies Corporate) which is
                                                         in the business of providing geospatial insights from telecommunications, GPS, WiFi
                                                         and other similar data that informs movement to the public, in the Territory

4
Here & Now

National audience recovery buffered by return to outdoors in
    low Covid-19 impacted areas
                                                                                                         Year on Year
    Continued audience recovery across regional                                                          72% of 2019 levels
    Australia and low Covid-19 case affected states has
    buffered national audience levels in face of
    Victorian lockdowns.
    • In Victoria, in line with Stage 3 & 4 lockdown
      restrictions introduced, audience levels declined
      16% points week on week to 35% yoy.
    • Nationally, with near recovery in regional areas
      and across Qld, SA, and WA, audience impact of
      the Victorian lockdowns was limited to -7%
      decline week on week nationally
    • oOh! roadside and retail networks are at 72% of
      2019 audience levels, and in the past week
      delivered 364mil contacts nationwide
    • In markets outside of Victoria, audience recovery
      at 85% of 2019 levels.

      Source: Dspark data, Roadside and Retail locations, week ending Aug 10th 2020 vs. same week 2019
6
Recovery across the country

                                                                                      In markets outside Victoria:
    While markets outside of Victoria have
    experienced a halo effect as a result of the
    lockdowns, continued strength across regional
    and suburban areas as well as around essential
    services in all Retail centre types demonstrate
    either a return to previous behaviours or the
    adoption of a new normal, where people
    spend proportionately more time in local
    areas.
    Regional Retail audiences at 98% of 2019 levels
    and visitation to all Retail centre types at near
    90%+ recovery.
    Regional Roadside audiences at 88% of 2019
    levels and suburban audiences in metro
    markets performing strongly at 80% of 2019
    levels, +14% points higher than CBD

      Source: Dspark data, Roadside and Retail locations, week ending Aug 10th 2020 vs. same week 2019, NSW, Qld, SA, WA
7
oOh! roadside network delivering 200 million contacts
weekly
National audience recovery at 74% of 2019 levels, with the 74% of 2019 levels across oOh! Road locations
network delivering 200.9 million contacts weekly.
Victorian lockdown impact most pronounced in Melbourne.
In markets outside of Victoria roadside audience recovery
continues, hitting 83% of 2019 levels. In metro areas outside
of Melbourne audience recovery +13% points stronger at
78%.
Regionally, audience growth continues strongly with minimal
impact week on week (-1%) and continued trend towards
2019 levels as do assets in suburban areas where recovery is
14% points stronger than in CBD areas.
65% of 2019 levels in Metro areas
87% of 2019 levels in Regional areas
67% of 2019 levels in Suburban areas
53% of 2019 levels in CBD areas
Source: Dspark data, 3,200 Roadside locations nationally, week ending Aug 10th 2020 vs same week 2019
8oOh! retail network delivering 163 million contacts weekly
Audience recovery at 71% of 2019 levels across oOh! Retail
network, buoyed by continued recovery outside of Victoria,
71% of 2019 levels across oOh! Retail locations
and in regional areas where audiences hit 94% of yoy levels.
A weekly decline of -8% points occurred as a result of
lockdown in Victoria. In markets outside of Victoria audience
recovery continues at 88% yoy.
Recovery by centre type indicative of continued shopping
for essentials in local and medium centres and at large
centres within grocery precincts
66% of 2019 levels in 81% of 2019 levels in
Metro areas Local centres
94% of 2019 levels in 79% of 2019 levels in
Regional areas Medium centres
80% of 2019 levels in 65% of 2019 levels in
Homemaker centres Large centres
9 Source: Dspark data, 500+ Retail locations nationally, week ending Aug 10th 2020 vs same week 2019A Look to the Future The changing path to ‘big ticket’ purchase
Growing confidence in future purchasing power

                                                                                                                  Confidence towards future discretionary income (i.e. consumers
                                                                                                                  ability to buy products and services) hit a record high in late July
                                                                                                                  2020, with 84% of Australians confident their income will be
                                                                                                                  maintained or improve, 5% points higher than last 3 months prior1.

                                                                                                                   May 2020               June 2020             July 2020

                                                                                                                   79%                    78%                   84%

     Resilience towards current financial position
     Despite restrictions in Victoria driving consumer confidence                                                 Gen Z and Baby Boomers are the most confident with respects
     down 2.1pts to 86.5 according to ANZ-Roy Morgan Consumer                                                     to their discretionary income maintaining or improving in
     Confidence on August 8th/9th a level of optimism remains…                                                    comparison to Gen Y and Gen X Australians1.

                     26% of Australians say their families are currently                                           Gen Z            Gen Y             Gen X           Baby Boomers
                     ‘better off’ financially than this time last year, up 3%
                     points from the week prior2.                                                                  84%              78%               78%             82%

                     1 in 3 Australians expect their family to be ‘better off’                                    In late July 2020, over 1 in 3 Australians intended to continue with
                     financially this time next year compared to 22% who                                          purchases they had previously postponed during lockdown,
                     expect to be ‘worse off’2.                                                                   with intention to purchase extending to big ticket items such as
                                                                                                                  property, cars and technology1.

       Source: 1 oOh!media Pulse Report | Timing Wave 1: 1st- 4th May, 2020 Wave 2:18th- 19th May, 2020 Wave 3:
       1st -3rd June 2020 Wave 4: 24th - 28th July 2020| Research Panel: Dynata| Australians aged 16+, n=2,953,
11     Wave 1: n=2,212 / Wave 2: n=423/ Wave 3: n=318/ Wave 4: n= 773. Source: 2 ANZ-Roy Morgan Consumer
       Confidence, Finding No. 8490, August 11th, 2020 Source
Resilience of the Australian Property Market- All Dwellings
Market % Change Year on Year
Sydney +12.08
Melbourne +8.68
Brisbane (incl. Gold Coast) +4.46
Adelaide +2.44
Property search on the rise
Perth -2.54
Since April 2020, real estate website REA reported YOY spikes in online
Source: CoreLogic RP Data Daily Home Value Index: Monthly Values- 31 July 2020
search for properties2 (see graph right). REA also reports strong growth in
interest from overseas property buyers, with search activity up 42% since
March 2020 particularly from UK and US3 as they re-evaluate their
circumstances due to Covid-19, and the low Australian dollar and record
low interest rates prove an attractive value proposition4.
Adjusting behaviours to secure domestic property
Weekend of 8th/9th August, Melbourne, Brisbane, Adelaide and Canberra
recorded growth in clearance rates vs. same week last year5, with those in
Victoria adjusting to online platforms to ensure they secure property
despite stage 4 lockdown6.
Sydney property market recorded the highest residential listings since April
2020 and a clearance rate of 65.8%7.
Real Estate Agents in Queensland also report sales from other ESB states
have resulted in vendors purchasing properties without physical inspection8
to secure their slice of paradise.
“Online information, combined with easy access to independent
professionals like buyer’s agents, has made it a cinch to confidently buy in
national hotspots regardless of where you reside.9”
Source: 2 REA, Year on year change in searches for properties for sale, 27th July 2020. Source: 3 REA, Overseas Property Search
12 Report, July 2020. Source: 4 REA, Overseas expats buying in QLD to escape COVID-19, political unrest, 18th July 2020. Source: 5
CoreLogic, Auction Clearance Rates Buoyed By A Strong Preliminary Result Across Melbourne, 10th August. Source: 6 Source:
Business Insider, Melbourne homes are still selling via online auctions – but experts tip they'll soon 'slow to a crawl', 10th August 2020.
Source: 7 Domain, Sydney auction results remain steady as numbers grow on ‘lucky’ weekend, 9th August 2020. Source: 8
7News.com.au, Sydneysiders snap up property in the Sunshine State amid COVID crisis, 3rd August 2020. 9. Buying habits, the new
areas property investors are targeting, Realestate.com.au, 6 Aug 2020The Lab reports 40% of Australians are keen to embrace change
and see the pandemic as an opportunity to re-evaluate how
they’ve been living2.
At the end of July 2020, intentions to buy an apartment or home in
the future were driven by ambitious Gen Z and Y Australians keen
to get on the property ladder as well as Gen X families, whilst
super-charged Baby Boomers halt plans to expand their property
portfolio or downsize1.
Gen Z Gen Y Gen X Baby Boomers Covid-19 outbreak and subsequent lockdowns has
spurred Australians to re-evaluate the suburb they live in
26% 28% 18% 3%
At the end of last month, Gen Y Australians were 1.7x more likely
than the average Australian to intend to move suburbs within their
Last month Gen Y Australians also recorded the highest intentions to
city once life returns to a shape once known1.
pack-up life and move to a regional destination1, with the appeal of
employment with widely adopted working from home capabilities
Gen Z Gen Y Gen X Baby Boomers
and the attraction of a country lifestyle.
17% 24% 16% 4%
Gen Z Gen Y Gen X Baby Boomers
11% 26% 14% 6% Investors also putting aside familiarity for ‘potential’
In May 2020, while 36% of investors bought within 10km of their
primary residence, 30% bought more than 200km away, with the
Source: 1 oOh!media Pulse Report | Timing Wave 1: 1st- 4th May, 2020 Wave 2:18th- 19th May, 2020 Wave 3: latter averaging 293km away from their primary residence 3.
1st -3rd June 2020 Wave 4: 24th - 28th July 2020| Research Panel: Dynata| Australians aged 16+, n=2,953,
13 Wave 1: n=2,212 / Wave 2: n=423/ Wave 3: n=318/ Wave 4: n= 773. Wave 4 results displayed above. 3.
Buying habits, the new areas property investors are targeting, Realestate.com.au Aug 6 2020Intentions to renovate and redecorate continue…
At the end of July 2020, all generations were considering
improvements to their homes/apartments, with Australians under
40 lead the way with intentions to refresh the design of their
residence1.
Home improvement items
Research by Australian Houzz found only 2% of those in the midst of
planning or conducting home renovations or design projects cancelled Gen Z Gen Y Gen X Baby Boomers
their project during announcement of Covid-19 outbreak in March 20202.
55% 76% 74% 74%
“Many [renovators] adapted to the new environment by offering virtual
consultations or 3D floor plans [and] those who continued working on site Home decoration items
took all necessary protective measures to keep homeowners and workers
safe” Tony Been, Houzz ANZ3
Gen Z Gen Y Gen X Baby Boomers
Additionally 75% of homeowners reported that they are considering 80% 80% 75% 66%
changes that would help them enjoy their home more, with outdoor
(30%), kitchen (26%) and bathroom projects (24%) topping wish lists2.
Victorians are embracing DIY while in lockdown, but not without
Transactional data as at 3rd August shows spend across home renovation a few hiccups along the way!
categories up significantly year on year4:
Household appliances (+54%), Home and garden (+46%), Furniture (+37%) CBA credit and debit card spending over the week ending 7th
August 2020 recorded a 46% increase in household furnishing
Online homes retailer Kogan reported gross sales in July 2020 more than and equipment spend compared to same time last year4
doubled and gross profit jumped by 160% as consumers did more online
shopping because of the pandemic5. Embracing home renos has had unintended consequences,
with Monash University Accident Research Centre research
revealed 31% more Victorians have injured themselves working
Source: 1 oOh!media Pulse Report | Timing Wave 1: 1st- 4th May, 2020 Wave 2:18th- 19th May, 2020 Wave 3: 1st -3rd June 2020 Wave 4: 24th - 28th July 2020| Research with various tools or lawnmowers over the period6
14
Panel: Dynata| Australians aged 16+, n=2,953, Wave 1: n=2,212 / Wave 2: n=423/ Wave 3: n=318/ Wave 4: n= 773. Wave 4 results displayed above. Source: 2
Smartpropertyinvestment.com.au, Homeowners push ahead with renovation work, 8th July 2020. Research by Australian Houzz (between 29 June and 6 July), n=2200
Australian homeowners. Source: 3 thenewdaily.com, Australians used the lockdown to finish home renovations – here’s how you can join them, July 14th,2020 Source: 4
CBA spend data, week ending Aug 7 2020. Source: 5 Source: Abc.net.au, ASX rises strongly after Donald Trump signs off on new coronavirus stimulus, 10th August 2020,
Source: 6 Domain, DIY disasters: Injuries from home maintenance rise during lockdown, figures show, 11th July 2020Future car purchase intentions driven by Australians aged under 40
In July 2020, Gen Z and Y Australians were more likely than all
Australians to intend to buy a new car in the future, 1.5x and 1.4x
respectively.
Gen Z Gen Y Gen X Baby Boomers
As nation wide lockdowns saw a dip in new car sales over the 3 34% 33% 19% 16%
months to May 2020, consumer confidence in future finances
supported a rise in car sales recovering towards 2019 levels in
June and July 20202.
Brand awareness in face of stock shortages
With concerns of short-term stock shortages in the automotive
industry, Nielsen research shows that brands that go totally
dark for the rest of 2020 could be facing revenue declines of
up to 11% in 20213.
New Zealand Car Sales: A glimpse into the future
Kiwi car sector’s sales performance in July as “surprisingly
strong” as 12,263 new vehicles were registered during the
month – a rise of 366 units or 3.1% above the corresponding
month last year4.
“Returning cashed-up Kiwis and alternative spending to
international travel is thought to be behind the July result” NZ
Motor Industry Association chief executive David Crawford
Source: 1 oOh!media Pulse Report | Timing Wave 1: 1st- 4th May, 2020 Wave 2:18th- 19th May, 2020 Wave 3: 1st -3rd June 2020
15 Wave 4: 24th - 28th July 2020| Research Panel: Dynata| Australians aged 16+, n=2,953, Wave 1: n=2,212 / Wave 2: n=423/ Wave 3:
n=318/ Wave 4: n= 773. Wave 4 results displayed above. Source: 2 VFACTS, July 2020 as reported by Car Advice, 6 th August 2020.
Source: 3 AdNews, Auto ad spend was up in May and June, 20th July 2020. Source: 4 Goauto,com.au, New Zealand defies COVID-
induced car sales downturn with 3.1 per cent growth in July, 6th August 2020The changing technology landscape
“Many have suggested that in terms of technology usage and
development, Covid has had the effect of further accelerating
the evolution of brand-to-consumer and business-to-business
interactions and relationships. Innovations and trends that were
happening are happening faster now or are coming to a head” As recorded in July 2020, once all social distancing restrictions have
Alistair MacCallum, been removed…
Chief Executive at Kinetic Worldwide2
82% intend to buy electronic items such as mobile, laptop, TV1.
9 in 10 Australians agree Covid-19 will cause
technology and screens to become more integrated Of those looking to purchase electronics in the future, 1 in 2 intend to
in the lives of younger Australians3. buy from a physical store only, 19% solely from an online store and
the remaining 26% intending to blend bricks and mortar and online
purchases1.
Source: 1 oOh!media Pulse Report | Timing Wave 1: 1st- 4th May, 2020 Wave 2:18th- 19th May, 2020 Wave 3: 1st -
16 3rd June 2020 Wave 4: 24th - 28th July 2020| Research Panel: Dynata| Australians aged 16+, n=2,953, Wave 1:
n=2,212 / Wave 2: n=423/ Wave 3: n=318/ Wave 4: n= 773. Wave 4 results displayed above. Source: 2 Campaign
UK, OOH is back, but not as you know it, 10th August 2020. Source: 3 McCrindle Research, Recovering from
Covid-19, June 2020 SourceAs we see peaks in and continued intention to spend across big
ticket categories and the consumer journey to purchase
expedited based on Covid-19 lifestyle changes, brands have an
opportunity to meet customers where they are in their local areas
to maintain top of mind awareness and drive both online and
offline purchase.
At the end of July 2020, the bulk of metro Australians were More time spent in local areas means greater exposure to
frequenting their local area at higher or similar levels to before the localised outdoor advertising
Covid-19 outbreak…
57% are noticing ads on bus shelters and billboards in their local
70% maintained/ increased visitation for retail and area at or above pre Covid-19 levels1.
grocery shopping1.
“Covid is in-effect redefining OOH as a responsive, post code-
46% maintained/ increased visitation for socialising addressable medium able to localise campaigns fast at scale.
purposes including visiting pubs and/or restaurants1.
The huge investment in digitisation and automation pre-crisis means
68% maintained/ increased visitation for exercising OOH is well placed to deliver reactive, contextual and
and/or visiting parks, beaches1. geographically tailored campaigns that can respond to Covid
hotspots and behavioural events.
Brands are thinking about OOH not just as a national brand-builder
Source: 1 oOh!media Pulse Report | Timing Wave 1: 1st- 4th May, 2020 Wave 2:18th- 19th May, 2020 Wave 3: but as a localised performance driver”2
1st -3rd June 2020 Wave 4: 24th - 28th July 2020| Research Panel: Dynata| Australians aged 16+, n=2,953,
17 Wave 1: n=2,212 / Wave 2: n=423/ Wave 3: n=318/ Wave 4: n= 773. Wave 4 results displayed above for Metro
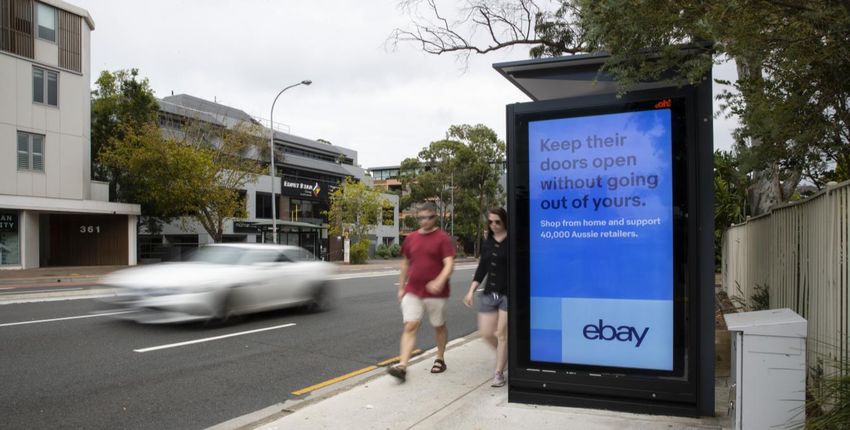
Australians only n=527. Source: 2 Campaign UK, OOH is back, but not as you know it, 10th August 2020. Alistair MacCallum, Chief Executive at Kinetic WorldwideWave 4
Gender: 50% 50%
Male Female
30%
Age: 27% 28%
7% 8%
Research Independent research panel provider, Dynata
Agency on behalf of oOh!media Pre Baby Boomers Baby Boomers Gen X (aged 40- Gen Y (aged 25- Gen Z (aged 16-
(aged 75+) (aged 56-74) 55) 39) 24)
Quantitative research via online consumer
Methodology panel. Nationally representative sample based
on age and geographic location Location:
Sydney metropolitan 22%
Sample Australians aged 16+ New South Wales (Not Sydney) 11%
Total respondents, n=3,726
Melbourne metropolitan 24%
Wave 1: n= 2,212
Victoria (Not Melbourne) 9%
Sample Size Wave 2: 423
Brisbane metropolitan 10%
Wave 3: 318
Queensland (Not Brisbane) 6%
Wave 4: 773
Adelaide metropolitan 5%
South Australia (Not Adelaide) 1%
Wave 1: 1st- 4th May, 2020 Perth metropolitan 8%
Wave 2: 18th- 20th May, 2020 Western Australia (Not Perth) 1%
Research Timings
Wave 3: 1st- 3rd June, 2020 Darwin metropolitan 1%
Wave 4: 24th- 28th July, 2020 Northern Territory (Not Darwin) 0.1%
Tasmania 2%
ACT 1%
Source: oOh!media Pulse Report | Timing Wave 1: 1st- 4th May, 2020 Wave 2:18th- 19th May,
2020 Wave 3: 1st -3rd June 2020 Wave 4: 24th - 28th July 2020| Research Panel: Dynata|
19 Australians aged 16+, n=2,953, Wave 1: n=2,212 / Wave 2: n=423/ Wave 3: n=318/ Wave 4: n=
773. Wave 4 results displayed right.You can also read