JPY - Losing Luster FX Insight - Maybank Singapore
←
→
Page content transcription
If your browser does not render page correctly, please read the page content below
July 19, 2018

                                   FX Insight
                                   JPY – Losing Luster
Macro | FX Research and Strategy

                                   USDJPY Forecast Revised Higher But Trajectory Maintained              Analysts
                                   We have revised our forecast for the USDJPY to take into account      Saktiandi Supaat
                                   USD strength amid Fed rate hike expectations and trade war            (65) 6320 1379
                                   concerns in the near term. We expect some mild USD                    saktiandi@maybank.com.sg
                                   retracement and BOJ policy normalisation expectations to weigh
                                                                                                         Leslie Tang
                                   on the USDJPY in the next 6 to 12-months. Accordingly, our 1-
                                                                                                         (65) 6320 1378
                                   month, 3-month, 6-month and 12-month outlook for the USDJPY
                                                                                                         leslietang@maybank.com.sg
                                   is 115, 115, 112 and 110 respectively. The current level of the JPY
                                   is fundamentally undervalued relative to its BEER fair value of       Christopher Wong
                                   109. We expect the JPY to correct in the longer term.                 (65) 6320 1347
                                                                                                         wongkl@maybank.com.sg
                                   JPY Losing Luster As Safe-Have Proxy Play For Now
                                                                                                         Fiona Lim
                                   In the current environment of more aggressive Fed rate hike
                                   expectations and Sino-US trade war concerns, the current              (65) 6320 1374
                                   strength of the USD has made the currency the more sought-after       fionalim@maybank.com.sg
Global

                                   refuge in the face of global risk-off sentiments compared to JPY.
                                   Carry trades with the JPY as the funding currency for USD assets
                                   also weighs on the JPY. In addition, portfolio inflows into
                                   Japanese assets have not lifted the JPY as investors tend to
                                   hedge their asset purchases against further JPY depreciation.
                                   Recent CFTC data showed that market players are positioning for
                                   further USD strength as reflected in the increase in net-short JPY
                                   contracts in the week of 10 Jul. Expectations of USD correction
                                   from 4Q, exporter repatriation of earnings during quarter-end for
                                   book-keeping purposes and JPY seasonal strength in 4Q should be
                                   supportive of the JPY.

                                   Upside Risks For USDJPY Near-Term; JPY Strength In The
                                   Medium Term
                                   Technical charts suggests that the USDJPY could potentially head
                                   higher towards 118-levels should resistance level at the 114-
                                   handle be broken on a weekly close. A move towards 118 though
                                   is likely to be short-lived with a retracement likely back towards
                                   the 115-levels. Support is around 111.20-levels (38.2% fibo
                                   retracement of the Jun 2016 to Dec 2016 rally). EURJPY looks to
                                   remain supported, and AUDJPY range-bound but both have the
                                   potential to retrace in the near-term. Downside risks to both
                                   JPYSGD and JPYMYR could persist, though there could be a
                                   potential for a rebound for the JPYSGD.

                                   SEE PAGE 13 FOR IMPORTANT DISCLOSURES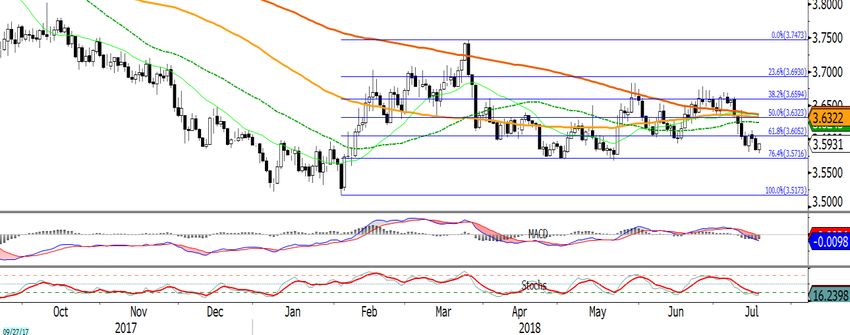
JPY – Losing Luster

Portfolio Inflows Not Necessarily Supportive of the JPY

In an environment of uncertainty, particularly with regards to lingering
trade war concerns, haven-assets are likely to find favour compared to
risk assets. Since the introduction of quantitative and qualitative easing
measures by the BOJ, there have been broad fund outflows from Japan
to higher yielding assets abroad. This weighs on the JPY. However, the
search for safe-haven assets is likely to characterise the environment in
the next three-to-six months at least until trade war concerns dissipates.

Typically, the rising trade tensions between China and US should spark
global risk aversion and in turn trigger safe-haven plays including the JPY
amid US monetary policy normalisation. That said, a significant
escalation of this Sino-US trade dispute could lead to greater financial
volatility and eventually impacting negatively on global growth, limiting
further USD upside. This could delay the Fed normalisation plans and
weigh on UST yields. The deterioration in global sentiments and potential
drag in global growth from escalating trade tensions could see greater
demand for the JPY and other safe-haven proxy plays. JPY could
strengthen consequently.

As can be seen from Chart 1, the USDJPY has been tracking net portfolio
flows into Japanese assets. On a three-month moving average basis,
foreign inflows into Japanese assets have been on the rise after slipping
lower from Oct 2017. JPY weakness and a buoyant US economy have
lifted corporate earnings amid simmering global trade tensions,
encouraging foreign inflows into Japanese equities. We however did not
see a concomitant rise in the JPY with the foreign inflows into Japanese
assets. Instead, as can be seen in Chart 1, the JPY weakened with net
portfolio inflows, suggesting a strong positive correlation between
portfolio inflows into Japanese assets and the USDJPY. This is because
foreign investors usually hedge their Japanese asset purchases against
further JPY depreciation by short-selling the JPY. Thus, inflows into
Japanese assets have been positive for the USDJPY, possibly accounting
for the weakness in the JPY so far.

Chart 1: Further Net Portfolio Inflows Could Weigh On JPY
  10,000                                                                                                                                                                     125
                                                                                                                                Inflow to Japan
   8,000
   6,000                                                                                                                                                                     120
   4,000
   2,000                                                                                                                                                                     115
       0
  -2,000
                                                                                                                                                                             110
  -4,000
  -6,000
  -8,000                                                                                                                                                                     105
 -10,000                                                                                                                Outflow from Japan
 -12,000                                                                                                                                                                     100
           Jan-14

                             Jul-14

                                                                 Jul-15

                                                                                                     Jul-16

                                                                                                                                         Jul-17
                                      Oct-14
                                               Jan-15

                                                                          Oct-15
                                                                                   Jan-16

                                                                                                              Oct-16
                                                                                                                       Jan-17

                                                                                                                                                  Oct-17
                                                                                                                                                           Jan-18
                    Apr-14

                                                        Apr-15

                                                                                            Apr-16

                                                                                                                                Apr-17

                                                                                                                                                                    Apr-18

                                Net Porfolio Flows                                               3MMA                                    USDJPY (rhs)

Source: Bloomberg, CEIC, Maybank FX Research & Strategy

USD Strength Trumps All…For Now

For now though, demand for safe-haven assets appear to be completely
offset by broad USD strength amid monetary policy divergence and
July 19, 2018                                                                                                                                                                      2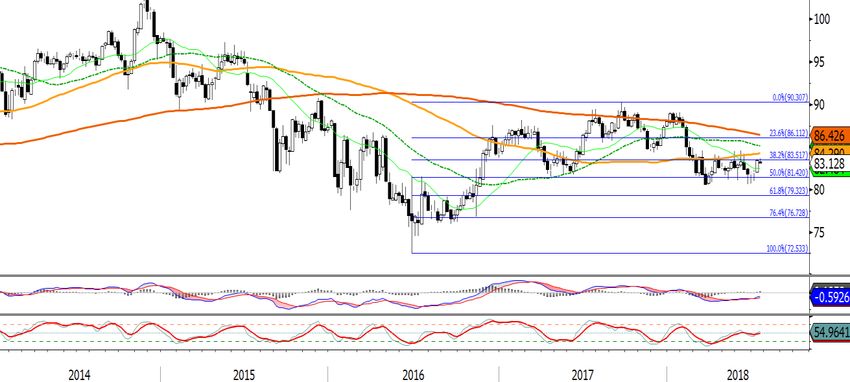
JPY – Losing Luster

optimism over US corporate earnings. More importantly, the measured
response from China over the additional tariffs announced by the Trump
administration appears to have calmed markets, de-escalating tensions
between the two world’s largest economies.

At the same time, Fed’s guidance for a more rapid normalisation of its
monetary policy as well as healthy US data to date have been supportive
of the USD. Year-to-date, the USD Index (index of the value of the USD
relative to basket of its major trade partners’ currencies) have risen by
2.6%. When viewed from the start of the USD index rally in mid-Apr, the
USD has risen by an even faster 5.3%.

Chart 2: Traditional Safe-Havens Are Not As Popular As The USD

Note: Normalised as of 16 Jul 2018
Source: Bloomberg, Maybank FX Research & Strategy

Not surprisingly, this has made the USD the more sought-after refuge in
the face of global risk-off sentiments compared to the other traditional
safe-haven proxies like gold, JPY and CHF (Chart 2). JPY appears to be
underperforming this time round due to the lack of demand for it as a
safe-haven proxy play, exposing the currency to USD moves. Just as
important, carry trades are back with the JPY as a funding currency.
Investors borrow JPY to invest in USD assets in search of higher returns.
All of these should lead to increase long-USD short-JPY positioning that
should keep the USDJPY supported.

Already we have seen market players positioning for further USD strength
(Chart 3). Recent CFTC data showed that since the week of 5 Jun,
market has been net short-JPY, i.e., expecting weakness in the JPY, with
39,832 contracts in place. Investors have almost doubled their short-JPY
bets from 58,754 contracts at the start of May to 100,395 contracts as of
the week of 10 Jul, while at the same time increasing slightly their long-
JPY bets to 60,563 contracts as of the 10 Jul week vs. 57,349 contracts
as at the start of May. Given expectations for further USD strength in the
next three months, we could see further net short-JPY positioning that
should weigh on the JPY.

However, we do not expect USD strength against the majors, including
the JPY, to extend beyond 3Q 2018. A milder downtrend for the USD is
expected towards the end of the year though we cannot rule out bouts of
USD strength like the current episode. We maintain our view that the
USD is bound for a broad pullback because of (1) rising US deficit and
debt from US tax reforms; (2) reserve diversification away from USD; (3)

July 19, 2018                                                                3
JPY – Losing Luster

USD countercyclical play; and (4) broad USD downtrend cycle. Thus we
expect JPY weakness to peter out towards the end of the year.

Chart 3: Market Positioning For Further JPY Weakness
   20000    JPY bearish has increased since 1 May 2018 -            104
       0    net short-JPY bets have been on the rise
                                                                    106
  -20000                   USDJPY (inverted, rhs)
                                                                    108

                                                                T
  -40000
  -60000                                                            110
  -80000                                                            112
 -100000
                                                                    114
 -120000
 -140000              CFTC net short-JPY                            116
                      positioning (no. of contracts)
 -160000                                                            118
             3/1/2017
            31/1/2017
            28/2/2017
            28/3/2017
            25/4/2017
            23/5/2017
            20/6/2017
            18/7/2017
            15/8/2017
            12/9/2017
           10/10/2017
            7/11/2017
            5/12/2017
             2/1/2018
            30/1/2018
            27/2/2018
            27/3/2018
            24/4/2018
            22/5/2018
            19/6/2018
Source: Bloomberg, Maybank FX Research & Strategy

Downside pressure on the JPY is also likely to come from importer
demand for foreign currency (usually USD). Healthy economic growth and
improvement in wages have seen import demand increase (May imports
rose 14% y/y vs. Apr’s +6.0%). With economic growth expected to remain
healthy (BOJ expects real GDP to expand by 1.6% in FY2018), import
demand should also remain healthy and increased import demand should
weigh on the JPY. On the other hand, anecdotal evidence suggests
exporters could park their export earnings abroad on expectations of
further JPY weakness and repatriate earnings only during quarter-end for
book-keeping purposes.

At the same time, 4Q tends to be a seasonally strong month for the JPY
vs. the USD (Chart 4), and there is the potential for the JPY to rebound
in the last three months of the year. This is likely to mitigate the
downside pressure on the JPY and lift the JPY higher by end-4Q.

July 19, 2018                                                              4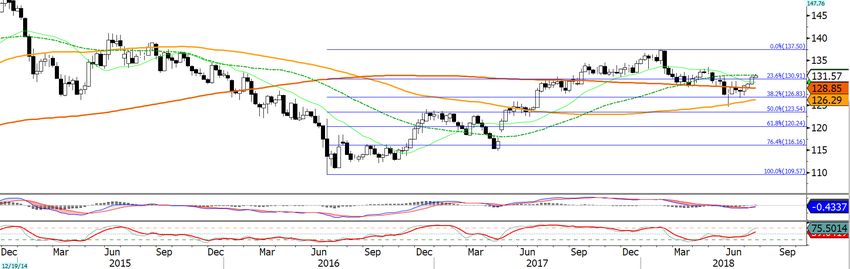
JPY – Losing Luster

Chart 4: The Last 3 Months Of The Year Tends To Be Seasonally Strong
For The JPY Vs. USD

Source: Bloomberg, Maybank FX Research & Strategy

Chart 5 (a): Some Room For JPY To Correct Towards Fair Value
Estimate In The Medium Term
                      USD/JPY Implied                     USD/JPY Actual
 600                  Plus 2 stdev                        Minus 2 stdev
 500
                                                                      Forecast
 400
 300
 200
 100
    0
 -100
 -200
        1Q 1Q 1Q 1Q 1Q 1Q 1Q 1Q 1Q 1Q 1Q 1Q 1Q 1Q 1Q 1Q 1Q 1Q 1Q 1Q 1Q 1Q
        99 00 01 02 03 04 05 06 07 08 09 10 11 12 13 14 15 16 17 18 19 20
Source: Bloomberg, CEIC, Maybank FX Research & Strategy

July 19, 2018                                                                    5
JPY – Losing Luster

Chart 5 (b): JPY Undervalued From Current Levels

                        USD/JPY Implied                      USD/JPY Actual
 130

 125

 120

 115
                                    Current Value - 113
 110

 105                                                                  Fair Value -109

 100

   95
        1Q 2Q 3Q 4Q 1Q 2Q 3Q 4Q 1Q 2Q 3Q 4Q
        18 18 18 18 19 19 19 19 20 20 20 20
Source: Bloomberg, CEIC, Maybank FX Research & Strategy

In addition, the current level of the JPY is fundamentally undervalued by
about 3.5% and this suggests some room for the JPY to depreciate mildly
towards our fair value estimate (Chart 5 (a) and (b)). Our BEER fair value
model which takes into account differentials in REER, terms of trade,
GDP per capita and interest rate; net foreign assets (as % of GDP); ratio
of total trade to GDP; productivity; and government consumption,
estimates USDJPY at 109.

Against this current backdrop of USD strength, we have revised our
forecasts for the USDJPY. We expect the JPY to remain weighed even as
concerns over trade disruption persist. We see upside pressure on the
USDJPY to lift the pair and end 3Q higher around 115 instead of the 109
we had previously expected. Thereafter, we expect some pullback in USD
strength to allow the USDJPY to ease and end the year around 112 (108
previously). In 1H 2019, we look for the pair to hover around the 111
(from 107 previously). We expect the pair to end 2019 around 110-levels
as market begins to price in policy normalisation in 2020.

USDJPY Forecast
    Forecast          3Q 2018          4Q 2018            1Q 2019        2Q 2019

     USDJPY            115.00            112.00            111.00         111.00
                      (109.00)          (108.00)          (107.00)       (107.00)

Previous Forecasts in Parenthesis

JPY Has Been Resilient

The JPY has been largely overshadowed by the USD especially amid all
the hoopla over trade war. Conventional wisdom would assume that the
USD would be the best performer among the G10 currencies. An
examination of the G10 currencies against the USD and JPY respectively
proves otherwise.

July 19, 2018                                                                           6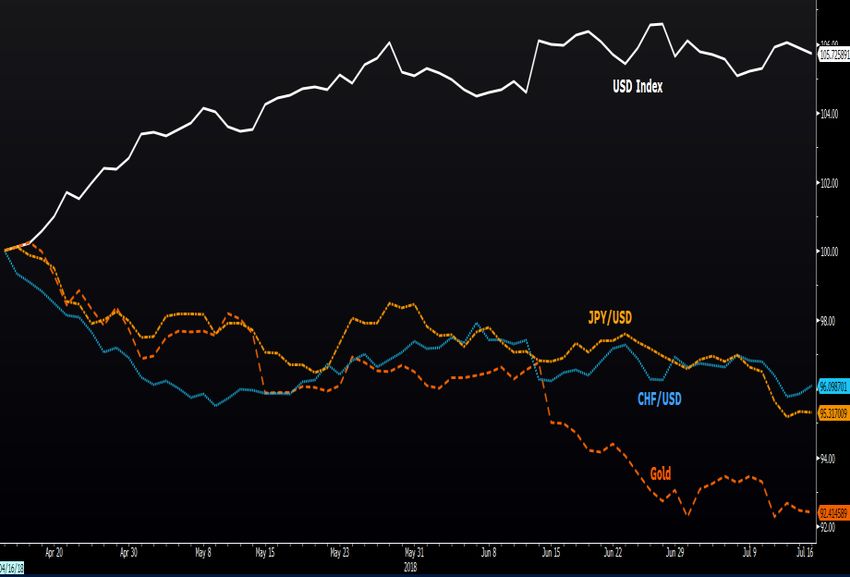
JPY – Losing Luster
Chart 6: JPY is Outperforming the USD among the G10 (Year-To-Date)
G10 vs. USD G10 vs. JPY
NOK 1.09 NOK 0.81
JPY 0.28 USD -0.28
GBP -2.15 GBP -2.42
EUR -2.67 EUR -2.93
DKK -2.70 DKK -2.97
CHF -2.74 CHF -3.00
CAD -4.48 CAD -4.74
NZD -4.86 NZD -5.12
AUD -4.93 AUD -5.19
SEK -7.84 SEK -8.10
-10.00 -8.00 -6.00 -4.00 -2.00 0.00 2.00 -10.00 -8.00 -6.00 -4.00 -2.00 0.00 2.00
Source: Bloomberg, Maybank FX Research & Strategy
From Chart 6, the JPY has risen against all every G10 currencies except
for the Norwegian Krone (NOK) so far this year (start of the year to 13
Jul). By comparison, the USD has gained against eight of its G10 peers to
date. The JPY has gained an average of 3.4% against its G10 peers, while
the USD has advanced by 3.1%. The outpacing of the JPY compared to
the USD reflects the resilience of the JPY in the current environment
amid trade war concerns and more aggressive Fed rate hike prospects.
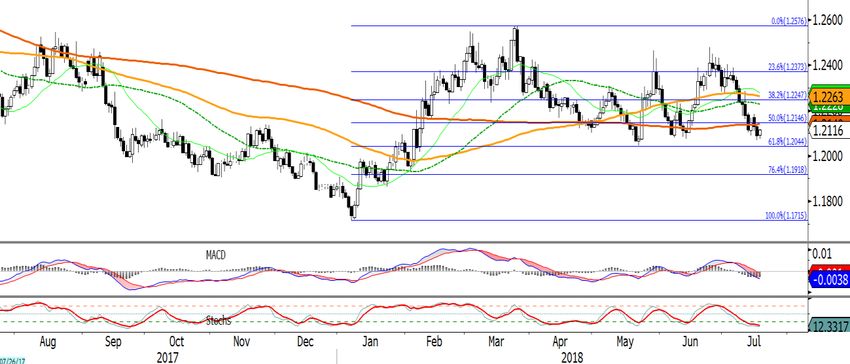
Chart 7: Weekly USDJPY Chart – Watching Break Of 114-Levels
MACD
Stochs
Source: Bloomberg, Maybank FX Research & Strategy
USDJPY climbed nearly 3 yen in the past two weeks, lifted by the broad
USD moves higher amid optimism over strong US corporate earnings and
expectations of Fed rate hike moves in 2H 2018. The muted response of
China to the threat of additional tariffs on Chinese exports to the US was
also supportive of the USD and reduced demand for safe-haven assets.
July 19, 2018 7JPY – Losing Luster
Pair was last seen around 113.04 levels. Momentum indicators remain
bullish bias while stochastics is at overbought conditions. The golden
cross pattern we had flagged previously has been formed and this
typically is a bullish signal. Pair could thus potentially head higher
towards 118-levels should resistance level at the 114-handle be broken
on a weekly close. A move towards 118 though is likely to be short-lived
with a retracement likely back towards the 115-levels. Support is around
111.20-levels (38.2% fibo retracement of the Jun 2016 to Dec 2016 rally).
JPY Crosses
At the same time, the JPY is on the weak side on a real effective
exchange rate (REER) basis when compared to its 10-year historical
average (Chart 8). This has increased the economy’s competitiveness vis-
à-vis its trading partners. But risks among its trading partners,
particularly the EU and Australia re-emerge, and these could lift the JPY
REER back towards its 10-year average.
Chart 8: JPY REER Has Been Trending Lower Since Start Of QQE
REER 10 yr-average (2008-2018)
120
110
100
90
80
70
60
50
40
1Q 1Q 1Q 1Q 1Q 1Q 1Q 1Q 1Q 1Q 1Q 1Q 1Q 1Q 1Q 1Q 1Q 1Q 1Q 1Q
99 00 01 02 03 04 05 06 07 08 09 10 11 12 13 14 15 16 17 18
Source: Bloomberg, CEIC, Maybank FX Research & Strategy
In the current risk environment, Fed rate moves in 2H 2018 has largely
been telegraphed by the Fed and is mostly priced-in by the market.
Market expects monetary policy divergence between the Fed and BOJ to
weigh on the JPY. On the other hand, Sino-US trade war concerns should
be supportive of the JPY because of safe-haven proxy plays, especially if
these tensions escalate into a trade war. The net effect of trade war
concerns amid US policy normalisation would be a stronger JPY especially
against its non-USD G10 peers.
EURJPY – Political Uncertainty In The EU Could Re-Emerge
Despite the relative calm on the political front in the EU, uncertainty
could re-emerge just as quickly with the trigger point possibly coming
from migration and anti-EU policies. These were manifested earlier this
year in the near-collapse of Chancellor Angela Merkel’s coalition
government over immigration policy; and concerns over Italy’s
nationalistic and anti-EU government that rattled the financial markets.
At the same time, ECB policy normalisation is supportive of the EUR. For
now, the political calm and ECB policy normalisation are proving positive
for the EURJPY cross.
July 19, 2018 8JPY – Losing Luster
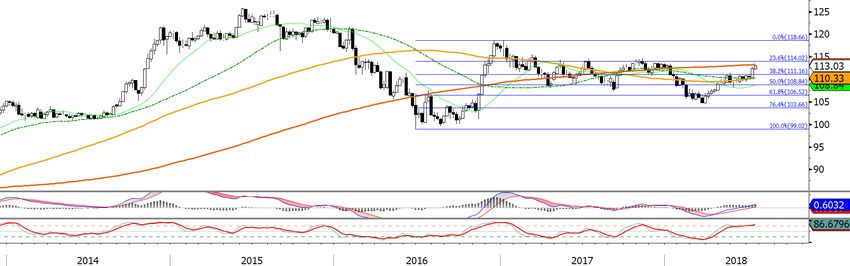
Chart 9: Weekly EURJPY Chart – Upside Bias But Potential For
Downside Risks Near Term
MACD
Stochs
Source: Bloomberg, Maybank FX Research & Strategy
EURJPY has rebounded from its 2018 low of 124.62 on 29 May amid ECB
policy normalisation and easing political concerns in the EU over Italy at
that point in time. With risk sentiments supported, long-JPY, short-EUR
bets are being unwound, putting downside pressure on the JPY and
lifting this cross higher. Last seen around 131.53-levels. Momentum is
turning bullish, while stochastics is climbing higher. Daily chart though
suggests some downside risks in the near-term. Immediate resistance is
around the 132-levels (50DMA) ahead of 133.50-, 134.50-levels. Support
around 131-levels (23.6% fibo retracement of the Jun 2016 to Feb 2018
rally), 129.50-levels.
AUDJPY – Downside Risks Abound
Australia is among the most sensitive to trade war concerns between
China and the US given its exposure to China and its increasing reliance
on trade. Softer commodity prices (possibly on a moderation in Chinese
growth) weigh on the AUD. For now, the de-escalation in trade war
concerns between China and US is providing some relief for the AUD.
Still, there are downside risks to the AUD ahead, namely a re-escalation
of Sino-US trade tensions, US yield curve inversion that could trigger
concerns about a potential US recession, and possible political risks
leading into the 2019 general elections. Until then, we could see the
AUDJPY cross edge higher.
It is worth noting here that should the Fed stay on hold in Sep, we could
see a softer USD and stronger funding currencies, including the JPY. This
suggests that the cross AUD/JPY could fall. But should Fed hike rates as
planned then we could see the AUDJPY trade range-bound as the Fed
moves have already been priced-in.
July 19, 2018 9JPY – Losing Luster
Chart 10: Weekly AUDJPY Chart – Rangy But Near-Term Downside Risk
MACD
Stochs
Source: Bloomberg, Maybank FX Research & Strategy
AUDJPY has been trading within a tight range since end-Mar amid China-
US trade war concerns. Last seen around 83.135-levels. This cross shows
no strong momentum on the weekly chart. Daily chart though shows risks
of a pullback. We could see range-bound trades for now, but there is a
risk for a near-term pullback. Resistance is around 84.290-levels
(100DMA) ahead of 85-handle (50DMA), 86.425-levels (200DMA). Support
around 81.420-levels (50% fibo retracement of the 2016 low to 2017
high).
JPYSGD – Trade Disruption Risks Supportive
As a small open economy heavily reliant on trade, any disruption to the
global supply chain due to trade war concerns is a drag on the economy.
Already the synchronous export recovery is showing signs of slowing and
together with trade war concerns could exacerbate the downside risks to
the economy. With China and the US among the largest trading partner
with Singapore, a trade war puts the economy between a rock and a hard
place, which could be reflected in a weaker SGD. This in turn should be
supportive of the JPYSGD. That said, the SGD is a quasi-safe-haven asset
as well given its triple-A credit rating in the Asia. This could keep the
cross range-bound to a certain extent.
July 19, 2018 10JPY – Losing Luster
Chart 11: Daily JPYSGD Chart – Bearish, But Risk Of Rebound
MACD
Stochs
Source: Bloomberg, Maybank FX Research & Strategy
JPYSGD was last seen around 1.2115-levels. Daily bearish bias on the
daily chart remains intact, while stochastics is at oversold condition. This
suggests there is a potential for a rebound. Until then, pair could
continue to drift lower. Support is around 1.2045 levels (61.8% fibo
retracement of the 2018 rally), 1.1980-levels. Resistance around 1.2145
levels (50% fibo, 200DMA), 1.2230 (50DMA).
JPYMYR – Downside Risks Persist
Malaysia faces several downside risks, namely softer oil prices, trade
tension concerns and RMB moves. Possibility of a supply glut in light of
the OPEC and Russia agreement to boost output, the return of Libyan
supply after a short disruption and push by US to increase oil supply
could weigh on oil prices and hence the MYR. Similarly, trade disruption
could weigh on the MYR given its dependency on trade. The RMB, which
has been an anchor of stability for most of AXJs, is losing some of its
shine on concerns over the repercussions from an economic conflict with
the US and the lack of PBoC presence to slow RMB depreciation and
which is likely to impact the MYR. A softer MYR could lift the JPYMYR
higher ahead.
July 19, 2018 11JPY – Losing Luster
Chart 12: Daily JPYMYR Chart – Downside Risks
MACD
Stochs
Source: Bloomberg, Maybank FX Research & Strategy
JPYMYR has been trading softer since early Jul amid elevated oil prices.
Last seen around 3.5928-levels. Bearish bias on the daily chart remains
intact but waning, while stochastics has entered into oversold territory.
For now, we could see this cross pressured lower. Support is around
3.5720-levels (76.4% fibo retracement of the 2018 low to high), 3.5500-
levels. Resistance is around 3.6050-levels (61.8% fibo), 3.6245-levels
(50DMA).
July 19, 2018 12JPY – Losing Luster
DISCLAIMER
This report is for information purposes only and under no circumstances is it to be considered or intended as an offer to sell or
a solicitation of an offer to buy the securities or financial instruments referred to herein, or an offer or solicitation to any
person to enter into any transaction or adopt any investment strategy. Investors should note that income from such securities or
financial instruments, if any, may fluctuate and that each security’s or financial instrument’s price or value may rise or fall.
Accordingly, investors may receive back less than originally invested. Past performance is not necessarily a guide to future
performance. This report is not intended to provide personal investment advice and does not take into account the specific
investment objectives, the financial situation and the particular needs of persons who may receive or read this report.
Investors should therefore seek financial, legal and other advice regarding the appropriateness of investing in any securities
and/or financial instruments or the investment strategies discussed or recommended in this report.
The information contained herein has been obtained from sources believed to be reliable but such sources have not been
independently verified by Malayan Banking Berhad and/or its affiliates and related corporations (collectively, “Maybank”) and
consequently no representation is made as to the accuracy or completeness of this report by Maybank and it should not be
relied upon as such. Accordingly, no liability can be accepted for any direct, indirect or consequential losses or damages that
may arise from the use or reliance of this report. Maybank and its officers, directors, associates, connected parties and/or
employees may from time to time have positions or be materially interested in the securities and/or financial instruments
referred to herein and may further act as market maker or have assumed an underwriting commitment or deal with such
securities and/or financial instruments and may also perform or seek to perform investment banking, advisory and other
services for or relating to those companies whose securities are mentioned in this report. Any information or opinions or
recommendations contained herein are subject to change at any time, without prior notice.
This report may contain forward looking statements which are often but not always identified by the use of words such as
“anticipate”, “believe”, “estimate”, “intend”, “plan”, “expect”, “forecast”, “predict” and “project” and statements that an
event or result “may”, “will”, “can”, “should”, “could” or “might” occur or be achieved and other similar expressions. Such
forward looking statements are based on assumptions made and information currently available to us and are subject to certain
risks and uncertainties that could cause the actual results to differ materially from those expressed in any forward looking
statements. Readers are cautioned not to place undue relevance on these forward looking statements. Maybank expressly
disclaims any obligation to update or revise any such forward looking statements to reflect new information, events or
circumstances after the date of this publication or to reflect the occurrence of unanticipated events.
This report is prepared for the use of Maybank’s clients and may not be reproduced, altered in any way, transmitted to, copied
or distributed to any other party in whole or in part in any form or manner without the prior express written consent of
Maybank. Maybank accepts no liability whatsoever for the actions of third parties in this respect.
This report is not directed to or intended for distribution to or use by any person or entity who is a citizen or resident of or
located in any locality, state, country or other jurisdiction where such distribution, publication, availability or use would be
contrary to law or regulation.
Published by:
Malayan Banking Berhad
(Incorporated in Malaysia)
Saktiandi Supaat Christopher Wong Fiona Lim Leslie Tang
Head, FX Research Senior FX Strategist Senior FX Strategist Senior FX Strategist
saktiandi@maybank.com.sg wongkl@maybank.com.sg Fionalim@maybank.com.sg leslietang@maybank.com.sg
(+65) 63201379 (+65) 63201347 (+65) 63201374 (+65) 63201378
July 19, 2018 13You can also read