OOh!media Covid-19 Pulse Report - Getting you ahead of the curve Making Brands Powerfully Unmissable
←
→
Page content transcription
If your browser does not render page correctly, please read the page content below

oOh!media
Covid-19 Pulse Report
Getting you ahead of the curve

Tuesday 29th September 2020
Edition 21 – Australian states at a glance: NSW & ACT market spotlight

Making Brands Powerfully Unmissable

With glimmers of ‘summer-like’ weather gracing parts of the country, this
    week kicks-off spring school holidays for NSW, ACT, SA and WA school
    students who join those in Queensland and Victoria, as well as Tertiary
    students nationally, on a much needed break! And with the countdown to
    Labor Day in sights, Australians outside of Victoria are taking advantage of
    the warmer weather and no or low community Covid-19 cases with road-
    trips and planned travel to some of Australia’s most iconic coastal and
    regional destinations.

    And while school holidays and the upcoming long weekend takes a slightly
    different shape for Victorians compared to previous years, life on the other
    side of the outbreak curve is almost in arms-reach with easing restrictions
    and lower new case numbers.

    As a continuation of our state-specific insights series, this week’s report takes
    a deep dive into ACT and NSW residents as they forge-ahead, with ACT
    recording 70+ days since the last reported case of Covid-19 and NSW with
    very little threat of cases in the community as it continues to be the largest
    driver of the Australian economy, generating approx. a third of national
    GDP.

    This week’s reports takes a look into how residents in NSW and ACT have
    adjusted behaviours to ensure the continued safety and wellbeing of
    residents as they continue to travel to destinations outside the home, their
    current spending behaviour above pre Covid-19 levels, their sentiment
    when it comes to the future of the world, the nation and Australian
    businesses, and a glimpse into their future plans when it comes to their
    consumer wallet and time spent outside the home.

2
Trends covered

    Here and Now:
    Year on Year Out of Home audience volumes and
    movement trends

    A Look to the Future:
    Updated spending behavior and consumer
    attitudes and intentions data for NSW/ACT residents
    vs. the national average

3
Dspark
    data usage disclaimer

                                                         For Dspark, “Competitor” means each of the entities below and their Related
                                                         Bodies Corporate:
    Whilst we endeavor to share as much as we can        (a) Telstra Corporation Limited, only where the Customer Group is providing
    with our valued partners, due to commercial               services directly to Telstra Corporation Limited or its Related Bodies Corporate
                                                              (services provided by a media agency or other intermediaries to Telstra
    agreements the insights provided by Dspark                Corporation Limited or its Related Bodies Corporate shall not be deemed to be
    within this Pulse report are not available for use        in breach of clause 2.3);
                                                         (b) Google LLC;
    by competitors to Dspark.                            (c) Here Global B.V.;
                                                         (d) TomTom International BV;
                                                         (e) Any person or entity (other than Dspark or its Related Bodies Corporate) which
                                                         is in the business of providing geospatial insights from telecommunications, GPS,
    We thank you for your understanding as we            WiFi and other similar data that informs movement to the public, in the Territory,
                                                         using the retail brand names used or owned by any of the persons or entities listed
    abide by our contractual agreements                  above in (a) to (d), or the Related Bodies Corporate of any such person or entity;
                                                         and
                                                         (f) Any person or entity (other than Dspark or its Related Bodies Corporate) which is
                                                         in the business of providing geospatial insights from telecommunications, GPS, WiFi
                                                         and other similar data that informs movement to the public, in the Territory

4
Here & Now
Notification of mobile
    data network upgrades
    Due to upgrades across our audience mobility
    data providers from 10th - 25th Sept 2019 and
    14th – 27th Sept 2020, oOh! and DSpark have
    identified that outages over the upgrade periods
    resulted in some loss of data and lower reported
    people volumes over those periods.

    Using data points across 4,000+ locations nationally
    over 80+ weeks from 2019 through 2020,
    oOh!DataScience have implemented a robust
    method to model total volumes across impacted
    weeks to adjust for loss of data.

    Data outputs and modelled volumes have been
    validated.

6
Out of home audiences
recover to 92% in
markets outside of
Victoria!

Source: Dspark data, 4,000+ Roadside and Retail locations, week ending Sept 21st 2020 vs. same week 2019, NSW, Qld, SA, WA, ACT, NT
Note: Data for period of 10th - 25th Sept 2019 and from 14th – 27th Sept 2020 modelled as a result of some loss of data and lower reported people volumes.
National roadside and retail audience at 79% of 2019 levels

                                                                                                                           National Retail and Roadside
    Consistent roadside and retail audience levels over                                                                           79% of 2019 levels
    the past 6 weeks saw audience levels remain at
    near 80% recovery to 2019 levels
    • Roadside and Retail audiences delivered 376mil
      contacts nationwide in w/e 21st September
    • In Victoria, with a path forward and lower new
      Covid-19 cases, audiences grew for the fourth
      week running, up +3.9% to 41% of 2019 levels
    • Regional markets continue to perform strongly,
      up week on week to 96% of 2019 levels as life
      returns to normal and in lead up to school
      holidays and an influx of travel within state across
      much of the country

      Source: Dspark data, Roadside and Retail locations, week ending Sept 21st 2020 vs. same week 2019
8     Note: Data for period of 10th - 25th Sept 2019 and from 14th – 27th Sept 2020 modelled as a result of some loss of data and lower reported people volumes.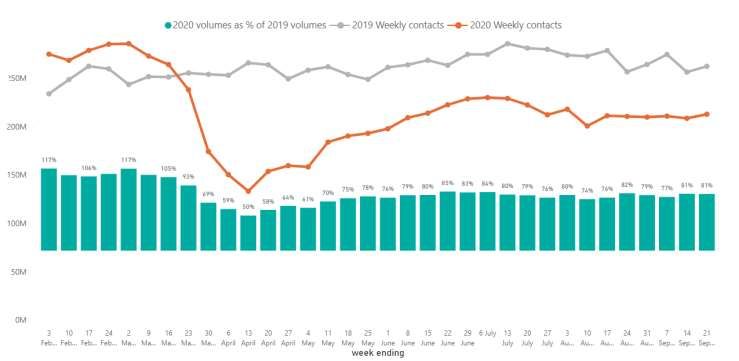
Six of seven states and territories at 92% recovery

    With limited new Covid-19 cases, life returns to
    normal across the majority of the nation, with
                                                                                                                       92% of 2019 levels in NSW, Qld, SA, WA, ACT & NT
    audiences back to 92% of 2019 levels
    Across NSW, Qld, SA, WA, ACT and NT….
    Roadside audiences at 91% yoy and up nearly
    2% WoW as regular commute and trip making
    patterns resume
    Retail audiences at 93% yoy as a return to the in
    store shopping experience continues. Visitation
    to Local and Medium centres hit 95% yoy
    Regionally, audiences at 97% of 2019 levels

    86% of 2019 levels in NSW
    97% of 2019 levels in Qld
    94% of 2019 levels in SA
    95% of 2019 levels in WA
    87% of 2019 levels in ACT & NT
      Source: Dspark data, Roadside and Retail locations, Qld, SA, WA, ACT, NT, week ending Sept 21st 2020 vs. same week 2019.
9     Note: Data for period of 10th - 25th Sept 2019 and from 14th – 27th Sept 2020 modelled as a result of some loss of data and lower reported people volumes.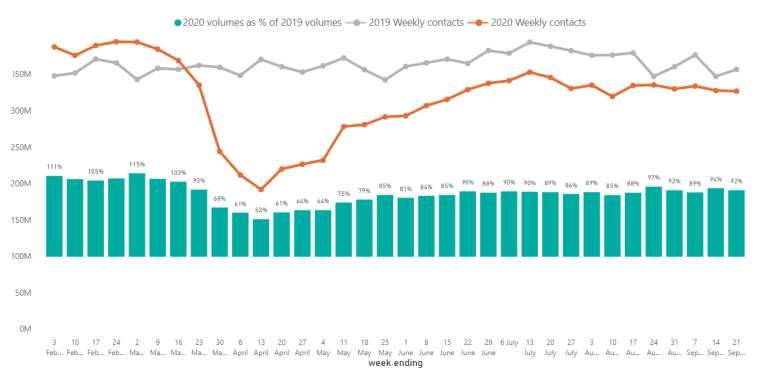
Regional audiences continued recovery drives weekly
      roadside growth

     National roadside audience recovery at 81% of 2019 levels                                                             81% of 2019 levels across oOh! Road locations
     for the past 2wks, with the network up 2% week on week in
     w/e 21st September
     In markets outside of Victoria roadside audience recovery
     continues, hitting 91% of 2019 levels. In suburban metro
     areas outside of Melbourne audience recovery hit 88%.
     Regionally, audiences near 2019 levels and in metro areas
     suburban assets continue to see an above average return

     72% of 2019 levels in Metro areas
     94% of 2019 levels in Regional areas
     74% of 2019 levels in Suburban areas
     59% of 2019 levels in CBD areas

        Source: Dspark data, 3,200 Roadside locations nationally, week ending Sept 21st 2020 vs same week 2019
10      Note: Data for period of 10th - 25th Sept 2019 and from 14th – 27th Sept 2020 modelled as a result of some loss of data and lower reported people volumes.
Retail audiences up +3% week-on-week
Retail audiences at 76% of 2019 levels across the oOh! Retail
network in w/e 21st September
76% of 2019 levels across oOh! Retail locations
In markets outside of Victoria audience return continues,
reaching 93% yoy as Australians return to regular shopping
habits.
Retail audiences in Victoria have grown for the past 5wks,
and up +3% across local and medium centres in the past
week
Regional audiences fully recovered
70% of 2019 levels in 76% of 2019 levels in
Metro areas Local centres
102% of 2019 levels in 87% of 2019 levels in
Regional areas Medium centres
89% of 2019 levels in 69% of 2019 levels in
Homemaker centres Large centres
Source: Dspark data, 500+ Retail locations nationally, week ending Sept 21st 2020 vs same week 2019
11 Note: Data for period of 10th - 25th Sept 2019 and from 14th – 27th Sept 2020 modelled as a result of some loss of data and lower reported people volumes.A Look to the Future: Australian States At A Glance: NSW Market Spotlight
NSW Covid-19 Community Outbreak                                                                                             NSW State Mobility to outdoor destinations
     With NSW representing approx. 4.5% of all confirmed Covid-19 cases                                                          With very few new cases of Covid-19 in the state, life in NSW has
     nationally, the state has been successful in suppressing Covid-19 in the                                                    recovered for the most part with Google mobility data this month
     community. And with the second highest rates of testing conducted                                                           reporting visitation to supermarkets and parks above pre Covid-19
     nationally, the state now records very few new daily cases with the                                                         levels and travel to retail and workplaces across the state tracking
     majority/all being from returned overseas travelers required to conduct                                                     towards baseline figures2.
     mandatory quarantine1.

                                                                                                                                  NSW Travel Modes
                                                                                                                                  Apple NSW Mobility data for 16th September reports driving
                                                                                                                                  tracking +14% ahead compared to Jan 2020 levels3.

13    Source: 1 ABC.net.au, Charting the Covid-19 spread in Australia, accessed 22nd September 2020 (Covid-19 Community Outbreak Graph shown above). Source: 2 Google Community Mobility Reports, 11 th September 2020. The
      baseline is the median value, for the corresponding day of the week, during the five-week period 3 Jan – 6 Feb 2020. (ACT Mobility Data shown above). Source: 3 Apple, Mobility Trends Report, 16th September 2020
Westpac-Melbourne Institute Index of Consumer Sentiment in September
2020 reports NSW consumer confidence has made a full recovery back
to its June position as states began to reopen from initial lockdown2.
ABS latest NSW unemployment rate has dropped from 7.2% to 6.7% in
August, just below the national average of 6.8% with 70% of jobs lost in
the pandemic in the state now restored. NSW Treasurer Dominic Perrottet Adjusting behaviours for community wellbeing into the future
" Jobs created in NSW account for about half the jobs created across the Given the large number of Australians calling NSW home, residents are
country, so it's pretty pleasing figures“3. adjusting behaviours to support the wellbeing of the community. 89% of
NSW residents are likely to continue with social distancing, maintaining
With JobKeeper payments injecting $18.6 billion into NSW helping 1.2 personal hygiene and wearing face masks in public into the future1.
million employees in the state4, 80% are confident their employment
position will be maintained or improve in the future, the same level of While adjusting behaviours, NSW residents are returning to regular travel
confidence viewed towards Australian Businesses on the horizon1. patterns…
70% of NSW residents are confident the Australian Economy will be For w/e 21st September 2020 NSW roadside audience volumes are at 82%
maintained or positively impacted once all social distancing restrictions of 2019 levels and NSW retail audiences at 92% of 2019 levels, as the state
are removed. Conversely 61% are confident in the World Economy continues to track towards YoY mobility levels5.
recovering at or above previous1.
Source: 1 oOh!media Pulse Report | Timing Wave 1: 1st- 4th May, 2020 Wave 2:18th- 19th May, 2020 Wave 3: 1st -3rd June 2020 Wave 4:
14 24th - 28th July 2020| Research Panel: Dynata| Australians aged 16+, n=3,726, Wave 1: n=2,212 / Wave 2: n=423/ Wave 3: n=318/ Wave 4:
n= 773. All NSW reported above n=1,146. Source: 2 Westpac, Bulletin-Consumer sentiment roars back despite news of recession, 9th
September 2020. Source: 3 SMH.com.au, NSW records six new cases as seven in 10 jobs lost during pandemic restored, 18th September
2020. Source: 4 SMH.com.au, Budget push to speed up states' spending, 18th September 2020. Source: 5 Dspark data, Roadside and
Retail locations, week ending Sept 21st 2020 vs. same week 2019.Good times continue as we roll into summer…
According to travel website Wotif, top trending summer destinations in
regional NSW include Forster with accommodation interest up over 240%
YoY, Kingscliff +215%, Coffs Harbour +180%, Yamba +170%, Newcastle
+170%, Bundanoon +170%, Port Macquarie +160%, Port Stephens +150%,
Byron Bay +140%, Wollongong up 65%4.
Wotif managing director Daniel Finch “if trends continue, NSW's North
Coast will be very crowded this summer as New South Wales travellers
Holidays away have always been a top priority for NSW residents find alternates to crossing state borders or going overseas” 4.
Last year NSW residents took almost 2 million international leisure trips.
Tourism Minister Stuart Ayres “there is a huge opportunity to entice our Airbnb also reports an influx in accommodation stays for w/c December
overseas holidaymakers to become NSW’s next top travelers”2 28th with 77% of Shoalhaven area already booked, 66% in Byron Bay and
65% in Coffs Harbour5.
Rob Jeffress, chairman of the Australian Short Term Rental Association,
"The people who are staying in NSW are spending more travelling within
NSW than foreign and interstate travellers would have spent in NSW“3
Compared to before the Covid-19 outbreak, NSW residents agree…
Over half of all NSW residents are keen to travel and explore their state
and 51% intending to take long road trips of 2+ more nights stay1.
75% are generally more Over half are eager to
Very little accommodation occupancy is left for upcoming school appreciative of the be out for longer
holiday period in Byron Bay (2%), Coffs Harbour (4%), Southern Highlands outdoors and outdoor amounts of time1
(4%), Yamba (5%), Jervis Bay (7%) and Port Macquarie (13%). School destinations1
holiday bookings at NRMA parks and resorts also up an average of 30%
YOY, with Dubbo, Port Macquarie and Murramarang on the NSW south 80% are more alert and
coast experiencing the biggest increases in visitors3. 76% are generally happier
aware of their to be out and about1
surroundings, 3% points
And with the announcement of all NSW residents able to travel to SA higher than the
and some to QLD, 2 in 5 NSW residents are keen to holiday in another average Australian1
state1.
Source: 1 oOh!media Pulse Report | Timing Wave 1: 1st- 4th May, 2020 Wave 2:18th- 19th May, 2020 Wave 3: 1st -3rd June 2020 Wave 4:
15 24th - 28th July 2020| Research Panel: Dynata| Australians aged 16+, n=3,726, Wave 1: n=2,212 / Wave 2: n=423/ Wave 3: n=318/ Wave 4:
n= 773. All NSW reported above n=1,146. Source: 2 ABC.net.au, NSW tourism campaign launches ahead of eased coronavirus restrictions
on regional travel, 31st May 2020. Source: 3 SMH, 'Byron Bay is full of them': Border closures a boon for regional tourism, 20th September
2020. Source: 4 9news.com.au, Favourite Aussie summer hot spots about to get even more crowded, 21st September 2020. Source: 5 SMH,
'Byron Bay is full of them': Border closures a boon for regional tourism, 20th September 202080% of NSW residents expect their discretionary income i.e. ability to buy
products and services will be maintained or increase1.
NSW Property Market
NSW housing clearance rates continue to track at or above the same
period last year as new home-owners enter the market. Weekend of 19th
/20th September, Sydney was host to 679 auctions, up 33 properties with a
clearance rate of 72.4%3.
• 1 in 4 aged under 40 intend to buy a new home or apartment1.
• 1 in 5 aged under 40 intend to move to a regional area, as opposed to Entertainment Purchases
the city1.
Compared to pre Covid-19 levels, NSW residents intend to maintain or increase
Other big purchases on the agenda visitation to destinations outside the home …
• In the “new-normal” once all social distancing restrictions are removed
and borders reopen to all, NSW residents intend to…
75% visit entertainment 72% attend live
• 1 in 4 intend to buy a new car1.
precincts e.g. cinema1 sports events1
• Over 1 in 3 intend to plan a holiday in an overseas destination/s, once
international borders permit1.
73% attend state-based 79% visit cafes, pubs
festivals and/or events1 and venues1
Source: 1 oOh!media Pulse Report | Timing Wave 1: 1st- 4th May, 2020 Wave 2:18th- 19th May, 2020 Wave 3: 1st -3rd June 2020 Wave 4:
16 24th - 28th July 2020| Research Panel: Dynata| Australians aged 16+, n=3,726, Wave 1: n=2,212 / Wave 2: n=423/ Wave 3: n=318/ Wave 4:
n= 773. All NSW reported above n=1,146. SourceSource: 3 CoreLogic, Highest Combined Capital City Preliminary Clearance Rate
Recorded Since March, 21st September 2020NSW residents are 4x more likely to intend to shop more at physical stores
in the future compared to reducing purchases at retail destinations1.
2 in 5 NSW residents intend to buy products/services they had previously
postponed1.
In the future NSW residents intend to purchase…
78% large home appliances 75% home improvements,
e.g. fridges, stove, of which of which 70% intend to buy
65% intend to buy instore instore only1.
only1.
85% electronics, of which over half intend to buy instore for all
purchases1.
90% banking and financial products, of which half intend to go
to a branch only or blend with online1.
85% health products, of 93% pharmaceuticals, of
which 60% intend to buy which 75% intend to buy
instore for every purchase1. instore only1.
61% lottery tickets, of which 76% alcohol, of which
over 2 in 3 intend to buy 68% intend to be bought
instore only or a blend of instore only1.
instore and online1.
17 Source: 1 oOh!media Pulse Report | Timing Wave 1: 1st- 4th May, 2020 Wave 2:18th- 19th May, 2020 Wave 3: 1st -3rd June 2020 Wave 4:
24th - 28th July 2020| Research Panel: Dynata| Australians aged 16+, n=3,726, Wave 1: n=2,212 / Wave 2: n=423/ Wave 3: n=318/ Wave 4:
n= 773. All NSW reported above n=1,146.A Look to the Future: Australian States At A Glance: ACT Market Spotlight
ACT Covid-19 Community Outbreak                                                                                              ACT State Mobility to outdoor destinations

     With almost no visible outbreak ‘curve’ in ACT recorded, it has done                                                         Given the longevity of no cases recorded in ACT, life in the
     exceptionally well in the successful suppression and elimination of                                                          capital has returned almost entirely, with visitation to parks, retail
     Covid-19. ACT leads the nation with the longest straight run of 70+                                                          and grocery at or above pre Covid-19 levels, and the vast
     days with no new cases, and currently has no active cases present2.                                                          majority of employed residents back at their place of work3.

                                                                                                                                  ACT Travel Modes
                                                                                                                                  Apple ACT Mobility data for 16th September reports driving and
                                                                                                                                  walking tracking ahead compared to Jan 2020 levels, +18% and
                                                                                                                                  +8% respectively4.

      Source: 1 The Guardian, Australia’s state by state coronavirus lockdown rules and restrictions explained, 16th September 2020 Source: 2 ABC.net.au, Charting the Covid-19 spread in Australia, accessed 22nd September 2020
19    (Covid-19 Community Outbreak Graph shown above). Source: 3 Google Community Mobility Reports, 11th September 2020. The baseline is the median value, for the corresponding day of the week, during the five-week period 3
      Jan – 6 Feb 2020. (ACT Mobility Data shown above). Source: 4 Apple, Mobility Trends Report, 16th September 2020
Compared to before the Covid-19 outbreak, ACT residents agree…
74% are generally more Over half are eager to
appreciative of the outdoors be out for longer
and outdoor destinations1 amounts of time1
6 in 10 are more appreciative of once mundane day-to-day
activities that allow me to be out and about such as commuting to
work1
ACT Ooh! Audiences
With ACT oOh! roadside audience volumes at 81% of 2019 levels for w/e 21st 83% are more alert and 83% are generally happier
Sept 2020, audiences within the state continue to track towards YoY mobility aware of their surroundings1 to be out and about1
levels. So too are ACT residents looking for the full retail experience with oOh!
Retail audiences in the ACT at 83% for w/e 21st Sept 2020 compared to same
time last year3. ACT residents are spending more and want the full retail experience in-store…
Upcoming Travel For Act Residents ACT residents are 4.4x more likely to intend to shop more at physical stores in the
SA and QLD are welcoming back ACT residents and ACT’s Chief Minister
future compared to reducing purchases at retail destinations1.
Andrew Barr said earlier this month that the new travel bubble with
Queensland was timely for Canberrans ahead of the school holidays 4.
• 69% of ACT residents plan to travel to holiday destinations within Australia,
6% points higher than the average Australian 1.
• Over half of all ACT residents intend to take long road trips of 2+ more nights
stay as restrictions continue to ease1.
Visitation outside the home
As Canberrans return to large events e.g. at Canberra Stadium, residents
intend to maintain or increase visitation compared to pre Covid-19 levels to…
• 75% attend live sports events1
• 75% visit entertainment precincts e.g. cinema 1
• 79% attend festivals/events in ACT1
• 87% visit cafes, pubs and venues1
Source: 1 oOh!media Pulse Report | Timing Wave 1: 1st- 4th May, 2020 Wave 2:18th- 19th May, 2020 Wave 3: 1st -3rd
June 2020 Wave 4: 24th - 28th July 2020| Research Panel: Dynata| Australians aged 16+, n=3,726, Wave 1: n=2,212 /
Wave 2: n=423/ Wave 3: n=318/ Wave 4: n= 773. All ACT reported above n=63. Source: 2 ABS, Average Weekly
20 Earnings, Australia, 13th August 2020. Source: 3 Dspark data, Roadside and Retail locations, week ending Sept 21st
2020 vs. same week 2019. Source: 4 ACB.net.au, Relief as Queensland opens border to ACT in time for Canberra's
school holidays,19th September 2020.RETAIL
oOh! Combination of centres deliver an
annual footfall of over 40m people and
represent $1.35bn in MAT. With products in the
6 main Canberra retail centers, our 74
Shopalite, 36 Shopalive and 2 Evoke ensure
you can connect with Canverage shoppers.
STREET
With over 320 Classic Street touchpoints across
When it comes to reaching people in Canberra city and suburbs including overage
Canberra, oOh! has got you covered. With Northbourne & Canberra Avenue – two major
over 475+ assets located in key locations arterials in Canberra, our ACT Network can drive
across the CBD, Suburbs and Queanbeyan impact against Canberra residents & visitors as
no other OOH provider can reach they move about their day.
Canberra like we can!
BILLBOARDS
We have billboards targeting the heart of
Canberra ensuring your campaign delivers
substantial reach and unmissable impact.
Our premium sites hug the Canberra Centre,
a high footfall precinct hitting locals and
tourists alike.
OFFICE, CAFÉ & FLY
Covering the major business district and
Airport, oOh!’s Office, Café and Fly network
reaches highly influential political, financial &
media audiences across 15+ Café and Office
locations and within both the Club and
Business Lounge environments in Canberra
Airport.Wave 4
Gender: 50% 50%
Male Female
30%
Age: 27% 28%
7% 8%
Research Independent research panel provider, Dynata
Agency on behalf of oOh!media Pre Baby Boomers Baby Boomers Gen X (aged 40- Gen Y (aged 25- Gen Z (aged 16-
(aged 75+) (aged 56-74) 55) 39) 24)
Quantitative research via online consumer
Methodology panel. Nationally representative sample based
on age and geographic location Location:
Sydney metropolitan 22%
Sample Australians aged 16+ New South Wales (Not Sydney) 11%
Total respondents, n=3,726
Melbourne metropolitan 24%
Wave 1: n= 2,212
Victoria (Not Melbourne) 9%
Sample Size Wave 2: 423
Brisbane metropolitan 10%
Wave 3: 318
Queensland (Not Brisbane) 6%
Wave 4: 773
Adelaide metropolitan 5%
South Australia (Not Adelaide) 1%
Wave 1: 1st- 4th May, 2020 Perth metropolitan 8%
Wave 2: 18th- 20th May, 2020 Western Australia (Not Perth) 1%
Research Timings
Wave 3: 1st- 3rd June, 2020 Darwin metropolitan 1%
Wave 4: 24th- 28th July, 2020 Northern Territory (Not Darwin) 0.1%
Tasmania 2%
ACT 1%
Source: oOh!media Pulse Report | Timing Wave 1: 1st- 4th May, 2020 Wave 2:18th- 19th May,
2020 Wave 3: 1st -3rd June 2020 Wave 4: 24th - 28th July 2020| Research Panel: Dynata|
23 Australians aged 16+, n=3,726, Wave 1: n=2,212 / Wave 2: n=423/ Wave 3: n=318/ Wave 4: n=
773. Wave 4 results displayed right.You can also read