UAV and GIS Based Real-time Display System for Forest Fire
←
→
Page content transcription
If your browser does not render page correctly, please read the page content below
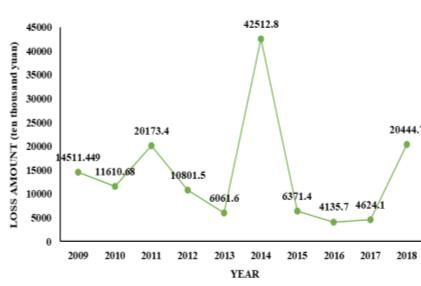
Wang et al. UAV and GIS Display System for Forest Fire

 UAV and GIS Based Real-time Display
 System for Forest Fire
 Jingxian Wang Lida Huang
 Institute of public safety, Tsinghua University Institute of public safety, Tsinghua University
 jingxian19@mails.tsinghua.edu.cn huanglida@tsinghua.edu.cn

 Guofeng Su Tao Chen
 Institute of public safety, Tsinghua University Institute of public safety, Tsinghua University
 sugf@tsinghua.edu.cn chentao.b@tsinghua.edu.cn

ABSTRACT
When a forest fire occurs, the commander cannot obtain information in time, and the rescue command is like
groping in the dark. In order to solve the problem, this research establishes a near real-time forest fire display
system based on UAV and GIS. The UAV is equipped with visible light and thermal imaging cameras to transmit
back forest fire scenes. Based on GIS, the system can extract the boundary of the fire field through image
processing and 3D modeling technology, and display various forest fire information on the screen. Through image
processing and 3D modeling technology, the boundary of the fire field can be extracted and displayed on the
screen. We conducted several experiments to test the accuracy and the reliability of the system. The result shows
that the accuracy, reliability and near real-time capability can be guaranteed in small-scale forest fires.

Keywords
Forest fire, forest fire boundary extraction, UAV, GIS, 3D modeling.

INTRODUCTION
In recent years, with the increase of human forest activities, forest fires are becoming more and more frequent.
Large-scale forest fires not only bring great economic losses and casualties to the local people, but also cause
serious damage to the ecological environment (Jiang & Jiang, 2013). For example, the Australian wildfire in 2019
influenced by continuous high temperature, drought and windy weather conditions, lasted for many months and
spread to 6 states across Australia. In addition, due to the incorrect command and decisions and insufficient
investment in firefighting forces, it caused serious consequences (Zhang & Xu, 2020). China is also one of the
countries with serious forest fires. According to statistics (Zhang, 2018), during the ten years from 2009 to 2018,
an average of 4,440 fires occurred every year in China, with 68 casualties and economic losses of up to 140 million
yuan due to forest fires, as shown in Figure 1.

 Figure 1. Statistics of the number of forest fires, property losses, and casualties in my country from 2009 to 2018
Early detection, timely positioning, and timely extinguishments are essential to reduce forest fire losses and the
occurrence of serious forest fires. A lot of work has been focused on forest fire monitoring, in which the common
methods are near-ground monitoring, radar monitoring, satellite monitoring, and wireless sensor network
monitoring (Yan & Li, 2017). These methods have their own merits, however, they are not that suitable for real-

 WiP Paper – Geospatial Technologies and Geographic Information Science for Crisis Management
 Proceedings of the 18th ISCRAM Conference – Blacksburg, VA, USA May 2021
 Anouck Adrot, Rob Grace, Kathleen Moore and Christopher Zobel, eds. 527
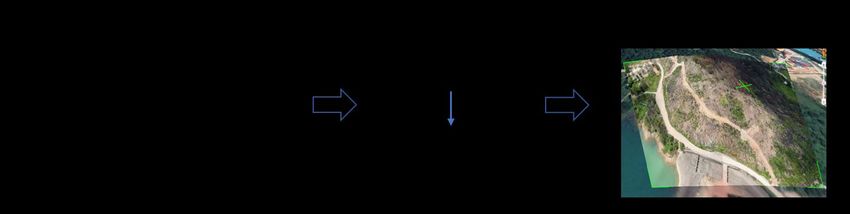
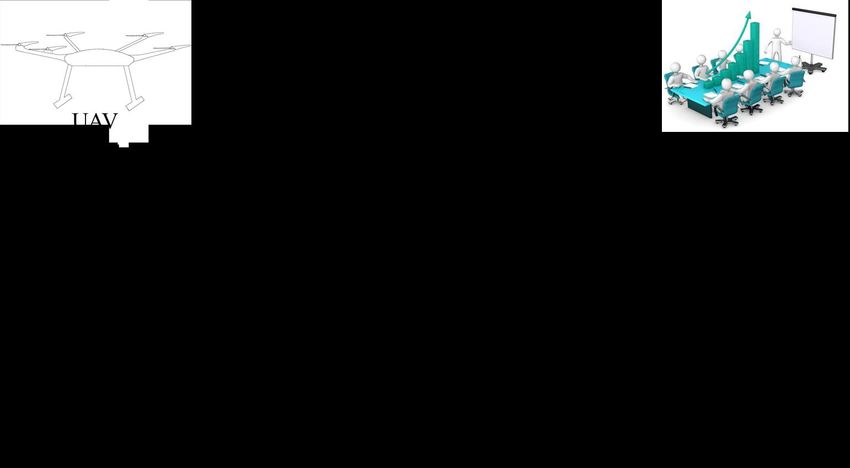
Wang et al. UAV and GIS Display System for Forest Fire

time information collection. For near-ground monitoring, the forest rangers cannot patrol all places restricted by
terrain and environment. Multi-spectral imagers are limited in field of view and high cost, and also susceptible to
interference from forest radiation and reflection. The radar monitoring is vulnerable to interference because the
spatial scale of fire radar echo is only a fraction or even a few orders of magnitude of precipitation echo, and
mixed in clutter (Huang et al., 2013). Satellite monitoring is easily obscured by clouds and fog, and its operating
cycles are too long (Yan et al., 2005). Wireless sensor technology is still in its infancy and cannot guarantee the
accuracy of sensors and equipment reliability (Grangeat et al., 2016).
In recent years, with the development of unmanned aerial vehicle (UAV) technology, forest fire monitoring based
on UAVs has received more and more attention. UAVs have advantages of high mobility and low cost. The
linkage of multiple UAVs can quickly inspect the forest area and return live videos in real-time. Existing research
focuses on early forest fire monitoring and cruise path planning by UAVs. For example, ED Wardihani et al.
(2018) proposed setting cruise routes for forest fire detection to detect forest fires timely. Na Wei et al. (2019)
used UAV cruise planning based on GIS to carry out forest fire prevention. Zhentian Jiao established a forest fire
prevention UAV system based on deep learning to monitor forests (Jiao, 2019).
This paper establishes a real-time forest fire display system based on UAV and GIS, in which the image overlay
function of Google Earth is used to realize 3D modeling and the image edge extraction technology is used to
extract the forest fire boundary. Through several experiments, it has been demonstrated that the system is feasible
in real-time display of fire situation. The following of this paper describes the system research background, system
design and implementation and the experimental design. Finally, we summarize this paper and give the proposal
for later research directions.

SYSTEM DESIGN AND IMPLEMENTATION
The real-time display system for forest fire is composed of three subsystems: data transmission system, image
processing system, and display system, as in Figure 2. First, the data transmission system transmits the image data
and position data obtained by the UAV and cameras. Then, these data are processed through image processing
system. The image processing system processes the visible light image and the thermal imaging image separately
to complete the 3D modeling and forest fire boundary extraction. At last, these results are shown in the display
system (Nadal-Serrano, 2010).

 Figure 2. The flowchart of system

Data Transmission System
Figure 3 shows the structure of the data transmission system. The system includes the data transmission link and
data storage equipment. Data transmission links can choose to use WiFi, 4G, VPN (Virtual Private Network),
to build the transmission link according to the network situation around the fire site. Data is transmitted on the
link in the form of a stream. Data storage equipment is NVR (Network Video Recorder), which can cache data,
realize video storage and support subsequent playback and facilitate the analysis of forest fire and the summary

 WiP Paper – Geospatial Technologies and Geographic Information Science for Crisis Management
 Proceedings of the 18th ISCRAM Conference – Blacksburg, VA, USA May 2021
 Anouck Adrot, Rob Grace, Kathleen Moore and Christopher Zobel, eds. 528
Wang et al. UAV and GIS Display System for Forest Fire

of rescue work (Vandecasteele et al., 2015).

 Figure 3. Data transmission system architecture

Image Processing System
The image processing system is the core of the rescue command system, which is divided into two parts, visible
light image processing and infrared image processing. The former is used to process the data from the UVA and
visible light camera to complete 3D modeling. The latter is used to extract the forest fire boundary.
Visible light image processing
The ultimate goal of visible light processing is to achieve 3D modeling. Visible light image processing includes
UAV data and visible light camera data processing. The 3D modeling process is shown in Figure 4.

 Figure 4. 3D modeling flowchart
Due to the advantages of multiple platforms, high image resolution, and real-time image updates (Liu et al.,
2015), this paper uses Google Earth to perform 3D modeling to restore the forest fire scene. In recent years,
Rusli et al. (2014) found that the watershed boundaries obtained by Google Earth and SRTM (Space Shuttle
Radar Topographic Mapping) were basically the same. Wang et al. (2010) verified the accuracy of Google Earth
by comparing satellite images and inversely calculating contours.
3D modeling needs UAV data and visible light camera data. Then, inputting this data into Google Earth in turn
as required and the live images taken at that location are loaded into Google Earth by adding photos, too. Next,
measuring the latitude and longitude of the four corners of the image in order from left to right and bottom to top.
According to the longitude and latitude of the four corners, the image overlay function of Google Earth can
complete 3D modeling.
UAV data contains UAV's longitude, latitude, altitude and yaw angle in flight. Visible light camera data
contains the camera's visual field width and height, focal length and pitch angle. Among them, altitude, yaw
angle and pitch angle should be corrected, and the visual field width and height need to be calculated through
camera's focal length.
The height correction is the UAV’s height value minus the height deviation value of the forest fire place. The
calculation of the height deviation value is: select a number of points, each point is 10 meters apart, then use the
UAV to measure the height value of each point. Next, the former height value minus the same point’s height value
on Google Earth. At last, calculate the average value ̅ . The ̅ is the height deviation value. For the correction of
the UAV's yaw angle and the camera's pitch angle, first determine the value of the positive or negative value. If it
is non-negative, no processing will be performed. Or, the UAV's deflection angle value will be added by 360. The

 WiP Paper – Geospatial Technologies and Geographic Information Science for Crisis Management
 Proceedings of the 18th ISCRAM Conference – Blacksburg, VA, USA May 2021
 Anouck Adrot, Rob Grace, Kathleen Moore and Christopher Zobel, eds. 529
Wang et al. UAV and GIS Display System for Forest Fire

camera's pitch angle value adds 90.
On the basis of visible camera data, the width and height of the camera's field of view can be calculated. The
calculation formula is shown in formula (2-1).
 ℎ ℎ
 = 2 × ( / ) (2-1)
 2

L is the focal length used by the mounted camera during shooting, and θ is the field of view.
Thermal Imaging Image Processing
The color space of the original thermal imaging image is RGB, the fire area under this color space has the
characteristics of discontinuity and incompleteness, which is not suitable for segmentation. Besides, the
correlation between R (red), G (green), and B (blue) in the RGB color space is very high. A single parameter is
difficult to segment the fire area too (Zhang et al., 2015). To solve this problem, we convert the thermal imaging
image into the grayscale image and then into the binary image (as shown in Figure 5). The binary image has only
two colors, pure black and pure white, with obvious contrast, and it is very suitable for image segmentation and
edge collection.

 Figure 5. Thermal imaging image processing flowchart
The specific image binary conversion steps are as follows:
a) Gray conversion
The commonly used way to convert RGB model to grayscale is:
 = 0.3 + 0.59 + 0.11 (2)
b) Binary conversion
First, a threshold is selected. Then, according to the threshold, the part of the grayscale image becomes black or
white, and the other part becomes the corresponding color. In this paper, in order to suit the large temperature
range and multiple colors in the thermal imaging camera, the OTSU algorithm is selected.
The basic idea of the Otsu algorithm is: mark T as the segmentation threshold between the foreground and the
background, the proportion of front sights in the image is W0, and the average gray scale is U0; the proportion of
background points in the image is W1, and the average gray scale is U1. The total average gray level of the image
is:
 = 0 × 0 + 1 × 1 (3)
Traverse T from the minimum gray value to the maximum gray value, when T makes:
 = 0 × ( 0 − ) × 2 + 1 × ( 1 − )2 (4)
When the maximum is selected, T is the optimal threshold for segmentation [14].
⚫ Forest fire boundary extraction
The boundary is the edge where the attribute of the area changes suddenly, which is essentially the sudden change
of the signal (Jiang et al., 2009; Zhang & Shi, 2000). The existing image edge extraction methods can be divided
into three categories, one is based on a certain fixed local operation method, such as differentiation method, fitting
method and so on, which belong to the classic edge extraction method. The second type is energy Minimization,
which is the criterion for global extraction methods. The third category is represented by high-tech developed in
recent years, such as wavelet transformation, mathematical morphology, and fractal theory. After the binarization,
the thermal imaging image has a clear distinction between black and white and obvious grayscale changes (Cui et
al., 2009). Considering, the real-time display system has high requirements for timeliness, edge extraction adopts

 WiP Paper – Geospatial Technologies and Geographic Information Science for Crisis Management
 Proceedings of the 18th ISCRAM Conference – Blacksburg, VA, USA May 2021
 Anouck Adrot, Rob Grace, Kathleen Moore and Christopher Zobel, eds. 530
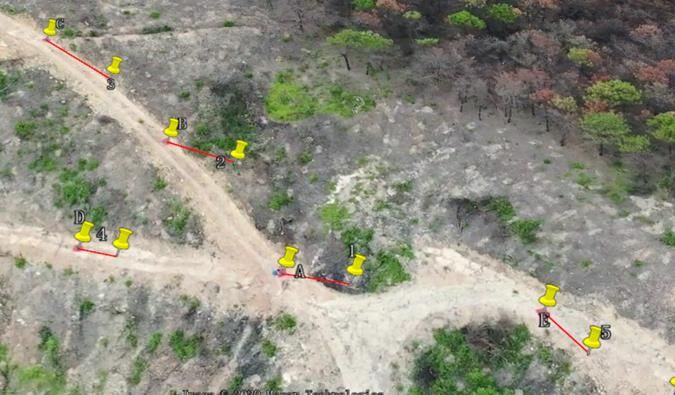
Wang et al. UAV and GIS Display System for Forest Fire

a differential operator method.
The edge detection in the differential operator method can be realized by using the Robert cross operator. Establish
the gray value function ( , ), for row pixels and column pixels in the binary image, then the edge in the image

is the place where the gray value function’s value changes suddenly. Derivation of the gray value function( , ),

known from the nature of the derivative, when the function value changes suddenly, the absolute value of the
corresponding derivative value is the largest, at the position (x, y) The maximum value of the derivative is:
 1/2
 2 2
 = [( ) + ( ) ] (5)

Correspondingly, the direction to obtain the maximum value is:

 = [
 ] (6)

Based on this, the expression of Robert's operator is derived as:
 | | = (| ( , ) − ( + 1, + 1)|, | ( + 1, ) − ( , + 1)|) (7)
Based on this theory, the edge extraction of the image can be achieved with the help of the OpenCV open source
library.

Display System
After the display system receives the 3D modeling data and the wildfire boundary data, it first performs on-site
restoration based on the 3D modeling data, and then uses the drawing function in the OpenCV to draw the
boundary on the live image based on the forest fire boundary data. The final image after processing is displayed
on a screen. In addition, the fire location, fire area, wind direction, wind speed and other related data are displayed
on the screen according to the requirements of the on-site commanders, what they need most is the wind direction
and the location of the fire area. The final effect is shown in Figure 6.

 Figure 6. Display system

EXPERIMENT TESTING

3D Modeling Using Visible Light Image
We choose an open area in a mountainous area as the experimental site, and the DJI MATRICE 300 RTK UAV
and H20T multi-function mounted camera to shoot. Before the experiment, we placed a number of 1m*1m red
square cloths on the ground as simulated fire points. To ensure accuracy, the distance between each cloth was
about ten meters. The drone uses 45°tilt photography when shooting, and uses laser ranging to measure the
longitude and latitude of each point. After acquiring the image data, mark the simulated fire position on Google
Earth, numbered 1-5, and use the image overlay function for 3D modeling. After modeling, mark the simulated
fire points in the three-dimensional image, numbered A-E, and the effect is shown in Figure 7.

 WiP Paper – Geospatial Technologies and Geographic Information Science for Crisis Management
 Proceedings of the 18th ISCRAM Conference – Blacksburg, VA, USA May 2021
 Anouck Adrot, Rob Grace, Kathleen Moore and Christopher Zobel, eds. 531
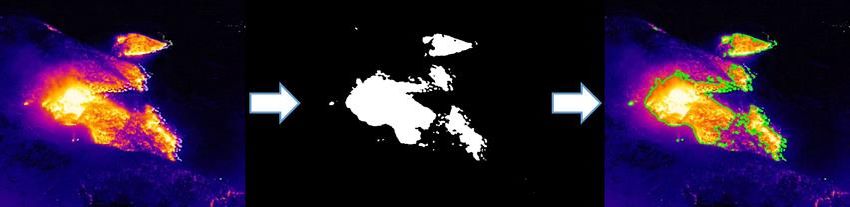
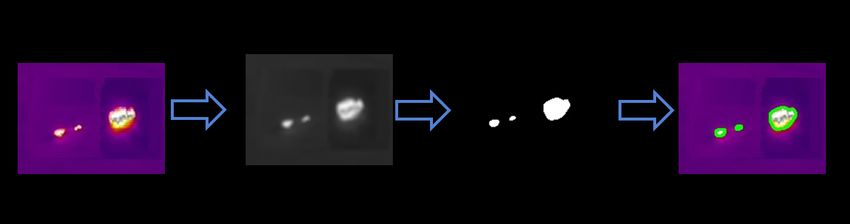
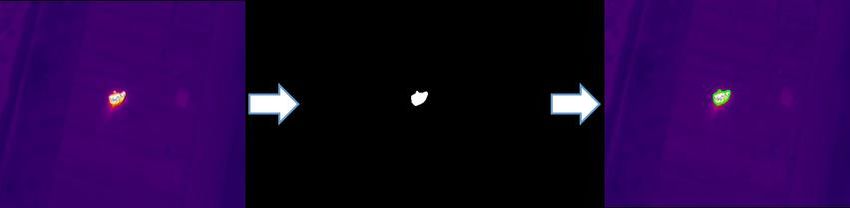
Wang et al. UAV and GIS Display System for Forest Fire

 Figure 7. 3D modeling diagram
Using the distance ruler in Google Earth to measure the distance between the corresponding simulated fire points
to estimate the error in the 3D modeling. The maximum distance in the figure above is 12.1 meters, the minimum
is 3.81 meters, and the average is 7.328 meters. According to the regulations, from the discovery of fire to the fire
alarm should be within one minute. Considering the limit case, the maximum distance of forest fire spread in one
minute can be used as the upper limit of error. Crown fire spreads at a speed of about 83m/min ~ 133m/min
without obstruction along the wind (Xu et al., 2012), which is one of the most harmful forest fires. So, the error
should not exceed 133m, and the above differences are all within the allowable range of error. Subsequently, UAV
was used for multi-directional and multi angle shooting. Considering the camera deviation angle and pitch angle,
28 points were selected for 3D modeling and error distance measurement. The detailed results are shown in Table
1. Among the 28 points, the maximum distance error is 26.85 meters, the minimum is 1.37 meters, and the average
value is 13.59, which is also within the allowable range of error. It can be seen that the results of using Google
Earth to perform 3D modeling to restore the forest fire scene are reliable.
 Table 1. Simulation fire point statistics table
 Simulated Distance Simulated Distance Simulated Distance Simulated Distance
 fire point difference(m) fire point difference(m) fire point difference(m) fire point difference(m)
 1 3.91 8 12.03 15 15.71 22 3.77
 2 5.19 9 3.83 16 12.73 23 1.37
 3 4.88 10 5.23 17 22.00 24 10.10
 4 14.29 11 20.69 18 23.06 25 13.28
 5 25.15 12 26.85 19 15.84 26 12.92
 6 6.57 13 19.92 20 15.89 27 17.19
 7 8.48 14 15.60 21 20.98 28 23.01
 Maximum value:26.85
 minimum value:1.37
 average value:13.59

Fire Boundary Extraction Using Thermal Imaging Image
We use the UAV images of the forest fire that occurred in Foshan City, Guangdong Provenience in December
2019 as our experimental data. Two typical images are selected, one is an image of a small fire when the forest
fire just happened, the other is an image of relatively a large fire after it spread for some time.
From Figure 8, it can be seen that as long as there is a forest fire in the UAV shooting screen, the fire boundary
can be extracted clearly.

 WiP Paper – Geospatial Technologies and Geographic Information Science for Crisis Management
 Proceedings of the 18th ISCRAM Conference – Blacksburg, VA, USA May 2021
 Anouck Adrot, Rob Grace, Kathleen Moore and Christopher Zobel, eds. 532
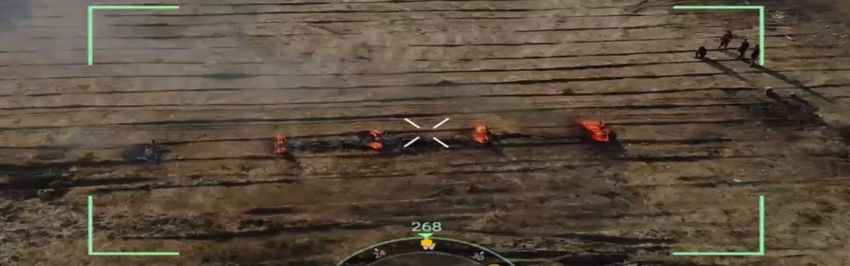
Wang et al. UAV and GIS Display System for Forest Fire

 Small fire area

 Big fire area
 Figure 8. Firewire extraction display

Real-Time Display Test
We also test the real-time performance of our system. We ignited a few piles of wood in an open field to simulate
the fire, as shown in Figure9(a). At the same time, we use drones to shoot live scenes and display them on the
large screen of the system through algorithm processing, as shown in figure9(b). In the middle of the large screen
is the result of 3D modeling and visible light image superposition. The red point is the location of the fire point
calculated by the system's algorithm. It can be seen that there is a certain error, but it is not more than 10 metres,
which is acceptable. The top right is the fire location extracted from the thermal imaging image, and the bottom
right is the live video streaming. After experimental testing, the entire system has a delay of about 2s, which can
meet the requirements of real-time display.

 Figure 9(a). On-site fire display

 Figure 9(b). Real-time display

 WiP Paper – Geospatial Technologies and Geographic Information Science for Crisis Management
 Proceedings of the 18th ISCRAM Conference – Blacksburg, VA, USA May 2021
 Anouck Adrot, Rob Grace, Kathleen Moore and Christopher Zobel, eds. 533
Wang et al. UAV and GIS Display System for Forest Fire

CONCLUSION
The realization of the system gives a solution to the lack of on-site information, which is very significant during
forest fire rescue. This system is based on UVA and GIS. Through visible light cameras and infrared cameras and
Google Earth, the system completes the three-dimensional modeling and the restoration of the forest fire, forest
fire boundary extraction and some other functions. With the help of this system, the commander can formulate a
scientific and reasonable rescue plan based on the actual situation of the forest fire. The system has a playback
function, which is also a great help to the review and summary. There are still some improvements that can be
done in the future. The current method is only suitable for small-scale forest fires. When faced with a complex
fire environment such as smoke, fire tornados, wind, and so on, the system may be disturbed. In the future, we
will conduct large-scale fire experiments to explore these issues.

REFERENCES
Cui, J., Ma, X., & Li, J. (2009). Early warning of forest fire based on multispectral detection. Journal of Northeast
 Forestry University, 37(7), 128-129.
Grangeat, A., Raclot, S., Brill, F., & Lapebie, E. (2016). Mapping of Areas Presenting Specific Risks to
 Firefighters Due to Buried Technical Networks. International Journal of Information Systems for Crisis
 Response and Management, 8(3), 51-63.
Huang, K., Zhu, J., Huang, Y., Zhou, B., Zhong, J. (2013). Fire Automatic Detection System Based on Doppler
 Weather Radar. Meteorological Monthly, 39(02), 241-248.
Jiang, H., Jiang, H. (2013). The Importance of Forest Fire Prevention and Countermeasures. Technology and
 Enterprise, (24) 21.
Jiang, M., Liu, H., Huang, H. (2009). Research on Image Binarization Technology. Software Guide, 8(04), 175-
 177.
Jiao, Z. (2019). Research in UAV System for Forest Fire Prevention. Xi'an University of Technology.
Liu, J., Wang, L., Teng, F., Li, D., Wang, X., Cao, H. (2015). Crop area ground sample survey using Google Earth
 image-aided. Transactions of the Chinese Society of Agricultural Engineering, 31(24), 149-154.
Nadal-Serrano, J. M. (2010). Towards very simple, yet effective on-the-go incident response preplanning: using
 publicly-available GIS to improve firefighters’ traditional approach. In Proc. of the 7th Int. ISCRAM
 Conference, Seattle, USA.
Rusli, N., Majid, M. R., & Din, A. H. M. (2014). Google Earth's derived digital elevation model: A comparative
 assessment with Aster and SRTM data. In IOP Conference Series: Earth and Environmental Science (Vol. 18,
 No. 1, p. 012065). IOP Publishing.
Vandecasteele, F., Kumar, K., Milleville, K., & Verstockt, S. (2019). Video Summarization and Video Highlight
 Selection Tools To Facilitate Fire Incident Management. In ISCRAM.
Wardihani, E., Ramdhani, M., Suharjono, A., Setyawan, T. A., Hidayat, S. S., Helmy, S. W., ... & Saifullah.
 (2018). Real-time forest fire monitoring system using unmanned aerial vehicle. Journal of Engineering
 Science and Technology, 13(6), 1587-1594.
Wang, Y., Shao, W., Luo, X. (2010). Analysis on accuracy of Google Earth data and its applications in optimized
 design on railway routes. Railway Investigation and Surveying, 5, 68-71.
Wei, N., Xiao, B., Cai, L. H., She, G. Y., Hang-Feng, Q. U., & Shan, H. E. (2019). Research on forest safety fire
 prevention system based on GIS. Forestry Machinery & Woodworking Equipment,47(12), 16-19.
Xu, M., Ma, W. Drought Climate Factors and Forest fire. (2012). Journal of Glaciology and Geocryology, 34(03),
 603-608.
Yan, D., Li, Q. (2017). Present situation and Prospect of Forest Fire Monitoring System in China. Forest Fire
 Prevention, (03), 27-30+54.
Yan, H., Wang, J., Wu, Y. (2005). Application and Principle of Meteorological Satellite in Forest Fire Monitoring.
 Forest Fire Prevention, (03), 29-32.
Zhang, J. (2018). China Forestry and Grassland Statistical Yearbook. China Forestry Press, 4-5.
Zhang, Q., Shi, P. (2000) Edge Detection Method of Color Image Based on HSV Space. Computer Simulation,
 (06), 25-27+32.
Zhang, Z., Wang, B., Xiao-Jie, W. U., & Zhao, E. W. (2015). An algorithm of forest fire detection based on uav

 WiP Paper – Geospatial Technologies and Geographic Information Science for Crisis Management
 Proceedings of the 18th ISCRAM Conference – Blacksburg, VA, USA May 2021
 Anouck Adrot, Rob Grace, Kathleen Moore and Christopher Zobel, eds. 534
Wang et al. UAV and GIS Display System for Forest Fire

 remote sensing. Remote Sensing Information, 30(01), 107-110+124.
Zhang, Z., Xu, W. (2020). Emergency Management System in China: Lessons Learned from Australia 2019-20
 Bushfires. Emergency rescue in China, (02), 18-22.

 WiP Paper – Geospatial Technologies and Geographic Information Science for Crisis Management
 Proceedings of the 18th ISCRAM Conference – Blacksburg, VA, USA May 2021
 Anouck Adrot, Rob Grace, Kathleen Moore and Christopher Zobel, eds. 535
You can also read