GLOBAL IPO WATCH Q2 2021 - A PWC GLOBAL IPO CENTRE PUBLICATION
←
→
Page content transcription
If your browser does not render page correctly, please read the page content below

Global IPO Watch
Q2 2021
A PwC Global IPO Centre publication

Q2 2021 in review and outlook for the remainder of 2021
Q2 2021 in review                                                                                   Outlook for the remainder of 2021

Global indices end the first half with gains as economies recover                                   Global recovery to remain on track, inflation is a growing concern
Global equity markets delivered yet another strong quarter in Q2 2021, with indices in the US and   Whilst the signs are pointing towards global economies staying on the recovery path, inflation and
Europe reaching a number of record highs and closing H1 with double digit gains. Reopening of       a resurgence of COVID-19 remain potential sources of volatility. The key for central banks will be
global economies boosted by the rollout of the vaccination programmes, strong macroeconomic         to navigate between these two risks and this path will have a fundamental bearing on equity
indicators and accommodative monetary policies, all contributed to the strong equity markets        markets in H2 2021. If inflation begins to take off, an increase in interest rates could put the
sentiment. However, as the second quarter progressed, investors’ focus was shifting towards the     brakes on the equity markets bull run. However, there is a view that the current inflation spike is
pace of the recovery and inevitable implications for inflation including potential interest rates   temporary and that the major central banks are still years away from raising interest rates,
hikes, as demonstrated by the hawkish tone from the Federal Reserve.                                especially with COVID-19 remaining a risk to the downside for economies – if this is the case, the
                                                                                                    tailwinds to equity markets will remain in place.
Strong Q2 2021 global IPO activity to close record breaking first half
                                                                                                    Strong IPO issuance is expected in H2 2021, innovation is front of mind
A combination of strong equity markets, downward trend in volatility and supportive valuations
provided an ideal backdrop for IPO issuance with H1 achieving record IPO issuance globally. The     With positive market sentiment providing continued support to global IPO activity and a significant
first half of 2021 delivered 1,309 IPOs raising US$334bn, with both the Americas and EMEA IPO       number of companies gearing up for IPOs or SPAC mergers, we expect a steady pipeline of deals
proceeds in H1 already exceeding total 2020 IPO proceeds. The $131.0bn raised in Q2 2021 is         in the second half of 2021. Ever since the traditional IPO route was disrupted by COVID-19,
$87.4bn higher than Q2 2020. The bullish market sentiment cooled a touch in second quarter          markets have adapted to virtual ways of working and innovation has been front of mind.
compared with the record first quarter as investors became more selective and price sensitive,
                                                                                                    As the SPAC market cooled in the US in Q2, we have seen an increased number of European
particularly in certain territories. From a sector perspective, technology, e-commerce and
                                                                                                    SPACs starting to trade on various exchanges in Europe, and this trend is likely to continue.
financials dominated new issuance activity in the first half.
                                                                                                    However, with a large number of SPACs looking to identify their targets, the focus will now be
                                                                                                    shifting towards SPAC mergers. The success of these so called “de-SPACing” transactions will
                                                                                                    have a significant impact on the SPAC model in public equity markets.
Index Rebased to 100

                                                                                                    ESG will continue to be a growing priority for investors
                                                                                                    We have noted in our earlier reports that ESG strategy has now become an important pillar of the
                                                                                                    equity story and value factor for IPOs. This continues to be evidenced in recent transactions, with
                                                                                                    investors integrating ESG considerations into their investment decision making process. A more
                                                                                                    robust ESG strategy, information on KPIs and reporting will be expected by investors from the
                                                                                                    companies looking to go public.

                                                                                                    Stuart Newman                                            Nadja Picard
                                                                                                    PwC IPO Centre Leader                                    PwC Europe Capital Markets Leader
                                                                                                    PwC United Kingdom                                       PwC Germany
Pw C | Global IPO Watch Q2 2021                                                                                                                                                                       2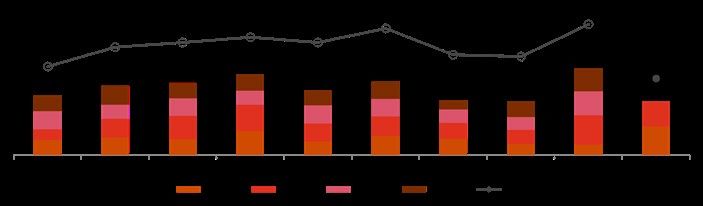
IPO and Further Offer (FO) Q2 2021 highlights.                                                                                          IPOs
                                                                                                                                        • Globally, there were 582 IPOs in Q2
                                                                                                                                          2021, raising a total of $131bn.
                                                                                                                                          Whilst below the record levels in Q1,
                                                                                                                                          this was significantly ahead of Q2
 Q2 2021 highlights                                                                                                                       2020 and one of the strongest
                                                                                                                                          second quarters on record.
                                  Wise w as the first fintech business to complete a                                                    • This can largely be attributed to a
                                  direct listing on the London Stock Exchange              Spanish B2B fund distribution                  slow down in SPAC activity in Q2,
                                  achieving a c.£9bn valuation. The share price w as       company Allfunds raised $2.6bn on              where proceeds raised fell by 83%
                                  determined via an opening auction, rather than           the Euronext Amsterdam Stock                   globally.
                                  through a traditional bookbuilding and price             Exchange. Its share price jumped by
                                  discovery process. Strong aftermarket                    10% on the first trading day.                • The Americas has seen a marked
                                  performance also indicated that investors w ere                                                         decrease in activity, with both
                                  satisfied w ith valuation and supportive of the story.                                                  number of deals and proceeds raised
                                                                                                                                          more than halving from last quarter.
                                                                                                                                          The two largest raises for the region
                                                                                                                                          in Q2 2021 have been by foreign
                                                                                                                                          companies.
                                                                                                                                        • The momentum in EMEA has
                                                                                                                                          continued, with Q2 raising the same
                                                                                                                                          level of proceeds as Q1, despite
                                                                                                                                          smaller average deal sizes.
The largest IPO globally in                                                                                                             • Activity in Asia-Pacific has trended
Q2 w as Chinese ride-hailing                                                                                                              upwards from the dip last quarter,
company DiDi Global raising                                                                                                               almost recovering to the high levels
US$4.4bn on the New York                                      Acciona Energia's
                                                                                                                                          seen in H2 2020.
Stock Exchange.                                               $1.6bn IPO w as the
                                                              largest IPO on the                                                        FOs
                 Other notable US                             Spanish Stock
                                                              Exchange in six years.                                                    • 889 FOs raised $209.4bn in Q2 2021,
                 technology IPOs in Q2                                                              . The largest IPO in Asia-Pacific
                 included AppLovin US$2bn                                                             w as JD Logistics Technology        a 16% decrease from Q1. The
                 IPO on NASDAQ and                                                                    w hich raised $3.6 bn on the        Americas is the only region with a
                 UiPath US$1.5bn IPO on                                                               Hong Kong Stock Exchange.           drop in activity.
                 NYSE.                                                                                Five more companies raised
                                                                                                      more than $1bn on exchanges       • There were several large raises in
                                                                                                      in Asia Pacific in Q2.              the quarter, with four of the top five
                                                                                                                                          transactions in H1 2021 occurring in
                                                                                                                                          April.
Pw C | Global IPO Watch Q2 2021                                                                                                                                                    3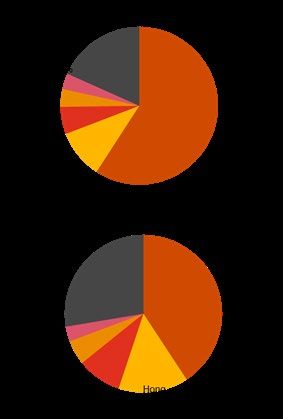
Global money raised via IPOs and FOs
 Global IPO activity continued apace in Q2 with both numbers and proceeds raised significantly ahead of the
 same quarter last year. FO activity lags both Q1 2021 and Q2 last year, albeit by a smaller amount. The US
 continues to hold its dominant position in global fundraising activity in the year to date.
                                   Global money raised via IPOs and FOs (10-year overview)                                                    Top countries 2021 YTD
IPO money raised & # of deals

                                                                                                                               Q2: $131.0bn

                                                                                                                Q2: $43.6bn

                                                                                                                                                                    % of total
                                                                                                                                                                    money raised
FO money raised & # of deals

                                                                                                                               Q2: $209.4bn
                                                                                                                Q2: $243.5bn

                                                                                                                                                                   % of total
Note: Top countries have been selected based on money raised in 2021YTD. Source: Dealogic as of 30 June 2021.                                                      money raised

 Pw C | Global IPO Watch Q2 2021                                                                                                                                              4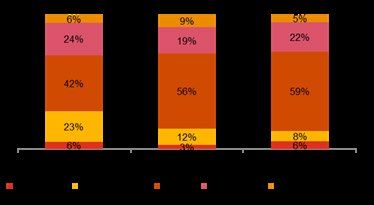
Overview of global IPO and FO activity
Whilst below the record Q1 levels, IPO value and volumes in Q2 2021 continued at the strong levels seen in
each of Q3 and Q4 2020. The decrease versus Q1 can, to a large extent, be attributed to a slowdown in US
SPAC activity. Despite a fall in numbers, average FO size has exceeded the previous four quarters.
                                                       Global IPO and FO activity
     IPOs                                                               FOs

                                     •   582 IPOs raised $131.0bn                                      •   FO activity remained
                                         in Q2 2021, w ith only 12.7%                                      elevated. Whilst the average
                                         ($16.6bn) attributable to                                         deal size of $236m has
                                         SPAC IPOs. This compares                                          exceeded the previous four
                                         to $97.7bn raised by SPACs                                        quarters, the drop in deal
                                         in Q1 2021.                                                       volumes has led to a
                                     •   The $131.0bn raised in Q2                                         decrease in overall
                                         2021 is $87.4bn higher than                                       proceeds raised.
                                         Q2 2022.                                                      •   Largest FO of the quarter by
                                     •   Other than Financials, the                                        Tencent Holdings Ltd in
                                         Industrials and Technology                                        Hong Kong raised $14.7bn;
                                         sectors led issuance in Q2                                        more than tw ice the size of
                                         w ith IPOs raising $21.3bn                                        the largest FO in Q1 21.
                                         and $21.0bn respectively.
    IPO pricing dynamics                                                Index performance
                                     •   94% of IPOs w ere priced in                                   •   Both MSCI World and S&P
                                         or above range in H1 2021,                                        500 indices continued their
                                         slightly low er than the 97%                                      rise in the 2nd quarter.
                                         in 2020.
                                                                                                       •   The performance of Hang
                                     •   Compared to Q1 2021, Q2
                                                                                                           Seng and FTSE 100 w as
                                         had more IPOs priced at top
                                                                                                           more subdued, remaining at
                                         of range.
                                                                                                           a level close to their 1st
                                                                                                           quarter close.

                                                                                            Source: Dealogic, Bloomberg as of 30 June 2021.

Pw C | Global IPO Watch Q2 2021                                                                                                               5
IPO and FO activity per region
  In both Americas and EMEA, IPO proceeds in H1 2021 have exceeded total 2020 proceeds, with EMEA almost doubling the
  total amount raised in the whole of 2020. IPO activity in Asia also more than doubled that of H1 2020. Whilst all three regions
  saw higher FO activity than H1 2020, the Americas has seen a relative slowdown, compared to Q1 2021 and Q2 2020.

                                     Americas                     EMEA                                      Asia-Pacific
IPO money raised & # of deals

                                           H1 20: $42.1bn                H1 20: $7.1bn                                    H1 20: $30.8bn

                                Q1   Q2      Q3         Q4   Q1   Q2       Q3            Q4          Q1           Q2             Q3            Q4
FO money raised & # of deals

                                           H1 20: $165.3bn
                                                                                                                          H1 20: $100.0bn
                                                                       H1 20: $75.3bn

 Pw C | Global IPO Watch Q2 2021                                                                     Source: Dealogic, Bloomberg as of 30 June 2021.   6
Volatility background to IPO and FO activity
Market volatility is starting to fall as signs of a global economic recovery from COVID-19 continue. The relatively
elevated volatility in H2 2020 and H1 2021 as compared to 2017 – 2019, has not dampened IPO and FO
activity which have achieved record levels in 2021
Money raised via IPOs and FOs versus volatility
Number of IPOs and FOs versus volatility
Source: Dealogic, Bloomberg as of 30 June 2021.
Pw C | Global IPO Watch Q2 2021 7Q2 2021 overview
Americas
Exceptional H1 new issuance activity, whilst SPAC markets cools in
Q2
H1 delivered exceptional new issuance activity. Q2 2021 IPO activity fell
compared to Q1 but still yielded proceeds of $63.3bn – more than twice the
level of proceeds raised in Q2 2020. The fall in number and proceeds
versus Q1 was largely attributable to a slow down in SPAC issuance as
investor sentiment to these vehicles cooled; SPAC proceeds have dropped
from US$96.0bn in Q1 to US$12.8bn in Q2. It is expected, however, that
IPO activity will remain high throughout the second half as current Although total Q2 2021 IPO volumes were
supportive market backdrop, low volatility and attractive valuations provide down compared to Q1 2021 given the
an appealing environment for issuers. slowdown in SPAC pricings, Q2 2021 saw
Economic growth is expected through the second half of 2021
99 traditional IPOs raise $40 billion - the
highest volume of traditional IPOs in 20
The US economy remains on track for recovery and it is expected that years. The market is conducive for IPOs
2021 will possibly record the strongest growth in recent history. Equity and the pipeline is strong.
markets also did not disappoint investors with both S&P and NASDAQ
posting H1 gains, boosted by earnings growth on the back of economic
reopening progress. Inflation remains a key risk with markets closely Michael Bellin David Ethridge
watching Federal Reserve’s communications around potential rates IPO Services Co-Leader IPO Services Co-Leader
increase.
PwC US PwC US
Brazil remains the second busiest IPO market in America
Despite some volatility in the market caused by COVID-19, Brazil IPO
market was the second busiest in the Americas. Similar to other regions,
technology, financials and healthcare dominated the new issuance. Retail
investor participation also continued to grow and is expected to provide
additional boost to the Brazilian equity market.
Pw C | Global IPO Watch Q2 2021 8Overview of IPO and FO activity in the Americas
There is a marked decrease in Q2 IPO activity in Americas compared to Q1, as both deal number and deal
proceeds more than halved. This can almost all be attributed to the impact of SPACs, for which proceeds have
dropped from $96.0bn to $12.8bn.
IPO and FO activity in the Americas
IPOs FOs
• Proportion of SPAC IPOs • FO activity has fallen
has fallen from 67% to 20% from the exceptionally
of total region proceeds, as high level in Q1 2021.
the SEC applies increasing Both number of deals and
scrutiny to these amount raised have been
companies and PIPE the lowest since Q1
funding dries up. 2020.
• Some of the largest IPO • Altimeter Growth Corp
raises of the quarter, such raised $4.0bn in the
as DiDi Global Inc and biggest FO of the quarter,
Oatly Group AB, are non- funding the merger
American companies. between the SPAC and
Grab, Southeast Asia's
most valuable start-up.
IPO pricing dynamics Index performance
• Whilst the proportion of • The Dow Jones and S&P
IPOs pricing in range has 500 continued a steady
declined, an increasing ascent in Q2.
number IPOs have priced
• The technology heavy
at top of range in H1 2021,
NASDAQ lost ground in
compared to 2020.
May 2021, as investors
• 2020 has the most
became increasingly
proportion of IPOs pricing
concerned about future
in or above range.
interest rate hikes, before
recovering in June.
Note: IPOs are classified as ‘In Range’ if the IPO is priced in the middle 50% of the price
range. The top and bottom 25% are classified as ‘Top of Range’ and ‘Bottom of Range’. Source: Dealogic, Bloomberg as of 30 June 2021.
Pw C | Global IPO Watch Q2 2021 9Top countries in the Americas – IPOs
Three countries, namely the US, Brazil and Canada, accounted for all the IPOs in the region for 2021. In
contrast to the US, which experienced a marked decline in IPO activity in Q2 compared to Q1 (c.70%), Canada
saw a slight uptick during the quarter.
Q2 2021
By number of IPOs By proceeds
Ranking Country Number of deals % of region deals % of global deals Ranking Country Proceeds ($bn) % of region proceeds % of global proceeds
1 United States 180 91% 31% 1 United States 59 93% 45%
2 Brazil 13 7% 2% 2 Brazil 2.7 4% 2%
3 Canada 5 2% 1% 3 Canada 1.6 3% 1%
4 N/A - - - 4 N/A - - -
5 N/A - - - 5 N/A - - -
Total – top 5 countries 198 100% 58% Total – top 5 countries 63.3 100% 48%
2021 YTD
By number of IPOs By proceeds
Ranking Country Number of deals % of region deals % of global deals Ranking Country Proceeds ($bn) % of region proceeds % of global proceeds
1 United States 579 94% 44% 1 United States 198.9 96% 60%
2 Brazil 28 4% 2% 2 Brazil 6.2 3% 2%
3 Canada 10 2% 1% 3 Canada 2.2 1% 1%
4 N/A - - - 4 N/A - - -
5 N/A - - - 5 N/A - - -
Total – top 5 countries 617 100% 47% Total – top 5 countries 207.2 100% 62%
Note: Top countries have been selected based on money raised or number of IPOs
in 2021. For IPOs which take place on two or more exchanges, the full amount of
money raised is attributed to all exchanges.
Source: Dealogic as of 30 June 2021
Pw C | Global IPO Watch Q2 2021 10Top countries in the Americas – FOs
There was 1 FO in Chile during the Q2, as real estate developer Corporacion Inmobiliaria Vesta SAB De CV
raised $0.2bn. Several large FOs took place in Brazil, with 14 transactions raising $8.0bn in total.
Q2 2021
By number of FOs By proceeds
Ranking Country Number of deals % of region deals % of global deals Ranking Country Proceeds ($bn) % of region proceeds % of global deals
1 United States 240 86% 27% 1 United States 62.6 85.7% 30%
2 Canada 23 8% 3% 2 Brazil 8.0 10.9% 4%
3 Brazil 14 5% 2% 3 Canada 2.3 3.1% 1%
4 Others 1 >1% >1% 4 Others 0.2 >1% >1%
5 N/A - - - 5 N/A - - -
Total – top 5 countries 278 100% 31% Total – top 5 countries 73.0 100% 35%
2021 YTD
By number of FOs By proceeds
Ranking Country Number of deals % of region deals % of global deals Ranking Country Proceeds ($bn) % of region proceeds % of global deals
1 United States 799 86% 37% 1 United States 186.3 90% 50%
2 Canada 103 11% 5% 2 Brazil 10.8 5% 2%
3 Brazil 24 3% 1% 3 Canada 8.6 4% 2%
4 Others 2 1%
5 N/A - - - 5 N/A - - -
Total – top 5 countries 928 100% 43% Total – top 5 countries 206.1 100% 45%
Note: Top countries have been selected based on money raised or number of IPOs
Initial secondary listings included in 2021 FO data includes 21 deals ($1.7bn proceeds). in 2021. For IPOs which take place on two or more exchanges, the full amount of
money raised is attributed to all exchanges.
The top 10 largest Initial secondary listings are included on page 32. Source: Dealogic as of 30 June 2021
Pw C | Global IPO Watch Q2 2021 11Q2 2021 overview
EMEA
Strongest H1 2021 European IPO activity in recent history
In the past three months equity markets in Europe hit several all time highs
supported by positive economic data, further rollout of vaccination
programmes and optimism in terms of the overall reopening of businesses.
Hence new issuance gained further momentum and reported the strongest
six months since the turn of the millennium.
Blue sky is slowly turning grey
Despite the lowest volatility levels this quarter since the start of the European IPO activity in the second quarter
pandemic and the record-breaking H1 performance, investors are of 2021 has continued at a strong pace,
becoming increasingly concerned about inflation and how central banks
are handling the rising pressure on prices, most prominently measured by achieving the busiest first half in recent
higher commodity prices. Consequently, investors continue to be more history. The European IPO pipeline
selective and price sensitive as this year’s high valuation levels are tested continues to be strong and new issuance
further. momentum looks set to continue in the
Strong H2 2021 IPO pipeline expected
second half of the year.
As investor sentiment remains positive, the issuance activities are
expected to be record-breaking for the second half of 2021 as long as Mark Hughes Carsten Stäcker
global equity markets stay robust and macroeconomic indicators continue Partner, Capital Markets Partner, Equity Advisory
to be supportive. This might hold true also for the European SPAC market,
which enjoys a broader sector coverage spread among the major
PwC United Kingdom PwC Germany
European stock exchanges.
Pw C | Global IPO Watch Q2 2021 12Overview of IPO and FO activity in EMEA
The strong IPO momentum in Q1 2021 continued, with the same amount of proceeds of $27.5bn being raised
this quarter, albeit across a higher number IPOs. FO activity increased further, with proceeds raised exceeding
Q2 last year by more than 10%.
IPO and FO activity in EMEA
IPOs FOs
• Financials and Consumer • Average size of FOs has
Discretionary sectors increased in Q2, with 6 of
dominated EMEA IPOs, the 10 largest raises this
accounting for 49% of year taking place in the
total proceeds raised in quarter.
the quarter.
• There was an increase in • German headquartered
SPAC activity in the food delivery services,
region, with these Delivery Hero, completed 2
companies raising significant FOs in 2021,
$3.7bn, compared to raising $3.0bn in total, as
$1.6bn in Q1 2021. the lockdown winner eyes
new investment
opportunities.
IPO pricing dynamics Index performance
• Whilst there were no • The FTSE 100 recovery
IPOs pricing above range continued to lag behind the
in H1, EMEA IPOs other major European
continued to price indices following on from a
favourably in the quarter. turbulent 2020. It is also the
Proportion of deals only index that is yet to
pricing in or at top of recover to a pre-pandemic
range has increased by level.
10%, compared to 2020. • The DAX continues to be
the best performer out of
the three.
Note: IPOs are classified as ‘In Range’ if the IPO is priced in the middle 50% of the price
range. The top and bottom 25% are classified as ‘Top of Range’ and ‘Bottom of Range’. Source: Dealogic, Bloomberg as of 30 June 2021.
Pw C | Global IPO Watch Q2 2021 13Top countries in EMEA – IPOs
Sweden continues to top the region in number of IPOs, accounting for 20% of all deals year-to-date. Germany has
had a buoyant quarter in terms of deal value, with 11 transactions raising a total of $5.3bn. The UK tops the rankings
for proceeds raised in H1 2021, due to the strong performance in the previous quarter.
Q2 2021
By number of IPOs By proceeds
Ranking Country Number of deals % of region deals % of global deals Ranking Country Proceeds ($bn) % of region proceeds % of global proceeds
1 Sweden 34 23% 6% 1 Germany 5.3 19% 4%
2 United Kingdom 22 15% 4% 2 Netherlands 4.3 15% 3%
3 France 16 11% 3% 3 United Kingdom 3.8 14% 3%
4 Norway 15 10% 3% 4 Sweden 3.5 13% 3%
5 Denmark 12 8% 2% 5 France 1,9 7% 1%
Total – top 5 countries 99 68% 17% Total – top 5 countries 18.8 68% 14%
2021 YTD
By number of IPOs By proceeds
Ranking Country Number of deals % of region deals % of global deals Ranking Country Proceeds ($bn) % of region proceeds % of global proceeds
1 Sweden 48 20% 4% 1 United Kingdom 12.1 22% 4%
2 United Kingdom 43 18% 3% 2 Germany 10.7 19% 3%
3 Norway 42 18% 3% 3 Netherlands 9.9 18% 3%
4 France 19 8% 1% 4 Sweden 5.8 11% 2%
5 Denmark 16 7% 1% 5 Norway 3.8 7% 1%
Total – top 5 countries 168 71% 13% Total – top 5 countries 42.3 77% 13%
Note: Top countries have been selected based on money raised or number of IPOs
in 2021. For IPOs which take place on two or more exchanges, the full amount of
money raised is attributed to all exchanges.
Source: Dealogic as of 30 June 2021
Pw C | Global IPO Watch Q2 2021 14Top countries in EMEA – FOs
The United Kingdom has seen the strongest FO activity within the region, both in deal numbers and proceeds.
Spain had a particularly large transaction during the quarter, being the rights offer of Cellnex Telecom SA that
raised $8.4bn.
Q2 2021
By number of FOs By proceeds
Ranking Country Number of deals % of region deals % of global deals Ranking Country Proceeds ($bn) % of regional proceeds % of global proceeds
1 United Kingdom 102 21% 6% 1 United Kingdom 11.7 21% 6%
2 Sweden 55 17% 4% 2 Spain 9.2 17% 4%
3 Norway 28 15% 4% 3 France 8.1 15% 4%
4 Germany 24 11% 3% 4 Germany 5.9 11% 3%
5 France 21 10% 3% 5 Sweden 5.3 10% 3%
Total – top 5 countries 230 74% 19% Total – top 5 countries 40.2 74% 19%
2021 YTD
By number of FOs By proceeds
Ranking Country Number of deals % of region deals % of global deals Ranking Country Proceeds ($bn) % of regional proceeds % of global proceeds
1 United Kingdom 206 37% 9% 1 United Kingdom 23.2 23% 5%
2 Sweden 94 17% 4% 2 Germany 14.0 14% 3%
3 Norway 60 11% 3% 3 Spain 10.9 11% 2%
4 Germany 51 9% 2% 4 France 9.6 10% 2%
5 France 38 7% 2% 5 Sweden 9.2 9% 2%
Total – top 5 countries 449 80% 17% Total – top 5 countries 66.9 67% 15%
Note: Top countries have been selected based on money raised or number of IPOs
Initial secondary listings included in 2021 FO data includes 4 deals (Q2 2021 overview
Asia-Pacific
China reduces bank reserve requirements to support economic
growth
The People’s Bank of China signaled that the reserve requirement ratio
(RRR) could be cut to 50 bps for most banks with the aim of releasing a
liquidity reserve of more than $100bn to boost the Chinese economy. Such
stimulating measures are expected to further help the economy to rebound
to pre-pandemic levels as smaller companies struggle in light of increasing China and Hong Kong capital
commodity prices and other uncertainties currently to be faced in the markets stand to directly benefit
market.
from strong domestic economic
China and Hong Kong remain go-to IPO markets
recovery and the current geo-
As global equity markets rallied in H1 2021, China continued to lead the political environment as the trend of
IPO activities in the region followed by Hong Kong. For the latter, strong
activity is expected for the second half of 2021 as regulators propose to returnee home coming listing is
streamline the listing process for foreign issuers by introducing a new expected to continue in the second
platform FINI (Fast Interface for New Issuance). FINI helps to shorten the half of the year.
gap between IPO pricing and trading and thereby overall digitalise the
settlement process for market participants as well as regulatory authorities.
Kennedy Liu Geoffrey Tang
Chinese scrutiny ramps up and might put overseas IPO plans on hold Director, Capital Markets
Head of Capital Markets
Despite favourable market conditions, many Chinese overseas IPO PwC China
candidates might face additional scrutiny by domestic authorities - as the
PwC China
largest IPO in Q2, Didi Global that listed on the NYSE, demonstrated. Just
shortly after its US-market debut a ban hit the ride-sharing app due to
privacy concerns leading to double-digit stock price decline. Such
tightening of Chinese securities regulations and antitrust probes might
shake up the IPO community as regulators at home try to exert control over
local businesses that are listed abroad.
Pw C | Global IPO Watch Q2 2021 16Overview of IPO and FO activity in Asia-Pacific
IPO activity in Q2 has recovered from the dip experienced in the previous quarter. Proceeds from FO also
increased despite a decline in number of deals, as Tencent’s offering raised $14.7bn in April and was more than
twice the size of the second largest deal.
IPO and FO activity in Asia-Pacific
IPOs FOs
• IPO activity in the region • There were several large
has remained buoyant as FOs in the region during the
compared to the COVID- quarter, including Tencent,
19 impacted H1 2020. Meituan and Renasas
Electronics, raising $25.1bn
• The performance of the in total and accounting for
Industrials sector was 30% of proceeds in Q2
particularly strong in the 2021.
quarter, as JD Logistics
Inc raised $3.6bn and • Technology and Financial
was the second largest sectors dominated the
transaction year-to-date. region, accounting for 57%
of all proceeds raised.
IPO pricing dynamics Index performance
• Whilst no IPOs priced
• All three main indices are
above range, there has
now above their pre
been a steady increase in
pandemic level.
the proportion of IPOs
priced in range and at top • Nikkei 225 has continued to
of range from 2019 to H1 outperform, although the
2021. gap between it and the SSE
• More Asia-Pacific IPOs Composite has narrowed in
priced at the top of range this quarter.
than any other region.
Note: IPOs are classified as ‘In Range’ if the IPO is priced in the middle 50% of the price
range. The top and bottom 25% are classified as ‘Top of Range’ and ‘Bottom of Range’.
Source: Dealogic, Bloomberg as of 30 June 2021.
Pw C | Global IPO Watch Q2 2021 17Top locations in Asia-Pacific – IPOs
Mainland China continues to top the charts for both number of IPOs and proceeds raised. One offering in South
Korea, by SK IE Technology Ltd, raised $2.0bn and ranked the country among the top five in terms of proceeds for
this quarter. Despite a relatively large number of deals in Japan, these were at a lower level of proceeds raised.
Q2 2021
By number of IPOs By proceeds
Ranking Location Number of deals % of region deals % of global deals Ranking Location Proceeds ($bn) % of region proceeds % of global proceeds
1 Mainland China 138 58% 24% 1 Mainland China 20.6 51% 16%
2 Australia 31 13% 5% 2 Hong Kong 7.7 19% 6%
3 Japan 27 11% 5% 3 India 3.2 8% 2%
4 Hong Kong 14 6% 2% 4 Thailand 2.1 5% 2%
5 India 7 3% 1% 5 South Korea 2.0 5% 2%
Total – top 5 locations 217 91% 37% Total – top 5 locations 35.6 89% 27%
2021 YTD
By number of IPOs By proceeds
Ranking Location Number of deals % of region deals % of global deals Ranking Location Proceeds ($bn) % of region proceeds % of global proceeds
1 Mainland China 254 56% 19% 1 Mainland China 33.1 46% 7%
2 Japan 51 11% 4% 2 Hong Kong 18.5 26% 4%
3 Australia 48 11% 4% 3 India 4.7 7% 1%
4 Hong Kong 41 9% 3% 4 Australia 3.7 5% 1%
5 India 25 5% 2% 5 South Korea 3.3 5% 1%
Total – top 5 locations 419 92% 32% Total – top 5 locations 63.4 88% 14%
Note: Top countries have been selected based on money raised or number of IPOs
in 2021. For IPOs which take place on two or more exchanges, the full amount of
money raised is attributed to all exchanges.
Source: Dealogic as of 30 June 2021
Pw C | Global IPO Watch Q2 2021 18Top locations in Asia-Pacific – FOs
Whilst more than 30% of the FOs in the region took place in Australia, these transactions contributed just 7% of
total proceeds. Hong Kong and Mainland China account for more than 70% of total Asia-Pacific FO proceeds
raised, both for this quarter and year-to-date, with FO proceeds in Hong Kong more than doubling last quarter.
Q2 2021
By number of FOs By proceeds
Ranking Location Number of deals % of region deals % of global deals Ranking Location Proceeds ($bn) % of region proceeds % of global proceeds
1 Australia 111 34% 12% 1 Hong Kong 41.8 51% 20%
2 Mainland China 81 24% 9% 2 Mainland China 20.4 25% 10%
3 Hong Kong 71 21% 8% 3 Japan 5.6 7% 3%
4 India 24 7% 3% 4 Australia 5.5 7% 3%
5 Japan 16 5% 2% 5 India 4.6 6% 2%
Total – top 5 locations 303 92% 34% Total – top 5 locations 77.9 95% 37%
2021 YTD
By number of FOs By proceeds
Ranking Location Number of deals % of region deals % of global deals Ranking Location Proceeds ($bn) % of region proceeds % of global proceeds
1 Australia 218 32% 10% 1 Hong Kong 65.7 43% 14%
2 Mainland China 167 24% 8% 2 Mainland China 41.7 28% 9%
3 Hong Kong 148 21% 7% 3 India 11.2 7% 2%
4 India 50 7% 2% 4 Australia 10.7 7% 2%
5 Japan 43 6% 2% 5 Japan 10.1 7% 2%
Total – top 5 locations 626 91% 29% Total – top 5 locations 61.6 92% 31%
Note: Top countries have been selected based on money raised or number of IPOs
Initial secondary listings included in 2021 FO data includes 10 deals ($11.4bn proceeds). in 2021. For IPOs which take place on two or more exchanges, the full amount of
The top 10 largest Initial secondary listings are included on page 32. money raised is attributed to all exchanges.
Source: Dealogic as of 30 June 2021
Pw C | Global IPO Watch Q2 2021 19Basis of preparation
• The Global IPO Watch analyses IPO and FO trends on a quarterly basis, both at a
global and regional level.
• It is based on data extracted from Dealogic, whereby only transactions with a
minimum of $5 million money raised have been included.
• Transaction proceeds include the overallotment option (if exercised).
• The data excludes PIPOs and transactions on Over-The-Counter exchanges.
• In case IPOs or FOs take place on two or more exchanges, the full amount of
money raised is attributed to all exchanges. The same applies to countries and
regions. This does not apply to two exchanges within the same country or two
countries within the same region.
• Secondary listings (“Initial secondary listings”) are classified as FOs. A footnote has
been added to the relevant analysis to highlight secondary listing transactions. The
top 10 largest Initial secondary listings are included on page 32.
• Country indicates the company’s country of domicile.
• Industry classification is based on the FTSE Russell Industry Classification
Benchmark.
• Index performance is based on pricing data extracted from Bloomberg.
Pw C | Global IPO Watch Q2 2021 20Contacts
Stuart Newman David Ethridge
PwC Global IPO Centre Leader – PwC UK IPO Services Co-Leader - PwC US
stuart.newman@pwc.com david.a.ethridge@pwc.com
Mark Hughes Michael Bellin
Partner, Capital Markets – PwC UK IPO Services Co-Leader - PwC US
mark.c.hughes@pwc.com michael.j.bellin@pwc.com
Nadja Picard Kennedy Liu
PwC Europe Capital Markets Leader – PwC Germany Head of Capital Markets - PwC China
nadja.picard@pwc.com kennedy.liu@hk.pwc.com
Carsten Stäcker Geoffrey Tang
Partner, Equity Advisory – PwC Germany Director, Capital Markets - PwC China
carsten.staecker@pwc.com geoffrey.tang@hk.pwc.com
Pw C | Global IPO Watch Q2 2021 21Appendices • IPO and FO activity statistics • Leading transactions 2021 • IPO and FO activity per sector Pw C | Global IPO Watch Q2 2021 22
IPO and FO activity statistics

                                  Global IPO and FO activity                                                                          IPO and FO activity in the Americas
                                     2019       2020        2021       Q2 2019    Q2 2020    Q2 2021                                      2019        2020        2021       Q2 2019    Q2 2020    Q2 2021
IPO activity                                                                                            IPO activity
Number of IPOs                       1040       1415        1309         290        196        582      Number of IPOs                     251         513         617         89          66       198
  % sponsor-backed                   6.6%       9.4%        13.1%       10.7%      8.2%       14.1%       % sponsor-backed                15.1%       19.9%       19.6%      19.1%       22.7%     25.3%
Money raised                       $199.2bn    $331.3bn    $333.9bn    $66.1bn    $43.6bn    $131.0bn   Money raised                     $74.1bn     $190.1bn    $207.2bn    $35.6bn    $26.2bn    $63.3bn
  % sponsor-backed                  18.2%       24.5%       25.8%       26.4%      26.0%      30.9%       % sponsor-backed                24.8%       33.3%       30.0%      28.1%       41.5%     42.8%

Advanced m etrics                                                                                       Advanced m etrics
Free float %                        31.1%       37.7%       44.2%       32.6%      31.9%      33.3%     Free float %                      40.0%       56.7%       59.5%      35.3%       48.0%     39.6%
Overallotment exercised (%)         32.0%       34.6%       32.3%       38.7%      33.0%      21.4%     Overallotment exercised (%)       74.8%       72.3%       58.0%      80.0%       73.4%     45.9%
% secondary shares                  12.3%       9.7%        10.9%       14.7%      6.4%       12.1%     % secondary shares                4.9%        4.2%        3.9%        6.3%       4.0%       5.3%

FO activity                                                                                             FO activity
Number of FOs                        2783       3689        2174         788       1082        889      Number of FOs                     1127        1484         928         320        444       278
Money raised                       $457.8bn    $734.3bn    $457.2bn    $119.8bn   $243.5bn   $209.4bn   Money raised                     $216.3bn    $317.7bn    $206.1bn    $54.9bn    $123.2bn   $73.0bn

                                  IPO and FO activity in EMEA                                                                          IPO and FO activity in Asia-Pacific
                                       2019       2020        2021      Q2 2019    Q2 2020   Q2 2021                                        2019        2020        2021     Q2 2019    Q2 2020 Q2 2021
IPO activity                                                                                            IPO activity
Number of IPOs                         129         167        236          47         20       145      Number of IPOs                       660        735         456        154        110        239
 % sponsor-backed                     14.7%       9.0%       14.0%       19.1%      0.0%      14.5%      % sponsor-backed                   1.8%        2.2%        3.7%       3.2%       0.9%      4.6%
Money raised                         $53.3bn     $28.1bn    $55.0bn     $14.5bn     $4.9bn    $27.5bn   Money raised                       $71.7bn    $113.1bn    $71.7bn     $16.0bn    $12.5bn   $40.2bn
 % sponsor-backed                     23.9%       33.4%      34.3%       44.1%      0.0%      34.8%      % sponsor-backed                   7.1%        7.5%        7.0%       6.6%       3.7%      9.6%
Advanced m etrics                                                                                       Advanced m etrics
Free float %                          38.1%       37.9%      39.2%       41.3%      28.8%     37.1%     Free float %                        26.6%      24.8%       25.8%      28.5%      23.3%      26.0%
Overallotment exercised (%)           25.8%       17.0%      15.7%       33.3%      25.0%     15.1%     Overallotment exercised (%)         18.0%      12.8%        6.0%      18.1%      10.9%      5.1%
% secondary shares                    34.3%       23.9%      27.2%       42.3%      33.4%     22.9%     % secondary shares                  10.8%      10.3%       12.0%      11.2%       2.9%      11.3%
FO activity                                                                                             FO activity
Number of FOs                          740         975        564         220        293       284      Number of FOs                        926        1245        691        251        348        331
Money raised                         $97.9bn    $164.7bn    $100.4bn    $29.2bn    $48.2bn    $54.5bn   Money raised                      $145.0bn    $254.2bn    $151.3bn    $36.2bn    $73.9bn   $82.0bn
Pw C | Global IPO Watch Q2 2021                                                                                                                                                                              23
Leading transactions 2021
Global
Top 10 largest IPOs 2021 Performance (% change)
Pricing date Issuer name Issuer country Sector Exchange Pricing Money raised 1-day 1-month Current
29-Jan-21 Kuaishou Technology China Technology Hong Kong Exchange-Main Board Top of range $6.2bn 160.9% 160.5% 147.8%
10-Mar-21 Coupang Inc South Korea Consumer Discretionary New York Stock Exchange-NYSE Above range $4.6bn 40.7% 31.0% 31.3%
29-Jun-21 DiDi Global Inc China Consumer Discretionary New York Stock Exchange-NYSE Top of range $4.4bn 1.0% N/A 10.9%
27-Jan-21 InPost SA Poland Industrials Amsterdam Top of range $3.9bn 15.1% 13.5% -5.5%
21-May-21 JD Logistics Inc China Industrials Hong Kong Exchange-Main Board In range $3.6bn 3.3% -21.3% 2.6%
7-May-21 China Three Gorges Renewables (Group) Co Ltd China Utilities Shanghai Stock Exchange N/A $3.5bn 44.2% 352.3% 124.5%
23-Apr-21 Allfunds Group plc Spain Financials Amsterdam In range $2.6bn 20.4% 151.3% 25.5%
10-Feb-21 Bumble Inc United States Technology NASDAQ-US Above range $2.5bn 63.5% 46.3% 48.8%
17-Mar-21 Vantage Towers AG Germany Telecommunications Frankfurt Stock Exchange-Prime Bottom of range $2.4bn 1.5% 2.7% 0.0%
2-Feb-21 AUTO1 Group SE Germany Consumer Discretionary Frankfurt Stock Exchange-Prime Top of range $2.2bn 39.5% 17.1% 27.6%
Top 10 largest FOs 2021
Performance (% change)
Pricing date Issuer name Issuer country Sector Exchange Deal type Money raised 1-day 1-month Current
7-Apr-21 Tencent Holdings Ltd China Technology Hong Kong Exchange-Main Board FO - Accelerated Bookbuild $14.7bn 4.2% 0.8% -6.9%
21-Apr-21 Cellnex Telecom SA Spain Telecommunications Madrid Stock Exchange FO - Rights Offer $8.4bn 30.2% 32.3% 49.4%
19-Apr-21 Meituan China Technology Hong Kong Exchange-Main Board FO - Top-Up Placement $6.6bn 7.2% -5.0% 4.8%
23-Mar-21 Tryg A/S Denmark Financials Copenhagen FO - Rights Offer $5.9bn 38.5% 39.5% 42.5%
13-Apr-21 Altimeter Growth Corp United States Financials NASDAQ-US FO - PIPE $4.0bn 53.3% 15.0% 14.0%
20-Jan-21 BYD Co Ltd China Consumer Discretionary Hong Kong Exchange-Main Board FO - Accelerated Bookbuild $3.9bn 10.4% 10.7% -21.1%
9-Jun-21 Renesas Electronics Corp Japan Technology Tokyo Stock Exchange FO - Fully Marketed $3.9bn 0.8% N/A 0.7%
17-Mar-21 Baidu Inc China Technology Hong Kong Exchange-Main Board FO - Fully Marketed $3.1bn 0.0% -17.5% -13.4%
8-Mar-21 Korean Air Lines South Korea Consumer Discretionary Korea Exchange-KOSPI FO - Rights Offer $2.9bn 41.9% 42.4% 41.6%
24-Mar-21 Siemens Healthineers AG Germany Health Care Frankfurt Stock Exchange-Prime FO - Accelerated Bookbuild $2.8bn 4.5% 10.7% 4.9%
Note: IPOs are classified as ‘In Range’ if the IPO is priced in the middle 50% of the price range. The top and bottom 25% are classified as ‘Top of Range’ and ‘Bottom of Range’. Source: Dealogic, Bloomberg as of 30 June 2021.
Pw C | Global IPO Watch Q2 2021 24Leading transactions 2021
Americas
Top 10 largest IPOs 2021 in the Americas
Performance (% change)
Pricing date Issuer name Issuer country Sector Exchange Pricing Money raised 1-day 1-month Current
10-Mar-21 Coupang Inc South Korea Consumer Discretionary New York Stock Exchange-NYSE Above range $4.6bn 40.7% 31.0% 31.3%
29-Jun-21 DiDi Global Inc China Consumer Discretionary New York Stock Exchange-NYSE Top of range $4.4bn 1.0% N/A 10.9%
10-Feb-21 Bumble Inc United States Technology NASDAQ-US Above range $2.5bn 63.5% 46.3% 48.8%
14-Jan-21 Playtika Holding Corp Israel Consumer Discretionary NASDAQ-US Above range $2.2bn 17.1% 25.2% -0.8%
26-Jan-21 Shoals Technologies Group Inc United States Energy NASDAQ-US Above range $2.2bn 23.9% 30.5% 40.3%
27-Jan-21 PIMCO Dynamic Income Opportunities Fund United States Financials New York Stock Exchange-NYSE N/A $2.0bn 76.1% 30.8% 11.0%
27-Jan-21 AppLovin Corp United States Technology NASDAQ-US In range $2.0bn -18.5% 17.7% -9.9%
28-Jan-21 Qualtrics International Inc United States Technology NASDAQ-US Above range $1.8bn 51.7% 26.7% 5.2%
23-Feb-21 Soaring Eagle Acquisition Corp United States Financials NASDAQ-US In range $1.7bn 8.8% 1.7% 1.7%
19-May-21 Oatly Group AB Sweden Consumer Staples NASDAQ-US Top of range $1.6bn 18.8% N/A 35.8%
Top 10 largest FOs 2021 in the Americas
Performance (% change)
Pricing date Issuer name Issuer country Sector Exchange Deal type Money raised 1-day 1-month Current
13-Apr-21 Altimeter Growth Corp United States Financials NASDAQ-US FO - PIPE $4.0bn 53.3% 15.0% 14.0%
22-Feb-21 Churchill Capital Corp IV United States Financials New York Stock Exchange-NYSE FO - PIPE $2.5bn 35.0% 39.0% 44.9%
5-May-21 American Tower Corp United States Financials New York Stock Exchange-NYSE FO - Accelerated Bookbuild $2.4bn -0.3% 8.4% 11.5%
29-Apr-21 Fiserv Inc United States Industrials NASDAQ-US FO - Bought Deal $2.4bn 1.5% -2.6% -7.6%
30-Jun-21 BR Distribuidora Brazil Energy BM&FBOVESPA-Novo Mercado FO - Fully Marketed $2.3bn 10.0% N/A 13.0%
26-Jan-21 Plug Power Inc United States Energy NASDAQ-US FO - Bought Deal $2.1bn -0.9% -25.6% -48.6%
7-Jan-21 Uber Technologies Inc United States Consumer Discretionary New York Stock Exchange-NYSE FO - Bought Deal $2.0bn -1.2% 8.7% 6.5%
4-Mar-21 VICI Properties Inc United States Financials New York Stock Exchange-NYSE FO - Accelerated Bookbuild $2.0bn -1.2% -0.6% -0.1%
12-Jan-21 Zoom Video Communications Inc United States Technology NASDAQ-US FO - Accelerated Bookbuild $2.0bn 7.2% 27.4% -4.7%
18-Feb-21 Twilio Inc United States Technology New York Stock Exchange-NYSE FO - Bought Deal $1.8bn 0.1% -17.2% -18.0%
Note: IPOs are classified as ‘In Range’ if the IPO is priced in the middle 50% of the price range. The top and bottom 25% are classified as ‘Top of Range’ and ‘Bottom of Range’. Source: Dealogic, Bloomberg as of 30 June 2021.
Pw C | Global IPO Watch Q2 2021 25Leading transactions 2021
EMEA
Top 10 largest IPOs 2021 in EMEA
Performance (% change)
Pricing date Issuer name Issuer country Sector Exchange Pricing Money raised 1-day 1-month Current
27-Jan-21 InPost SA Poland Industrials Amsterdam Top of range $3.9bn 15.1% 13.5% -5.5%
23-Apr-21 Allfunds Group plc Spain Financials Amsterdam In range $2.6bn 20.4% 151.3% 25.5%
17-Mar-21 Vantage Towers AG Germany Telecommunications Frankfurt Stock Exchange-Prime Bottom of range $2.4bn 1.5% 2.7% 0.0%
2-Feb-21 AUTO1 Group SE Germany Consumer Discretionary Frankfurt Stock Exchange-Prime Top of range $2.2bn 39.5% 17.1% 27.6%
31-Mar-21 Deliveroo plc United Kingdom Technology London Stock Exchange Bottom of range $2.1bn -26.3% -33.3% -27.7%
29-Jan-21 Dr Martens plc United Kingdom Consumer Discretionary London Stock Exchange N/A $2.0bn 21.6% 33.4% 23.0%
London Stock Exchange
5-Mar-21 Fix Price Group Ltd Russian Federation Consumer Discretionary Top of range $1.7bn 0.0% 0.1% 0.1%
Moscow Exchange
30-Jun-21 Acciona Energia SA Spain Utilities Madrid Stock Exchange Bottom of range $1.6bn 7.3% N/A 9.3%
13-May-21 Alphawave IP Group plc United Kingdom Technology London Stock Exchange N/A $1.2bn -9.8% 32.8% -12.8%
17-May-21 SUSE SA Germany Technology Frankfurt Stock Exchange-Prime Bottom of range $1.2bn 0.0% 13.2% 10.0%
Top 10 largest FOs 2021 in EMEA
Performance (% change)
Pricing date Issuer name Issuer country Sector Exchange Deal type Money raised 1-day 1-month Current
21-Apr-21 Cellnex Telecom SA Spain Telecommunications Madrid Stock Exchange FO - Rights Offer $8.4bn 30.2% 32.3% 49.4%
23-Mar-21 Tryg A/S Denmark Financials Copenhagen FO - Rights Offer $5.9bn 38.5% 39.5% 42.5%
24-Mar-21 Siemens Healthineers AG Germany Health Care Frankfurt Stock Exchange-Prime FO - Accelerated Bookbuild $2.8bn 4.5% 10.7% 4.9%
12-May-21 Euronext NV France Financials Paris FO - Rights Offer $2.2bn 40.2% 48.3% 52.3%
3-Mar-21 EDP Renovaveis SA Spain Utilities Lisbon FO - Accelerated Bookbuild $1.8bn -0.7% 10.2% 10.2%
26-May-21 Nordea Bank Abp Finland Financials Helsinki FO - Accelerated Bookbuild $1.7bn 2.9% 11.5% 11.1%
23-Apr-21 Piraeus Financial Holdings SA Greece Financials Athens Stock Exchange FO - Fully Marketed $1.7bn 124.9% 30.9% 25.9%
11-May-21 NatWest Group plc United Kingdom Financials London Stock Exchange FO - Accelerated Bookbuild $1.6bn 0.5% 7.0% 6.5%
6-Jan-21 Delivery Hero SE Germany Consumer Discretionary Frankfurt Stock Exchange-Prime FO - Accelerated Bookbuild $1.5bn 1.8% -0.2% -13.1%
4-May-21 Delivery Hero SE Germany Consumer Discretionary Frankfurt Stock Exchange-Prime FO - Accelerated Bookbuild $1.5bn -0.5% -9.7% -4.7%
Note: IPOs are classified as ‘In Range’ if the IPO is priced in the middle 50% of the price range. The top and bottom 25% are classified as ‘Top of Range’ and ‘Bottom of Range’. Source: Dealogic, Bloomberg as of 30 June 2021.
Pw C | Global IPO Watch Q2 2021 26Leading transactions 2021
Asia-Pacific
Top 10 largest IPOs 2021 in Asia-Pacific
Performance (% change)
Pricing date Issuer name Issuer country Sector Exchange Pricing Money raised 1-day 1-month Current
29-Jan-21 Kuaishou Technology China Technology Hong Kong Exchange-Main Board Top of range $6.2bn 160.9% 160.5% 147.8%
21-May-21 JD Logistics Inc China Industrials Hong Kong Exchange-Main Board In range $3.6bn 3.3% -21.3% 2.6%
7-May-21 China Three Gorges Renewables (Group) Co Ltd China Utilities Shanghai Stock Exchange N/A $3.5bn 44.2% 352.3% 124.5%
26-Apr-21 SK IE Technology Co Ltd South Korea Technology Korea Exchange-KOSPI Top of range $2.0bn 47.1% 71.0% 77.1%
2-Feb-21 PTT Oil & Retail Business pcl Thailand Energy Stock Exchange of Thailand Top of range $1.6bn 62.5% 69.4% 76.4%
8-Mar-21 SK Biosciences Co Ltd South Korea Health Care Korea Exchange-KOSDAQ Top of range $1.3bn 160.0% 103.1% 140.8%
Sci-Tech Innovation Board (STAR
17-May-21 Everdisplay Optronics (Shanghai) Co Ltd China Technology N/A $1.3bn 58.5% 14.1% 41.5%
Market)
26-Apr-21 Ngern Tid Lor pcl Thailand Financials Stock Exchange of Thailand Top of range $1.2bn 25.3% 35.7% 11.0%
14-May-21 Monde Nissin Corp Philippines Consumer Staples Philippine Stock Exchange N/A $1.1bn -0.2% -4.3% 25.9%
31-Mar-21 Linklogis Inc China Technology Hong Kong Exchange-Main Board In range $1.0bn 9.9% 25.1% -28.8%
Top 10 largest FOs 2021 in Asia-Pacific Performance (% change)
Money
Pricing date Issuer name Issuer country Sector Exchange Deal type raised 1-day 1-month Current
7-Apr-21 Tencent Holdings Ltd China Technology Hong Kong Exchange-Main Board FO - Accelerated Bookbuild $14.7bn 4.2% 0.8% -6.9%
19-Apr-21 Meituan China Technology Hong Kong Exchange-Main Board FO - Top-Up Placement $6.6bn 7.2% -5.0% 4.8%
20-Jan-21 BYD Co Ltd China Consumer Discretionary Hong Kong Exchange-Main Board FO - Accelerated Bookbuild $3.9bn 10.4% 10.7% -21.1%
9-Jun-21 Renesas Electronics Corp Japan Technology Tokyo Stock Exchange FO - Fully Marketed $3.9bn 0.8% N/A 0.7%
17-Mar-21 Baidu Inc China Technology Hong Kong Exchange-Main Board FO - Fully Marketed $3.1bn 0.0% -17.5% -13.4%
8-Mar-21 Korean Air Lines South Korea Consumer Discretionary Korea Exchange-KOSPI FO - Rights Offer $2.9bn 41.9% 42.4% 41.6%
23-Mar-21 Bilibili Inc China Technology Hong Kong Exchange-Main Board FO - Fully Marketed $2.6bn -1.0% 16.7% 7.7%
8-Jan-21 Lens Technology Co Ltd China Industrials Shenzhen Stock Exchange-ChiNext FO - Cash Placing $2.3bn 45.4% 29.1% 4.2%
27-May-21 Weichai Power Co Ltd China Industrials Shenzhen Stock Exchange FO - Cash Placing $2.0bn 11.0% 6.6% 4.8%
12-May-21 China Mengniu Dairy Co Ltd China Consumer Staples Hong Kong Exchange-Main Board FO - Accelerated Bookbuild $2.0bn 8.3% 13.6% 15.5%
Note: IPOs are classified as ‘In Range’ if the IPO is priced in the middle 50% of the price range. The top and bottom 25% are classified as ‘Top of Range’ and ‘Bottom of Range’. Source: Dealogic, Bloomberg as of 30 June 2021.
Pw C | Global IPO Watch Q2 2021 27IPO and FO activity per sector In Q1 2021, the FTSE Russell Industry Classification Benchmark (ICB) was revised:
- the “Oil and gas” sector was renamed to “Energy”; and
Global - the “Consumer Goods” and “Consumer Services” sectors were replaced with “Consumer Discretionary”
and “Consumer Staples”. These new consumer categories are not direct replacements, therefore we are
unable to show historical data on a like-for-like basis using the new ICB classifications.
Money raised and number of IPOs and FOs per sector 2019-2021
Basic Materials Consumer Consumer Financials Health Care Industrials Energy Technology Telecommunication Utilities
IPO money raised & # of deals
Discretionary Staples
FO money raised & # of deals
Pw C | Global IPO Watch Q2 2021 28IPO and FO activity per sector
Americas
Money raised and number of IPOs and FOs per sector 2019 – 2021
Consumer Consumer Health Care Industrials Energy Technology
Basic Materials Financials Telecommunication Utilities
Discretionary Staples
IPO m oney raised & # of deals
FO m oney raised & # of deals
Pw C | Global IPO Watch Q2 2021 29IPO and FO activity per sector
EMEA
Money raised and number of IPOs and FOs per sector 2019 – 2021
Consumer Consumer Financials Health Care Industrials Energy Technology
Basic Materials Telecommunication Utilities
Discretionary Staples
IPO money raised & # of deals
FO money raised & # of deals
Pw C | Global IPO Watch Q2 2021 30IPO and FO activity per sector
Asia-Pacific
Money raised and number of IPOs and FOs per sector 2019 – 2021
Consumer Consumer Financials Health Care Industrials Energy Technology
Basic Materials Telecommunication Utilities
IPO m oney raised & # of deals
Discretionary Staples
FO m oney raised & # of deals
Pw C | Global IPO Watch Q2 2021 31Leading initial secondary listings 2021
Global
Top 10 largest initial secondary listings 2021
# Pricing date Issuer nam e Issuer Country Sector Exchange Other Exchange Money raised $bn
1 17-Mar-21 Baidu Inc China Technology Hong Kong Exchange-Main Board NASDAQ 3.1
2 23-Mar-21 Bilibili Inc China Technology Hong Kong Exchange-Main Board NASDAQ 2.6
3 30-Jun-21 XPeng Inc China Consumer Discretionary Hong Kong Exchange-Main Board NYSE 2.1
4 13-Apr-21 Trip.com Group Ltd China Consumer Discretionary Hong Kong Exchange-Main Board NASDAQ 1.3
5 19-Feb-21 JOINN Laboratories (China) Co Ltd China Health Care Hong Kong Exchange-Main Board Shanghai Stock Exchange 0.8
6 09-Mar-21 Autohome Inc China Technology Hong Kong Exchange-Main Board NYSE 0.7
7 23-Jun-21 HUTCHMED (China) Ltd Hong Kong (China) Health Care Hong Kong Exchange-Main Board NASDAQ 0.6
8 28-Jun-21 CIMC Vehicles (Group) Co Ltd China Industrials Shenzhen Stock Exchange-ChiNext Hong Kong Exchange 0.3
9 24-Feb-21 Score Media & Gaming Inc Canada Technology NASDAQ-US TSE 0.2
10 17-Jun-21 Tremor International Ltd Israel Consumer Discretionary NASDAQ-US LSE - AIM 0.1
Note: Initial secondary offerings refer to existing listed companies subsequently offering shares on a different exchange.
Pw C | Global IPO Watch Q2 2021 32You can also read