Market and Trade Update - East Africa - WFP
←
→
Page content transcription
If your browser does not render page correctly, please read the page content below
DJIBOUTI
Food Security and Nutrition Outcome Monitoring
January 2020
 WFP Nairobi Regional Bureau                                           Released in June 2020

         East Africa
         Market and Trade Update
         Market and Trade Update
            Joint Supply Chain-VAM | Food Security Analysis
                    WFP Regional Bureau for East Africa | June 2020

          Highlights

          •   International maize and wheat prices declined further in May 2020 due to
              adequate global supplies. Global rice prices however increased over the same
              period, impacted by export restrictions from major source countries.
          •   Staple food prices generally followed normal seasonal trends between
              January and March in markets across the region. However, COVID-19 related
              measures and movement restrictions led to supply and demand disruptions.
              This resulted in sharp price increases from March through May in South
              Sudan and Somalia, prices also increased in Ethiopia, Burundi and Djibouti,
              but decreased in Kenya, Uganda, and Rwanda since March.
          •   Livestock conditions were good due to favourable rangeland conditions and
              prices remained stable at elevated levels or increased further in many
              pastoral markets. However, there were supply interruptions triggered by
              outbreak of COVID-19 and reduced demand for meat following the closure
              of livestock markets, hotels and restaurants, which led to decrease in livestock
              prices notably in parts of Kenya and Karamoja Region of Uganda.

                                                                                          1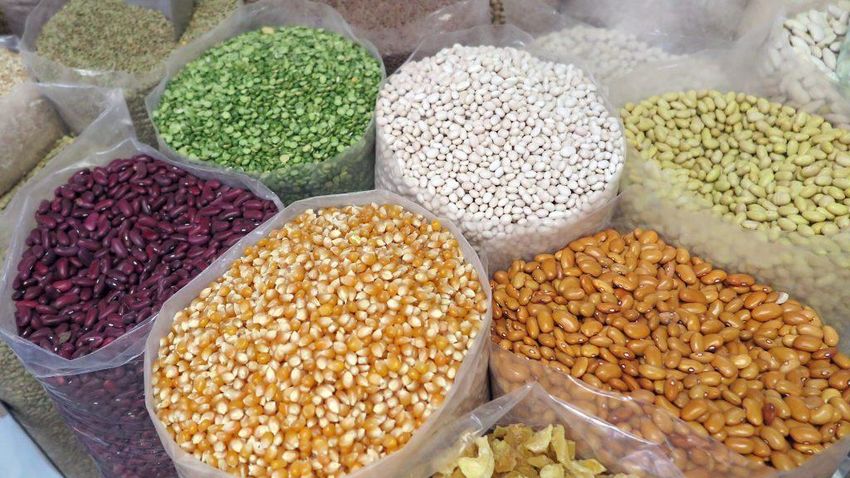
Global Cereal Market
Rice grain prices increased for five straight
months starting January 2020, despite Fig. 1: Thailand (Bangkok), Rice (Thai A1
generally comfortable global grain supplies. Super) Prices (US$/ ton)
The increase was even sharper in May due to
the effects of the export restrictions from key 500
$5…
export origins as well as COVID-19 related
freight and supply challenges.
400
On the other hand, international prices of
wheat dropped in May after temporary rise in 300
April which was caused by strong global
demand (Fig. 2). 200
Global maize prices have been on a sharp 100
decline through May 2020. Lower maize
quotations were supported by large export
0
availabilities and new crop harvest in South
Jul
Jul
Jul
Jan
Jan
Jan
Jan
May
May
May
May
Mar
Mar
Mar
Mar
Nov
Nov
Nov
Sep
Sep
Sep
America.
2017 2018 2019 2020
Average of 5 Year average. Monthly Average.
400 Fig. 2: International Maize and Wheat Prices
350
300
250
200
150
100
Jan-10
May-10
May-11
May-12
May-13
May-14
May-15
May-16
May-17
May-18
May-19
May-20
Sep-10
Jan-11
Sep-11
Jan-12
Sep-12
Jan-13
Sep-13
Jan-14
Sep-14
Jan-15
Sep-15
Jan-16
Sep-16
Jan-17
Sep-17
Jan-18
Sep-18
Jan-19
Sep-19
Jan-20
US (Gulf), Maize (US No. 2, Yellow) US (Gulf), Wheat (US No. 2, Hard Red Winter)
2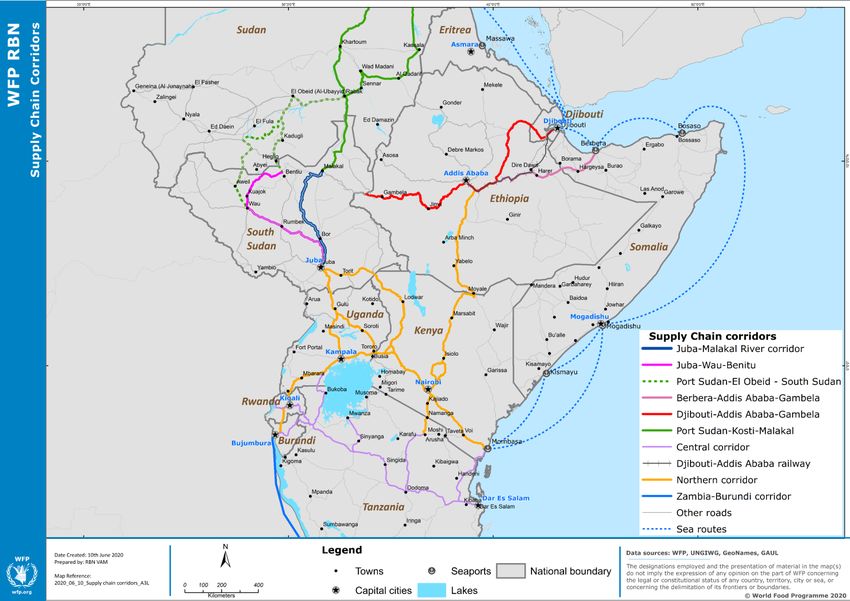
Border Situation

                                                    Government of Rwanda requires fumigation
 Air transport                                      and disinfection of all cargo trucks originating
                                                    from Burundi, DRC and Uganda and relay of
                                                    drivers. This is in addition to requiring swift
 Air transport has been disrupted significantly
                                                    and immediate offloading of cargo and
 following closure of airports and suspension
                                                    payment of up to USD 500 per vehicle for
 of    both    domestic      and    international
                                                    escort services for cargo that cannot be
 commercial passenger flights. In Ethiopia,
                                                    offloaded at the border (WFP is exempted
 passenger flights are still operational though
                                                    from this fee). Restrictions on drivers from
 at reduced number and to few destinations.
                                                    Uganda to Rwanda are causing delays at
 Domestic flights are also suspended in all
                                                    Mirama Hills Border Point.
 countries except in South Sudan where they
 resumed recently subject to quarantine and
                                                    Kenya-Uganda: Numerous roadblocks that
 social distancing conditions. Cargo transport
                                                    have been erected between Mombasa and
 is ongoing although at reduced capacity
                                                    Nairobi in addition to border testing
                                                    challenges at Malaba have caused some
                                                    limited delays in commercial cargo movement
                                                    to land locked countries. Operations at Busia
 Land Borders & inland                              Border are normal with no delays.
 cargo transport
                                                    Kenya and Tanzania agreed to reopen their
                                                    borders on 22th May after a tense week
The countries in the region agreed in May to a      marked by a simmering trade dispute and
harmonised cross-border testing of truck            border closure occasioned by the Covid-19
drivers- requiring them to obtain mandatory         pandemic testing procedures. Again on 4th
COVID-19 free certificate 24 hours before their     June, Tanzania closed the borders over claims
departure from the port of origin- which is         that their truck drivers with certified Covid-19
then recognized throughout the region within        test certificates were forced to retest before
14 days of the test. However, truck drivers         crossing the border.
blocked access on both sides of the Malaba
Border during the fourth week of May,               At Kenya -Ethiopia Moyale Border, no
protesting non-recognition of their valid           human passage is allowed, including that of
COVID-19 certificates by the Uganda                 informal traders. The border is open to trucks;
authorities. This led to massive snarl-ups          however, drivers must quarantine for 14-days
stretching up to 80 kilometres. Even after the      as soon as they cross the border. There are no
clearance of the backlog of trucks, there was       restrictions on cargo movements from
still a long queue on the Kenyan side into          Djibouti to Ethiopia operating close to
Malaba for sometime. The backlog of trucks          normality, with a continuous and smooth
has now been cleared for those drivers              traffic.
presenting a valid COVID-19 certificate.
                                                    From Ethiopia, road and river access to South
Following challenges at Rusomo Border,              Sudan is allowed but with strict control for
Tanzania and Rwanda agreed in May on the            truck drivers. The border crossing between
transhipment of containerised cargo and             Sudan and Ethiopia are fully closed except
escort of trucks with foreign drivers carrying      for humanitarian cargo from Gadarif to
sensitive goods like petrol and perishables to      Galabat, subject to clearance & approval from
proceed to final destination without the need       Sudanese & Ethiopian Governments.
to swap drivers at borders.
                                                                                                3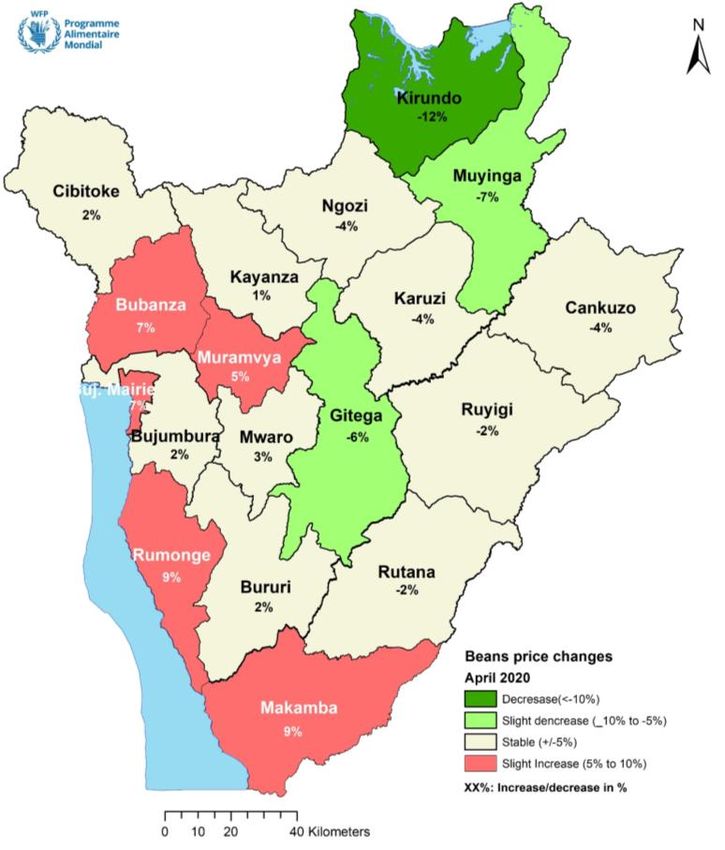
After initial delays caused by testing procedures at the Elegu/Nimule South Sudan-Uganda
borders, the situation has since improved with both sides reducing the time it takes for trucks to
cross the border to within 1 or 2 days. The Ethiopia-Somalia borders on the Somaliland front are
also closed except for humanitarian cargo and essential food and medicines. Cross-Border trade
between Somalia and Ethiopia at Hiran is uninterrupted while the border at Jubaland and
Ethiopia is closed but they have locally agreed for two days per week (Saturday and Sunday) to
allow goods to cross from either side. Kenya/Somalia border is officially closed with the exception
of cargo trucks on a condition that all drivers must be screened for COVID-19. Inside Somalia,
transport services have resumed throughout the country and supply corridors are operating
normally particularly in the North. The Sudan-South Sudan border is only partially open at Joda
and Renk.

Port Operations

Throughout the region, ports are operational but with some delays due to new stringent
directives and reduced working hours at the ports. Mombasa Port is fully operational with
container ships arriving without major delays and cargo being cleared within the four-day free
window. There have been minor delays in cargo clearances due to measures put in place in
minimising physical interaction and with enhanced online documentation. Djibouti Port operations
are proceeding largely as normal with some delays due to extended lockdown that has reduced
operational hours for shipping Lines. Mogadishu, Bossaso, Berbera, Port Sudan, Dar es Salaam
Ports remain operational at normal levels

                                                                                              4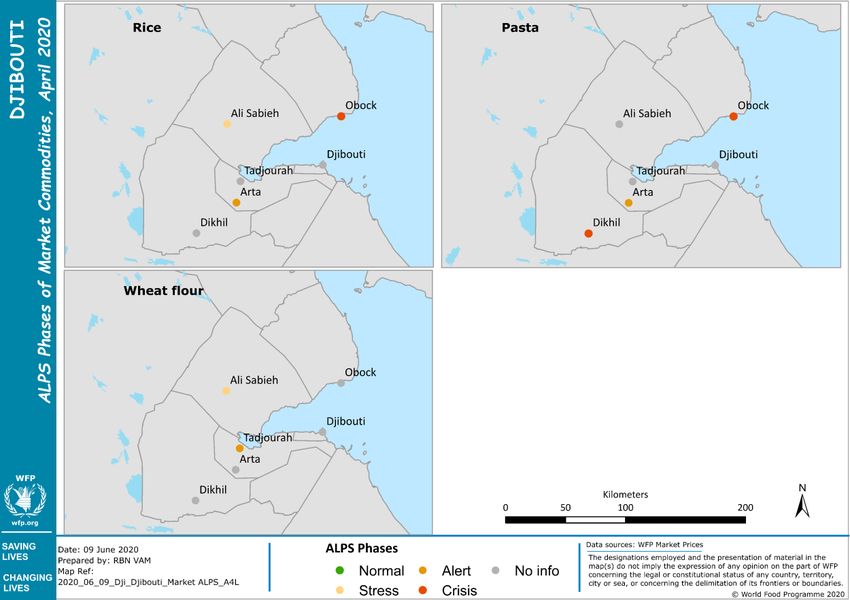
Supply Chain Trade Corridor Functionality

There are 11 main trade corridors that WFP is using to deliver food to multiple in-country destinations in the
region. Status of major corridors is as follows.
❖    Northern Corridor:
       ▪    Mombasa to: Uganda, Rwanda, Burundi, DRC- fully functional with limited delays at border crossings
            because of testing of divers
       ▪    Mombasa to: Uganda and South Sudan through Nimule-fully functional
       ▪    Mombasa to Juba South Sudan through Nadapal- partly functional
       ▪    Mombasa to Ethiopia through Moyale- partially functional
❖    Central Corridor and Lake Tanganyaki Corridor:
       ▪    Dar es Salaam Tanzania to Burundi, Rwanda and Uganda- fully functional
       ▪    Dar-es Salaam Burundi through rail and Lake Tanganyika- fully functional
       ▪    Zambia-Burundi through Lake Tanganyika- fully functional although with quarantine restrictions at
            Bujumbura Port
❖    Berbera-Addis Ababa-Gambela corridor- partially functional
❖    Djibouti-Addis Ababa-Gambela corridor- fully functional
❖    Southern Somalia Trade Corridor- most roads closed or inaccessible although ports are operational. Most
     roads in northern regions are functional
❖    Sudan-South Sudan Corridor- partially functional-the border is open for humanitarian cargo, after obtaining
     clearance & approval from Authorities. Road convoys are also experiencing challenges.
❖    Sudan-South Sudan Corridor- partially functional- From Ethiopia, road and river access to South Sudan is
     allowed only for essential goods.                                                                   5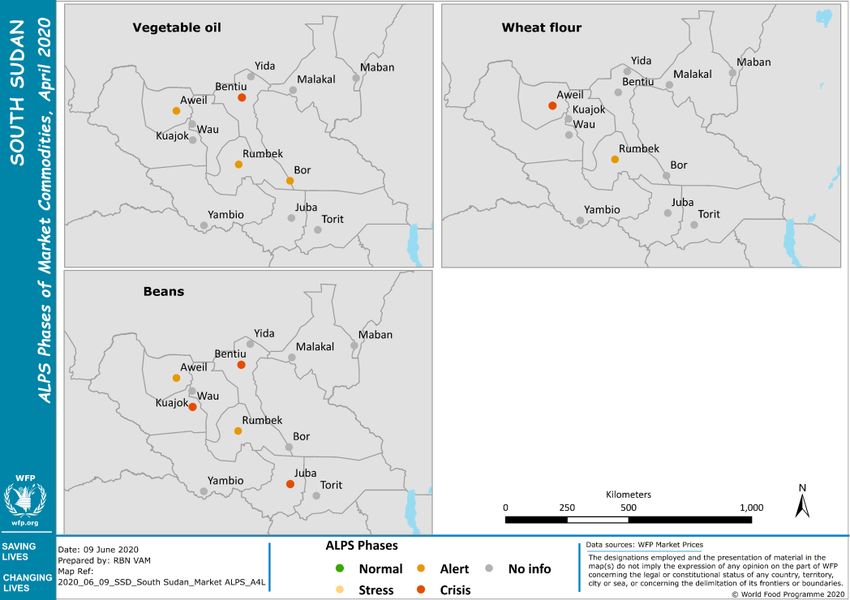
Regional Cross Border Trade

COVID-19 related disruptions and delays at the
Kenya-Tanzania border led to reduced cross-border
trade volumes of both maize and beans from Tanzania
to Kenya in April and May 2020, compared to the
same period last year and the five-year average. Beans
imported from Ethiopia into Kenya also dropped
drastically during the same period.

Despite some reported challenges initially at the
Malaba and Nimule Borders that increased delivery
lead-times, overall, maize, sorghum and beans
imports from Uganda into Kenya and South Sudan in
April-may 2020 was slightly higher than the same
period in 2019. This was after an initial dip in cross-
border trade volumes in March following COVID-19
related restrictions.

                                                                                       Sorghum Exports: from Uganda
                                                                                            to South Sudan (MT)

                                                                                                                                  32,422

                                                                                                                     20,334

                                                                                           14,957

                                                                                       3,948          4,958

                                                                                       2017           2018           2019         2020

                                                                                        April-May             5-YA (April May-2015-2019)

            Beans Exports to Kenya (April-                                             Beans exports: Uganda to South
                     May- MT)                                                              Sudan (April-May) -MT
    25,000                                                                   15,000
    20,000
    15,000                                                                   10,000
    10,000
     5,000                                                                     5,000
        -
                                                                                   -
                                                    2017
                2017
                2018
                2019
                2020

                                  2017
                                  2018
                                  2019
                                  2020

                                                    2018
                                                    2019
                                                    2020

                                                                                               2017        2018          2019       2020
                    Ethiopia          Tanzania         Uganda                                                   Uganda

    Source: FEWS NET/WFP/EAGC. This data is collected by a network of cross border monitors based at 38 selected border points.
                                                                                                                                     6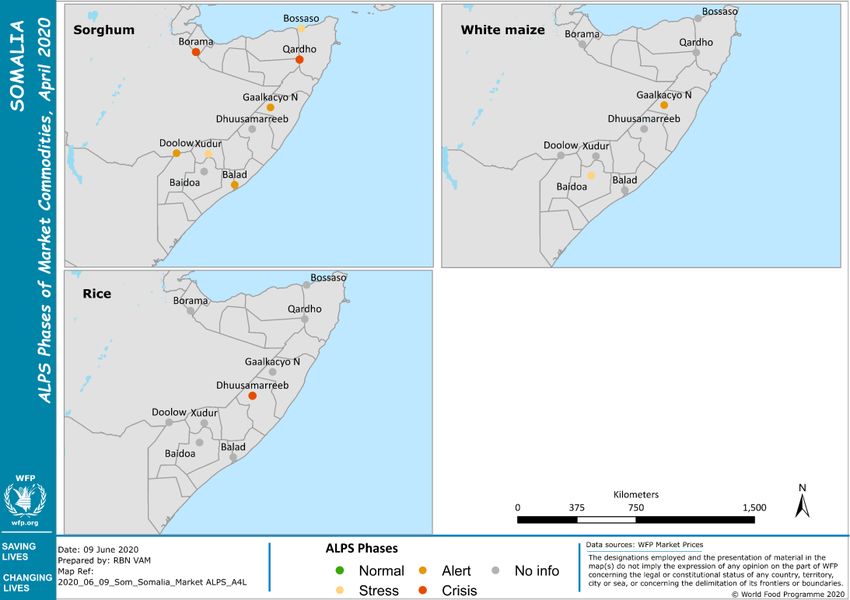
WFP Procurement: Origins and Prices

Tanzania, Uganda, South Africa and Mexico are the main supply origins of white maize grains
imported by WFP for humanitarian assistance in the region.
In 2020, WFP imported more maize from Uganda and South Africa where the aggregate cost of
imports were relatively lower than from Tanzania, the traditional origin of white maize.
The maize harvest season has begun in the East Africa Region, and as a result wholesale maize
prices have started decreasing seasonally in many countries including Uganda and Tanzania.
Cereal prices are expected to decrease further in July/ August at the peak of the harvests. Maize
crop production prospects for the 2020 in the region is positive, presenting good procurement
opportunities regionally from Tanzania and Uganda.
Latest South Africa crop forecasts for 2019/20 commercial maize harvests point to a 30% higher
production than last year, making the country a competitive maize sourcing origin for the WFP.
For beans, the harvest in Rwanda and Uganda have started resulting in reduced prices, an
incentive for WFP local procurement.
Since March when the first cases of COVID-19 pandemic were reported in the region, most
countries have seen their currencies lose value against the USD, but these loses have been
balanced by lower fuel prices, resulting in stable prices of imported food.

                                       WFP Procurement prices

                                                              Beans Prices (US$/MT)
                                                                                      874

                                                                       746

                                                       531

                                                     UGANDA          BURUNDI     TANZANIA

                                                        Jan            Mar            Apr

                                                                                                7
Maize Production and Prices in Source Markets
South Africa: in the last three months, maize prices South Africa: Wholesale Maize
have been attractive as a result of increased Prices (US$/ton)
availability, exchange rates favoring exports, and 220
reduced shipping rates making the country a
competitive source market. A bumper crop harvest 190
anticipated in the 2019/20 marketing year will help 160
keep maize prices stable despite weakening of the
130
South African rand.
100
Tanzania: The long rains maize harvests that started
Mar
May
Mar
May
Mar
May
Sep
Nov
Jan
Jan
Sep
Nov
Jan
Jul
Jul
in May were projected to be favorable because of
above average November 2019-April 2020 rains. 2018 2019 2020
The production prospects are also favourable for the
2020 “masika” season crops, planted in March in
northern, northeastern and coastal bi-modal rainfall Wholesale Maize Prices US$/ton,
areas and for harvest from July. Due to increased Tanzania
availability in local markets and reduced cross- 700
border trade volumes to Kenya following COVID-19 600
trade disruptions, maize prices declined in the last 500
three months. Prices of maize declined by 400
36-44 percent between January and May 2020 in 300
the main markets of Dar es Salaam, Iringa and 200
Arusha. However, prices in May remained higher 100
Sep
Nov
Sep
Nov
Sep
Nov
Jul
Jul
Jul
Jan
Jan
Jan
Jan
Mar
May
Mar
May
Mar
May
Mar
May
than in 2019, driven by sustained demand from
2017 2018 2019 2020
Kenya, Rwanda and Southern African traders.
Iringa Dar es Salaam Arusha
Uganda: The new maize crop harvests in bi-modal rainfall areas covering most of the country that
are projected to be favourable, have started reaching the markets. Prices of maize and beans have
started declining seasonally, supported by increased commercialization of the previous season’s
crops, making the country an attractive sourcing market for WFP food procurement.
Mexico: According to FAO GIEWS, production of the 2019 summer main season maize crops that
were concluded in February were below average due to lowest planted area in more than a decade.
The planted area of the 2020 minor maize crop contracted due to the year-on-year decline in
irrigation water availability raising fears of lower output in the maize crop harvests that commenced
from May and higher import demand of yellow maize by the feed industry. Prices of white maize
remained stable since the last quarter of 2019, mainly reflecting the improved market availabilities
from the 2019 main season harvest.
Zambia: the overall 2020 maize production is expected at an above-average level of 3 million
tonnes. Even though the increased availability of new harvest will likely exert downward pressure on
maize prices, the sustained increase in the last 12 months with doubling of prices in one year, is
likely to keep the current prices higher than normal, making the country less attractive for WFP
sourcing of maize grain.
8Country level overview of markets and prices
Burundi
Burundi relies heavily on food imports, particularly maize and rice from Tanzania to meet its
consumption needs especially during this time of the year when the first lean season peaks and
household food stocks are depleted. However, the country has low import capacity since traders
are facing acute shortage of dollars due to currency depreciation, and high cost of transportation.
The COVID-19 pandemic has disrupted regional trade and reduced food imports into the country
during the first quarter of the year resulting in low market food availability and increased food
prices from March although largely within seasonal levels.
According to the Burundi market
monitoring by WFP (May, 2020):
❖ Highest food prices were in the west/
north-western provinces of the country
(including Bujumbura), which are
traditionally deficit production areas but
also have the highest concentration of
the population and demand for food.
❖ Onion and bean prices increased
significantly above the five-year average
(up to 60% and more than 35%
respectively).
❖ Widespread year-on-year food price
increases were observed in April.
❖ Beans and imported food prices also
increased in April month-on-month,
which is linked to below normal
production in the previous season as
extreme moisture during September-
December 2019 led to massive crop
losses. ❖ Maize prices on the other hand decreased
from December through March 2020,
supported by ample crop production. Since
Wholesale Maize Prices (US$/ton), the start of the COVID-19 restriction
Bujumbura measures in March, maize price increased
slightly, reflecting the combined effect of
600
reduced supplies from Tanzania and effect of
the lean season.
❖ WFP’s Alert for Price Spikes (ALPS) indicator
400
monitors the extent to which market food
prices experience unusually high food prices.
In April 2020, staple food prices in most of
200 the monitored markets indicated higher than
normal price levels (‘alert’ and ‘crisis’ ALPS
phases). Muraviya, Kinama, Kayangozi, and
0 Gitobe were in ‘crisis’.
Jan Feb Mar Apr May Jun Jul Aug Sep Oct Nov Dec ❖ The high and increased prices of staples are
expected to continue until the next harvests
Five-Year Average 2020 2019 (2020B season) starting mid-June/July.
9Djibouti
Djibouti meets up to 90 percent of its food needs through imports, making markets the single most
important source of food for both rural and urban residents.
Given this high dependence on markets, households are vulnerable to price and income shocks
particularly now that COVID-19 pandemic led to increased food prices and decimated casual labour
and petty trade opportunities amongst the majority of urban residents. This is particularly so given
the country has the highest urbanization rate in the region (80%) with about 70% of the population
living in Djibouti City and its suburbs.
Due to low purchasing power and limited access to own production in rural areas, consumption of
nutrition rich food items among rural poor households is low.
Prices of beans and red sorghum increased 350
Staple food prices, Djibouti
significantly (60-100%) between March and April
2020 in Djibouti. The increase is attributable to 300
increased demand due to panic buying following
implementation of COVID-19 containment 250
measures. The highest price increases were
recorded in Ali Sabieh and Tadjourah (red 200
sorghum) and in Obock (imported rice-9%). The
current prices have reached record high levels 150
since 2015.
A household survey conducted in January 2020 100 Oct
Oct
Oct
Oct
Oct
Oct
Oct
Jan
Jan
Jan
Jan
Jan
Jan
Jan
Jan
Apr
Jul
Apr
Jul
Apr
Jul
Apr
Jul
Apr
Jul
Apr
Jul
Apr
Jul
Apr
showed that majority of households are not able 2013 2014 2015 2016 2017 2018 2019 2020
to afford nutritious food; this is likely to have Beans (white) Rice (imported)
gone up since March given COVID-19 related Sorghum (red)
income and price shocks. The country with a
population of around 1 million has the highest In April, rice, wheat flour and pasta prices
COVID-19 cases in the region as well as the indicated higher than normal levels in the key
largest informal sector employment. cities monitored.
10Ethiopia
Despite having a domestic marketable
surplus for cereals, food prices are very
high in Ethiopia. The country is faced
Teff Prices in Addis Ababa (ETB/kg) with persistent high inflation linked to
the macro-economic challenges that
40 have been aggravated by the COVID-19
35 pandemic. These together with low
30 import capacity and high input and fuel
25 prices are having an impact on food
20
prices.
15
10 According to the Ethiopia Market Watch
5 (May, 2020):
0 ❖ The April year-to-year inflation
Jan Feb Mar Apr May Jun Jul Aug Sep Oct Nov Dec reached unprecedented levels of
22.9%, the highest since 2012;
Average (2015-2019) 2019 2020 ❖ The prices of staple cereal and pulses
were at elevated levels throughout the
country, having sustained rising
trends in the last 12 months despite
Wheat prices in Addis Ababa the recent Meher harvests and
25.0 Government price controls;
❖ Supply shortages and price increase of
20.0 key staples (such as maize and
sorghum) experienced in March as a
15.0 result of travel restrictions and panic
buying in response to the onset of
10.0 Covid-19 appeared to stabilize in April
in most of the monitored markets.
5.0 However, scarcity of teff and wheat
was reported in many monitored
0.0 markets;
Jan Feb Mar Apr May Jun Jul Aug Sep Oct Nov Dec ❖ Fruits and vegetable prices were
stable during the reporting period
Average (2015-20219) 2019 2020 with concurrent reduction in supply
and consumption of vegetables in
Addis Ababa;
❖ The ongoing lean season, COVID-19
related restrictions, and macro-
economic problems will likely sustain
rising cereal prices and keep them
above the seasonal levels until the
next harvests in September
11Kenya
According to the Ministry of Agriculture,
Livestock and Rural Development, Kenya’s
Food Balance Sheet is healthy with
sufficient stocks of key staples that will
sustain consumption needs through July
2020.
Wholesale maize prices decreased between
January-March 2020 in the key supply
market of Eldoret as well as in the net
consumption city of Nairobi.
However, localized price increases were
observed in April in remote markets as
COVID-19 restrictive measures and intense
rains disrupted food supply chains. However,
prices have since stabilized following
cessation of rains and start of green
harvests in bimodal areas. Nonetheless,
current prices remain above the five-year
average levels.
Harvests in bimodal areas are projected to
be above average, likely resulting in stable
or reduced prices despite weakening of the
Kenya Shilling. Since the declaration of the
first case of COVID-19 in the country on 18th
Fuel Prices (KES/ Litre) March to date, the Kenya Shilling has
120
115
depreciated by nearly 7%, losing 7 units to
110 the US$ in response to reduced foreign
105 exchange earnings from agricultural exports,
100 remittances and tourism sectors.
95
90 The depreciation of the Kenya Shillings is
likely to result in increase in price of
Feb
Apr
Aug
Feb
Apr
Aug
Feb
Apr
Oct
Oct
Nov
Nov
Jun
Jun
Jan
Jul
Sept
Dec
Mar
Jan
Jul
Sept
Dec
May
Mar
Jan
May
Mar
2018 2019 2020 imported food and farm inputs, partially
offset by lower fuel costs. From February
Fuel (diesel) Fuel (petrol-gasoline)
through May, petrol and diesel prices
dropped significantly, as a result of falling
international crude oil prices.
The headline inflation rate has steadily
Year-on-Year Inflation Trends
declined since January 2020, in line with
8
reduced food prices following December
7
crop harvest in unimodal areas as well as
6
reduced fuel prices.
5
4 Staple food prices are expected to decrease
3 seasonally from June.
2
The Government maize import window has
1
been extended through July to allow millers
0
to import maize. This will likely help stabilize
J F M A M J J A S O N D
food prices.
2014-2018 Avg. 2019 2020
12Rwanda
Rwanda being a net food importer, has traditionally relied on imports of staple maize from
Uganda to cover the gap from its domestic food production. However following a trade dispute
with Uganda which culminated in intermittent border closure at Gatuna over the last year, the
growth of rice and maize imports from Tanzania have progressively compensated for reduced
trade flows from Uganda.
Wholesale prices of locally produced Whole sale prices in Kigali (RWAF/
maize and beans decreased between 650,000 ton)
December and March 2020 in Kigali,
caused by increased supplies from
favourable 2020 A harvest but also by 450,000
reduced demand from rural traders and
institutional buyers following nation- 250,000
wide curfew and closure of schools linked
COVID-19 pandemic.
50,000
The start of the 2020B season harvests
Jul
Jul
Jul
Jan
Jan
Jan
Jan
May
May
May
May
Mar
Nov
Mar
Nov
Mar
Nov
Mar
Sep
Sep
Sep
from June will likely lead to downward 2017 2018 2019 2020
prices for beans and cereals
Maize Beans
Retail prices of beans and cassava in
rural areas increased sharply between
March and April 2020, linked to
bottlenecks that reduced market
functionality and commodity flows from
Kigali and other key supply markets Retail prices in Rural areas (RWAF/kg)
following lockdown and travel
650
restrictions, police checkpoints and the
nationwide curfew. April also coincided 550
with the lean season, reduced
household food stocks and increased 450
prices of staples.
350
In April, ALPS showed the most rural
markets were either on alert of crisis 250
phases, specifically for beans, cassava
Feb
Feb
Feb
Apr
Aug
Sep
Oct
Nov
Apr
Aug
Sep
Oct
Nov
Apr
Jan
Dec
Mar
Jun
Jul
Dec
Jan
Jan
May
Mar
Jun
Jul
May
Mar
flour and potatoes particularly in the 2018 2019 2020
South of the country. Beans (dry) Cassava flour
In May, retail prices in rural areas went
down following partial lifting of curfew and
other COVID-19 measures and the start of
season B 2020 green harvest.
13Somalia
Somalia relies heavily on food imports particularly rice, wheat floor and sugar from Saudi Arabia and
the Gulf Countries. Seasonal production of maize and sorghum in southern Somalia is an important
source of cereals for the country. Pastoralists mainly located in Central and Northern Somalia rely on
consumption of milk and sale of own stock to buy sorghum and other foods in the market.
Maize Grain Prices (SoShs/kg)
Prices of locally produced cereals showed COVID-19
pandemic case
atypical price increase between March detected
and May 2020 in the markets of Southern 13000
Somalia- caused by flood related trade
disruptions and panic buying related to
10000
COVID-19 measures. Increased
consumption demand during Ramadan
and Hajj festivities also contributed to the
7000
price increases. The current price levels in
the southern markets are at the highest
since 2018, and nearing the 2017 hyper-
4000
inflation levels.
Jan
Jul
Jan
Jul
Jan
Jul
Jan
Mar
May
Mar
May
Mar
May
Mar
May
Nov
Nov
Nov
Sep
Sep
Sep
Red sorghum prices also increased in 2017 2018 2019 2020
northern markets in Somaliland and
Puntland, between March and May 2020, Buale Marka Mogadishu
albeit moderately, tempered by continued
cross-border cereal flows from Ethiopia. 7000 Sorghum Prices 40000
Prices of local cereals were however
6000
largely stable in Galkayo market in central 30000
region between March and May 2020. 5000
20000
Cereal prices in many key monitored 4000
10000
markets indicated higher than normal 3000
price levels. This is expected to continue 2000 0
until the next harvests in July.
Jan
Sep
Jan
Sep
Jan
Sep
Jan
Nov
Nov
Nov
Mar
May
Jul
Mar
May
Jul
Mar
May
Jul
Mar
May
2017 2018 2019 2020
Scarcity of fruits and Hargeisa (SLShs) Borama (SLShs) Bossaso (SoShs)
vegetables led to price
escalations in mid-May due
to cut off roads linking rural
and urban areas.
Fuel prices throughout
Somalia are low reflecting
global trends.
14South Sudan
Staple food prices, Juba (SSP/kg) With a huge domestic cereal deficit (482,00 MT in
COVID-19 pandemic cases
2020), South Sudan relies heavily on maize
600 detected imports from Uganda during this period of the
year and is therefore highly exposed to imported
500
and seasonal food price shocks. Prices were
400
exceptionally high in the country from March
2020.
300
According to the last issue of the South Sudan
200 Monthly Market Price Monitoring Bulletin:
100 ❖ Seasonality, panic buying, hoarding of
commodities, increased transport costs,
0 reduced cross border trade supplies caused by
Jan
Jan
Jan
Jan
Sep
Sep
Sep
Nov
Nov
Nov
May
May
May
May
Mar
Jul
Mar
Jul
Mar
Jul
Mar
trade disruptions related to COVID-19 border
2017 2018 2019 2020
screening of truck drivers, led to the significant
Sorghum (Feterita) Wheat (flour) Groundnuts
staple food price increase from the third week
of March, rising to the highest level in May in
Wholesale Maize prices, Juba (USD/100kg) Juba since the 2016/ 2017 economic crisis;
❖ Fuel prices decreased in the first Quarter of the
110
year, in response to significant reduction in
90 global crude oil prices;
70
❖ The demand for US dollars dropped in April in
response to reduced demand of dollars by
50 traders and for transfers abroad following the
outbreak of COVID-19 pandemic, resulting in
30
stability of the SSP to the US$.
10
❖ In April 2020, the prices of beans, vegetable oil
J F M A M J J A S O N D
and wheat flour were in ‘crisis’ or ‘alert’ ALPS
Juba
phase in key urban markets across the country,
2012/16 Average 2020 2019 indicating higher than normal price levels.
Fuel and Exchange Rate Trends, Juba
330
300
270
240
210
180
Jan Mar May Jul Sep Nov Jan Mar May Jul Sep Nov Jan Mar
2018 2019 2020
Diesel, SSP/lt
Exchange Rate(Black Market- SSP/US$)
15Uganda
Uganda, being self-sufficient in cereal production, produces more food than it consumes and is
the bread basket of the region, exporting surplus food to Kenya, South Sudan, Rwanda and the
DRC. However, the cereal deficit pastoral Karamoja region is constantly faced with food supply
challenges from surplus regions resulting in higher prices compared to the rest of the country.
In 2020, tight domestic supply following a below-average 2019 cereal production, coupled with
sustained demand from Kenya and South Sudan have kept maize and beans prices higher than
normal and led to sharp increase in March and April. This trend has however been reversed by the
start of green harvest in bimodal areas
❖ In general, maize, sorghum and beans
prices followed typical seasonal trends from
January through May in Kampala, although Wholesale Maize Prices (Ug Shs/ Ton) in
they were higher than the five-year average Kampala
and 2019 levels. 1200000
❖ In May, wholesale price of key staple cereals 1000000
(maize, sorghum and cassava) declined in
Kampala after an initial panic buying, 800000
speculative trading and supply chain 600000
disruptions following implementations of 400000
COVID-19 pandemic measures led to price
spikes in March and April. 200000
❖ The combined effect of reduced effective 0
Apr
Mar
Jul
May
Jun
Aug
Sep
Dec
Jan
Nov
Feb
Oct
demand from institutional buyers (due to
closure of schools) and large scale traders
Five-Year Average 2020 2019
(due to transport restriction measures),
reduced household incomes and the start of
green consumption and harvests in bimodal
areas, led to maize and beans price Wholesale Beans Prices (Ug Shs/ Ton) in
declines. Prices of other staples (cassava, Kampala
sweet potatoes and banana) have also
3,500,000
stabilized.
❖ In Karamoja, maize prices were stable in 3,000,000
May after spiking in March while sorghum 2,500,000
and beans prices have sustained increasing
2,000,000
trends since the COVID-19 measures were
effected. 1,500,000
❖ Favourable prospects for the 2020 cereal 1,000,000
harvests in bi-modal areas starting June will
500,000
likely stabilize food prices nationally.
-
Jan Feb Mar Apr May Jun Jul Aug Sep Oct Nov Dec
5-YA 2019 2020
16Livestock Prices
Livestock production in arid and semi-arid lands (ASALs) is an important source of livelihood for
millions in Djibouti, Eritrea, Kenya, Somalia, Southern Ethiopia and Karamoja region of Uganda.
Livestock price is a key indicator of food access as livestock keepers as favourable prices allows
them to afford cereals and other essentials in the markets.
Somalia and Somali Region of Ethiopia: Prices Local Goat Prices (SoShs)- Galkayo, Somalia
of livestock increased since March and were 2,500,000
above the 5-year average in many markets due
to reduced supplies, increased domestic 2,000,000
consumption demand during Ramadhan as well 1,500,000
as improved body conditions due to abundant
1,000,000
seasonal rains that increased pasture and water
availability. 500,000
Kenya ASAL Counties: due to normal to above -
Jan Feb Mar Apr May Jun Jul Aug Sep Oct Nov Dec
normal rains that favoured pasture, forage,
browse and water availability and consequently
enhanced livestock body conditions, livestock 5-year average 2019 2020
prices were higher than the long term average.
According to National Disaster Management
Livestock Prices (ETB), Gode, Somali Region,
Authority, prices of small ruminants were either 3000 Ethiopia
stable or increased from January through April
2500
2020 especially for small ruminants in border
2000
counties having trade opportunities with
1500
Somalia and Ethiopia. However, in most of the
hinterland counties that rely on Nairobi and 1000
Mombasa markets, prices particularly for cattle 500
reduced from March, caused by supply 0
interruptions triggered by outbreak of COVID-
Jun
Jul
Dec
Jan
Aug
Jul
Dec
Jan
Mar
May
Mar
May
Oct
Apr
Nov
Oct
Feb
Feb
19 which reduced demand for meat following 2017 2018 2019 2020
closure of livestock markets, hotels and
restaurants. Restriction on movement of Livestock (Goat) Livestock (Sheep)
livestock traders also contributed to reduced
demand and reduced prices.
Karamoja Region: according to WFP Uganda
monthly price monitoring, the overall price
of goats declined between March and May due
to reduced demand following nationwide
curfews that disrupted livestock marketing,
reduced demand and consumption of meat
following COVID-19 prevention measures.
South Sudan: Livestock prices were either
stable or increased in most markets- particularly
in parts of Eastern Equatoria and Jonglei due to
improved body conditions. However, there were
significant price decreases in Lakes, Northern
Bahr Ghazal and Unity, linked to insecurity in
Lakes and reduced demand in the rest of the
states.
17Outlook
❖ Maize, sorghum and beans harvests in bi-modal cropping areas that have started in most
countries from June will likely result in stable or reduced prices of these staples. Prices of long-
season sorghum will continue increasing until the next harvests in September in unimodal areas.
Prices of staples will however continue to trend above the five-year average levels in most
markets.
❖ Continued cross-border trade disruptions due to COVID-19 control measures are likely to result
in localized prices increases of staples mostly in deficit producing countries.
❖ Staple food prices in countries facing macro-economic challenges- high inflation, currency
depreciation, shortage of dollars, low reserves etc (South Sudan, Burundi and Ethiopia) are likely
to trend above the normal seasonal levels.
❖ Projected improved seasonal rainfall performance through September is likely to help improve
livestock body conditions and reflect in higher prices in most pastoral livelihoods except for
likely stable or reduced prices in localized areas in ASALs of Kenya and Uganda (Karamoja) due
to lower demand for meat occasioned by COVID-19 containment measures.
For more information, please contact:
krishna.pahari@wfp.org
kennedy.nanga@wfp.org
miriam.vandenbergh@wfp.org
18You can also read