Renishaw plc - 2019 results - 1 August 2019 - Renishaw resource ...

Page created by Sheila Patton
 
CONTINUE READING
Renishaw plc - 2019 results - 1 August 2019 - Renishaw resource ...
Renishaw plc – 2019 results

         1 August 2019
Renishaw plc - 2019 results - 1 August 2019 - Renishaw resource ...
Summary

• Revenue of £574.0m (2018: £611.5m), a decrease at constant exchange rates of 7%.

• Growth in the Americas and EMEA regions; weakness in the APAC region (19% decrease at constant
  exchange rates).

• Metrology revenue decreased by 7% to £532.9m:

    • Strong growth in our additive manufacturing line. Good growth in our measurement and automation
      line (Equator gauging systems) and fixturing line.

    • Slowdown in demand for encoder and machine tool products in the APAC region.

• Healthcare revenue increased by 15% with strong growth in our spectroscopy and medical dental
  product lines.
Renishaw plc - 2019 results - 1 August 2019 - Renishaw resource ...
Group revenue analysis
Changes in geographic area                                                      Market conditions
                                     Change at actual fx   Change at constant
                                                      %                 fx %
                                                                                •   APAC region impacted by slowdown in demand for
APAC                                            -17%                  -19%          encoder and machine tool products.

EMEA                                               1%                   2%      •   Encoder product demand lower due to reduced
                                                                                    investments in electronics production equipment and
Americas                                           5%                   1%          semiconductor manufacturing.
UK                                                11%                  11%
                                                                                •   Machine tool products affected by lower sales to
Total                                             -6%                  -7%          large end-user manufacturers of consumer
                                                                                    electronic products, with weaker smartphone
Revenue by major countries               Average exchange rates                     demand leading to over-capacity in the supply chain.
                   2019      2018                            2019      2018     •   No erosion in our customer base.
                    £m         £m

USA                113.2     108.1

China              111.0     150.2       GBP : USD            1.29      1.35

Japan               63.7      60.9       GBP : EUR            1.13      1.13

Germany             60.9      64.4       GBP : JPY             144      149
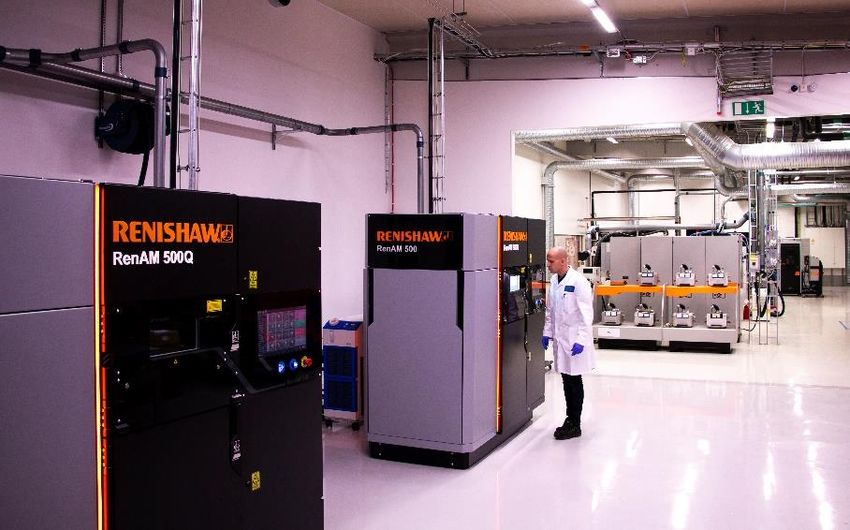
Renishaw plc - 2019 results - 1 August 2019 - Renishaw resource ...
Summary (continued)

• Adjusted profit before tax of £103.9m (2018: £145.1m), a decrease of 28%

     • Substantial increase in adjusted operating profit for Healthcare to £3.1m.

• Statutory profit decreased 29% to £109.9m (2018: £155.2m)

•   People key to delivery of our strategy; headcount increase of 179, with 119 graduates and apprentices
    joining during the year.

•   Capital expenditure of £56.8m (2018: £34.9m), providing for future growth.

•   Strategy of focusing more on end-user solutions continued to drive investment in new facilities for
    demonstration, training and service with overseas property investments in Brazil, Japan and The
    Netherlands.

•   Strong balance sheet, with end of year cash of £106.8m, compared with £103.8m last year.

•   Recommended final dividend of 46.0p per share; total dividend per share for the year unchanged over
    last year at 60.0p (2018: 60.0p).
Renishaw plc - 2019 results - 1 August 2019 - Renishaw resource ...
Financial summary (continuing operations)
                                2019     2018    Change   Revenue £m
                                  £m       £m        %    700
                                                                                                 611.5
                                                          600
                                                                                                                574.0
                                                                                        536.8
Revenue                         574.0    611.5     -6%               494.7
                                                          500                 427.2
                                                          400

                                                          300
Adjusted profit before tax      103.9    145.1   -28%     200

% return on revenue              18%      24%             100

                                                           0
                                                                     2015     2016      2017      2018          2019

Statutory profit before tax     109.9    155.2   -29%
                                                                Adjusted profit before tax £m
Tax                            (17.7)   (22.9)    23%       160                                                        60
                                                                      144.2                     145.1
                                                            140
Profit after tax                 92.2    132.4   -30%                                                                  50
                                                            120                        109.1             103.9

                                                                                                                            % of revenue
                                                                                                                       40
                                                            100                87.5
                                                                80                                                     30
Adjusted earnings per share    119.9p   170.5p   -30%           60
                                                                                                                       20
                                                                40
Statutory earnings per share   126.7p   181.8p   -30%                                                                  10
                                                                20
                                                                 0                                                     0
                                                                       2015    2016     2017    2018     2019
Dividend per share              60.0p    60.0p                                 Adjusted PBT      % of revenue
Renishaw plc - 2019 results - 1 August 2019 - Renishaw resource ...
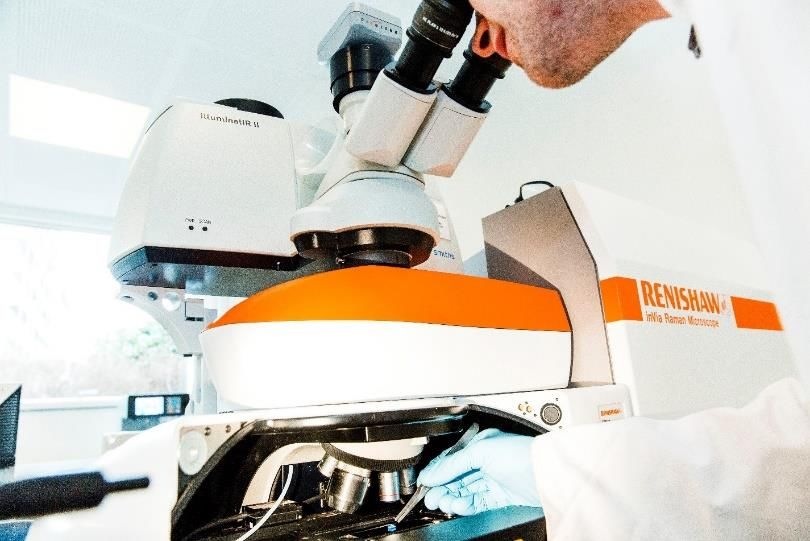
Adjusted earnings per share and Dividend per share
 Adjusted earnings per share p                        Dividend per share p
 180   167.5                   170.5
                                                      70
 160                                                                                                            60.0          60.0
 140
                       132.4                          60                                         52.0
                                       119.9                                     48.0
 120                                                  50          46.5                                     46.0           46.0
               100.4                                                                       39.5
 100                                                  40      34.0          35.5
  80
                                                      30
  60
  40                                                  20   12.5          12.5           12.5            14.0           14.0
  20                                                  10
   0
                                                       0
       2015    2016    2017    2018    2019
                                                             2015          2016           2017            2018           2019

                                                                                Interim        Final    Total
 Statutory earnings per share p
 200                           181.8
 180   167.5                                   Full year
 160                   141.3                   dividend      +13%           +3%            +8%            +15%            +0%
 140                                   126.7   increase
 120
 100                                           Full year
  80
               71.8                            dividend       3.6           2.1            2.5             2.8            2.0
  60                                           cover
  40
  20
   0
       2015    2016    2017    2018    2019
Renishaw plc - 2019 results - 1 August 2019 - Renishaw resource ...
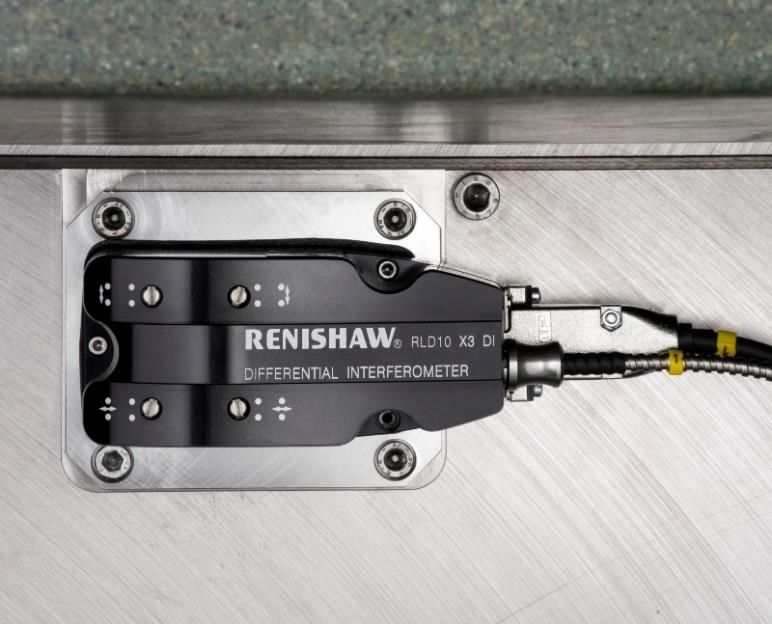
Business sector performance
Revenue
                             2019    2018    Change   Revenue – 1st & 2nd half £m
                              £m       £m        %
                                                      350                                                                332.0

Metrology                    533.0   575.8     -7%    300
                                                                                                         296.4
                                                                                                                 279.5
                                                                                                                                 296.7
                                                                                                                                         277.3
                                                                    270.9

Healthcare                    41.0    35.7     15%    250   223.8
                                                                                    233.4        240.4

                                                                            193.8
Total                        574.0   611.5    -6.1%   200

                                                      150

                                                      100

                                                       50

Adjusted operating profit                              0
                                                              2015            2016                 2017            2018            2019
                             2019    2018    Change
                                                                                    First half      Second half
                              £m       £m        %
Metrology                     90.6   142.8     -37%
                                                        Year-on-year changes:
Healthcare                     3.1     0.3    933%      First half                  -13%                 24%      16%            6%

Total                         93.7   143.1     -35%     Second half                 -14%                 27%      12%            -16%
Renishaw plc - 2019 results - 1 August 2019 - Renishaw resource ...
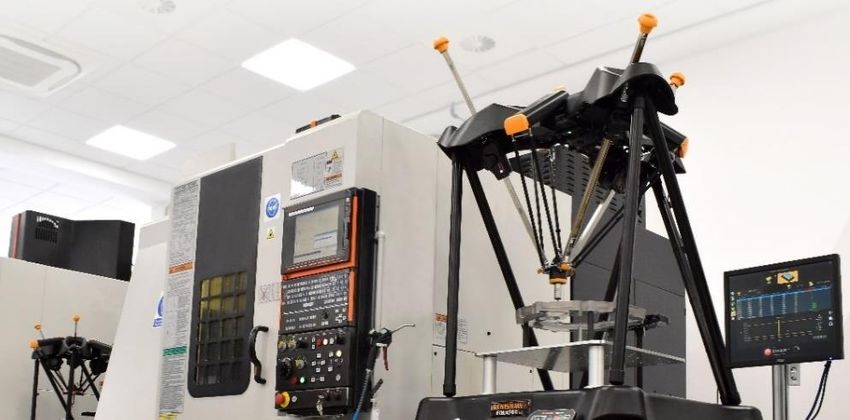
Adjusted profit before tax bridge
Renishaw plc - 2019 results - 1 August 2019 - Renishaw resource ...
Income statement
                                                                         2019            2018
                                                                          £m     %        £m     %     Change   Cost of sales £m
                                                                                                                250                                               80
Revenue                                                                 574.0    100    611.5    100     -6%                                     207.5   200.1
                                                                                                                200                      182.6
                                                                                                                      157.8                                       60

                                                                                                                                                                       % of revenue
                                                                                                                               145.3
Cost of sales                                                          (200.1)   35    (207.5)   34      -4%    150
                                                                                                                                                                  40
Engineering (inc. R&D)                                                  (89.8)   16     (77.4)   13     16%     100
                                                                                                                                                                  20
                                                                                                                50
Gross profit                                                            284.1    49     326.6    53     -13%
                                                                                                                  0                                               0
                                                                                                                      2015     2016      2017    2018     2019
Distribution costs                                                     (126.8)   22    (121.4)   20      4%
                                                                                                                              Cost of sales £m     % of revenue
Administrative costs                                                    (58.6)   10     (56.9)   9       3%

Fair value gains/(losses) on financial instruments                        1.1     -       4.8    1      -77%

Financial expense (net)                                                   6.3    1       (0.9)    -    -800%

Share of profits of associates and joint ventures                         3.8    1        3.0    1      27%

Statutory profit before tax                                             109.9    19     155.2    25     -29%
FV gains and losses on instruments not eligible for hedge accounting

-reported in revenue                                                     (5.0)   1       (5.3)   -1      -6%
-reporting in fair value gains/(losses) on financial instruments         (1.0)    -      (4.8)    -     -79%

Adjusted profit before tax                                              103.9    18     145.1    24     -28%
Renishaw plc - 2019 results - 1 August 2019 - Renishaw resource ...
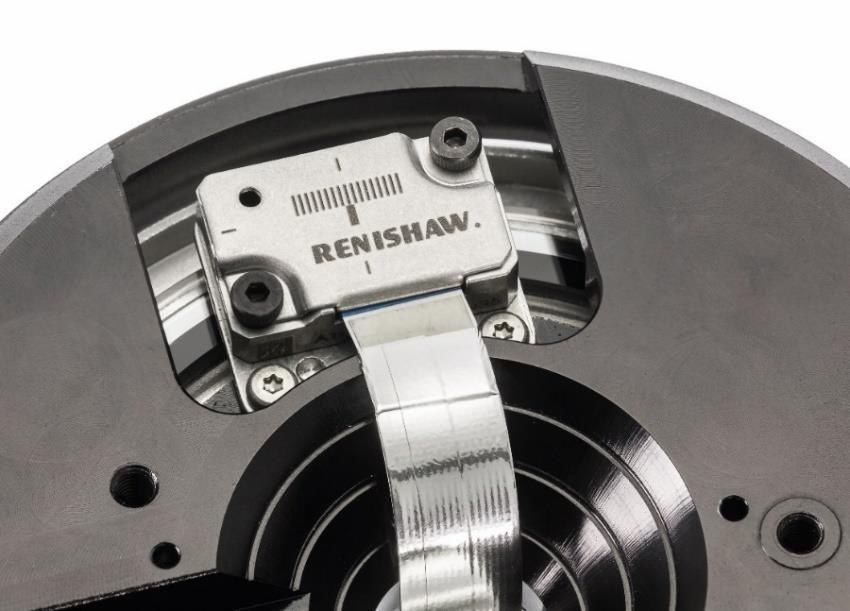
Income statement – Engineering costs
Engineering costs
                                                                   Engineering costs (total) £m
                                    2019       2018      Change
                                                                   100                                                              50
                                     £m          £m          %                                                       89.8
                                                                    90
                                                                                               78.0           77.4
                                                                    80                                                              40
Total spend                         97.9       83.6          17%         66.1        68.8
                                                                    70

                                                                                                                                         % of revenue
                                                                    60                                                              30
Less capitalised net                 3.0        2.1          43%
                                                                    50

Less R&D tax credit                  5.1        4.1          24%    40                                                              20
                                                                    30
Net R&D                             89.8       77.4          16%    20                                                              10
                                                                    10
                                                                    0                                                               0
                                                                         2015        2016      2017           2018   2019
                                    2019       2018      Change
Total spend segmental
                                     £m          £m          %              R&D £m          Other engineering £m     % of revenue

Metrology                           90.7       77.1          18%
Healthcare                           7.2        6.5          11%

                                    2019       2018      Change
                                     £m          £m          %
New product spend                   67.0       59.1          13%

•Continued investment in R&D, with net increase of 107 R&D
employees from June 2018
Income statement – Distribution costs
Distribution costs
                                                                Distribution costs £m
                                                                140                                         126.8     50
                                                                                                    121.4
•Continued expansion of global marketing and distribution       120                       112.7
                                                                                                                      40
infrastructure to support new and existing products             100   87.9      93.8

                                                                                                                           % of revenue
                                                                 80                                                   30

                                                                 60                                                   20
•Distribution costs up 4% from last year, representing 22% of    40
                                                                                                                      10
revenue (2018: 20%)                                              20

                                                                  0                                                   0
                                                                      2015     2016        2017     2018     2019
•Purchase of property in Japan and The Netherlands and                       Distributon costs £m      % of revenue
purchase of land in Brazil
Income statement – Administrative costs and Group employees
Administrative costs                                                       Administrative costs £m
                                                                           70                                                         30
                                                                                                                    56.9     58.6
•Inflationary increases                                                    60                            52.4                         25
                                                                           50      41.8

                                                                                                                                           % of revenue
                                                                                              40.2                                    20
•Headcount increase to support business growth and increasing complexity   40
                                                                                                                                      15
                                                                           30
•Offset arising from reduction in bonuses                                  20
                                                                                                                                      10

                                                                           10                                                         5
•GMP equalisation cost of £0.8m
                                                                            0                                                         0
                                                                                   2015       2016       2017       2018     2019
                                                                                          Administrative costs £m          % of revenue
Group headcount (at June)
                                    2019      2018     Change              Group headcount (year end) No.
                                                                                                                           4,862    5,041
                                     No.       No.        No.              5,050
                                                                                                  4,286
                                                                                                                4,530
                                                                           4,550     4,112
                                                                           4,050
UK                                 3,167     3,045         122             3,550
                                                                           3,050
Overseas                           1,874     1,817          57             2,550
                                                                           2,050
Total                              5,041     4,862         179             1,550
                                                                           1,050
                                                                             550
•Total headcount up 179 from June 2018                                        50
                                                                            -450

•119 apprentices and graduates have joined the business since June 2018              2015         2016          2017       2018      2019

•Additionally we took on 73 paid industrial and summer placements
Business systems

•   In recent years, we have made significant progress in
    enhancing and simplifying financial reporting
    processes and systems, to further improve the
    analysis of business performance.

•   With a focus on increasing productivity and
    efficiency, major systems developments are in
    progress in the following areas:
      - HR
      - engineering change management
      - marketing

•   Recently committed to a new ERP system to replace
    our global finance, sales & marketing, CRM and
    overseas distribution systems.
Balance sheet
£m                                    June 2019    June 2018   Change %
Property, plant & equipment               263.5        232.6       13%                  Total equity £m
                                                                          700
Intangible assets & investments            72.1         64.3       12%                                                         583.3
                                                                          600                                    548.6
Deferred tax assets                        29.9         27.3       10%    500   428.5                 443.8
                                                                                          381.4
Long-term loans to associates & JVs         0.7          4.2       -83%   400
                                                                          300
Derivatives                                 1.3          9.6       -86%
                                                                          200
Total non-current assets                  367.5        338.0        9%
                                                                          100
                                                                            0
                                                                                2015       2016        2017      2018          2019
Inventories                               129.0        110.6       17%
Debtors                                   159.2        177.3       -10%
                                                                                Working capital (excluding cash &
Pension scheme cash escrow account         10.5         10.4        1%                    derivatives) £m
                                                                          225                                 202.0     211.6     100
Cash                                      106.8        103.8        3%                  183.3
                                                                          200                      180.8
                                                                          175                                                     80
Derivatives                               (16.1)      (21.1)       -24%

                                                                                                                                        % of revenue
                                                                          150   130.6
                                                                                                                                  60
Creditors (current)                       (76.6)      (86.0)       -11%   125
                                                                          100
                                                                                                                                  40
Net current assets                        312.8        295.1        6%     75
                                                                           50                                                     20
                                                                           25
Borrowings                                 (9.4)           -                0                                                     0
                                                                                2015     2016       2017      2018       2019
Employee benefits                         (51.9)      (67.4)       -23%
                                                                                         Working capital        % of revenue
Derivatives                               (35.7)      (17.0)      110%
Net assets, equal to Total equity         583.3        548.6        6%
Defined benefit pension schemes
UK defined benefit pension scheme - new funding plan

                                                                                                                                                         Year ended
Previous funding plan                                                                                                                                       30 June
Company paid all monthly pension payments and lump sum payments, and transfer                                                                                   2019
payments to a limit of £1.0m in each year, until the earlier of 30 June 2031 or                                                                                £’000
reaching the self-sufficiency funding target, totalling circa £4.0m per annum.

New funding plan                                                                     Balance at the beginning of the period                                    (67,378)
£8.7m per annum for five years effective from 1 October 2018. At 30 June 2031 the    Contributions paid                                                          6,831
Company is obliged to pay any remaining deficit, unless self-sufficiency funding     Interest on pension schemes1                                                (845)
target is achieved before this date. Payments may reduce in the event of the         Remeasurement loss from GMP equalisation2                                   (751)
funding target being achieved before 30 September 2023.
                                                                                     Remeasurement loss under IAS 193                                          (21,227)

Contingent assets                                                                    Change in remeasurement gain under IFRIC 143                               31,500
The scheme continues to have charge over a number of UK properties and the
pension scheme escrow account.                                                       Balance at the end of the period                                          (51,870)

IFRIC 14
The present value of guaranteed payments under the new plan is lower than the
IAS 19 pension scheme deficit at 30 June 2019, such that no adjustment to the
scheme’s liabilities are required in accordance with IFRIC 14.
                                                                                    1Reported   in Financial expenses. 2Reported in Administrative expenses.
                                                                                    3Reported   in Other Comprehensive income and expense.
Cash flow

*Including continuing and discontinued operations
Capital expenditure
                                                      2019           2018
                                                       £m             £m
                                                                                Capital expenditure £m

Capital expenditure                                   56.8               34.9   60                                         56.8
                                                                                55              53.0

                                                                                50   48.4
• Property
                                                                                45                      42.6
The main property additions were                                                40
                                                                                                                           31.4

                                                                                                                 34.9
                                                                                35   27.5       35.6
 - in the UK, construction in progress for a 94,000 sq ft extension to our                              18.4
Renishaw Innovation Centre due for completion in December 2019                  30

                                                                                25
 - in The Netherlands, the purchase of our existing facility                                                      24.9
                                                                                20

  - in Brazil the purchase of land for the future development of a new          15
distribution facility                                                                                   24.2               25.4
                                                                                10   20.9
                                                                                                17.4
  - in Japan, the purchase of property in Nagoya to support the expansion of     5                                10.0
our distribution function, funded by local third-party borrowing
                                                                                 0
                                                                                     2015       2016    2017     2018      2019
• Plant & equipment
                                                                                            Property   Plant & equipment
  - £31.4m expenditure on plant, equipment and IT systems in 2019 (2018:
£24.9m)
Property

Nagoya, Japan, distribution facility

                                       Renishaw Innovation Centre extension (artist’s impression)
Industrial metrology - market drivers

Increasing component complexity and
closer tolerances

Global skills shortages require:
• Easier to use solutions
• More automation and robotics

Weaker smartphone demand/over-
capacity in the supply chain

                                      Renishaw’s strength is breadth of products and applications knowledge
Industrial metrology

Shopfloor measurement
On–machine measurement
Cutting tools and components remain in situ on the machine
tool and automatically checked using a tool setting probe
(e.g. new APCA-45) or inspection probe (e.g. new RMP400).
Data is used to automatically update the manufacturing
process.

In–process measurement
Components removed from the machine tool and inspected
on standalone measurement device e.g. Equator™ 500
gauging system. Data is used to update the manufacturing
process.
• Have expanded range of machine tool controllers that
   support direct IPC (intelligent process control) connections
   for automated closed-loop feedback.
Industrial metrology

Automation
Increasing use of Equator gauging systems within automated
manufacturing processes. Parts transferred from machine
tools using robots or automatic transfer systems.

Increasing use of our transfer systems for Equator systems
and CMMs. These allow parts to be loaded on to a fixture
plate and transferred in and out of the measuring volume
under automatic program control. They can be loaded
                                                                             Equator transfer system
manually or robot loaded in an automated cell.

There is increasing use of automated changing between
different sensor types for the REVO® measuring head
(contact, optical and surface finish).
                                                                                            CMM shuttle system

                                                             REVO changing rack
Position measurement – market drivers

Market drivers are size, accuracy, speed, ease of use.

Reduced investments in electronics production and semiconductors.

Opportunities due to increased utilisation of our encoders and new application areas. Positive
trends include new flat panel display technology, the demand for 5G mobile products, more
automation/robotics and increasing requirement for more real-time data on machine performance.
Position measurement

Multi-axis periscope (RMAP)
• Designed to enable accurate six degrees of freedom
  measurements in XY stage applications, utilising the
  performance from Renishaw’s RLD10-X3-DI interferometer head.
• Higher machine performance requires multiple interferometer
  feedback axes

QUANTiC™ rotary encoder system
• New rotary version of the QUANTiC encoder system family - a
  high performance, super-compact, digital all-in-one incremental
  open optical encoder.
• Offers machine builders ease-of-use for machine set-up due to
  exceptionally wide installation and operating tolerances –
  potentially significant time and cost savings for high-volume
  production lines.
Position measurement

ATOM DX™ encoder series
• Our smallest incremental encoder, with digital output direct from
  the readhead, eliminating the need for bulky interfaces.
• A high-performance encoder that features resolutions down to
  2.5 nm, low Sub-Divisional Error (SDE) and low jitter.
• Can be used with a wide range of linear and rotary scales to
  meet most application requirements.
• Launched at SEMICON West, California in July 2019.
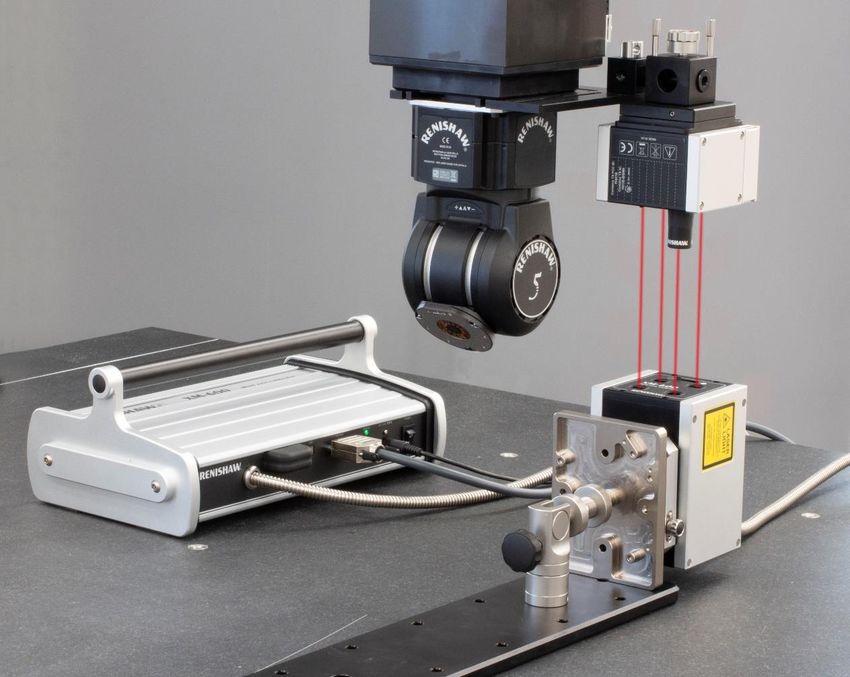
Position measurement

XM-600 laser measurement system for co-ordinate
measuring machines (CMMs)
• Uses technology developed for the Renishaw XM-
  60 multi-axis calibrator to enable faster and easier
  error mapping of a CMM.
• Measures all six degrees of freedom from a single
  set-up, in any orientation for linear axes.
• Connects directly with Renishaw's range of UCC
  CMM controllers and easily communicates with the
  UCC software during the calibration routine to
  quickly build a complete error map of the CMM.
• Enables the complete error map of a CMM within
  half a day.
Additive manufacturing – market drivers

Our systems are based on laser powder bed fusion technology for high-value metal part production.

Market drivers include machine productivity, lower cost-per-part, process stability and part quality.

Opportunities in multiple markets, with greater maturity in aerospace, healthcare and tooling.
Additive manufacturing

RenAM 500Q additive manufacturing (AM) system
• Four high-power 500 W lasers, with each able to access the whole
  powder bed surface simultaneously.
• Offers a substantial reduction in cost per part whilst maintaining the
  quality and precision offered by standard single laser systems.
• New ‘S’ version of the RenAM 500 production series platform available
  with single laser.

InfiniAM Spectral
• Works with Renishaw's LaserVIEW and MeltVIEW hardware, to
   provide feedback on energy input and emissions from the AM build
   process.
• Process feedback is essential in understanding component quality
   throughout the build process, monitoring laser and melt-pool
   characteristics in high-temporal resolution to provide a 2D and 3D view
   of the build.
Additive manufacturing

Recent AM customers
• As well as investing in RenAM 500Q systems, Sweden-based
  Sandvik Additive Manufacturing is also collaborating with
  Renishaw in areas such as materials development, AM process
  technologies and post-processing.
• In the USA, Knust-Godwin, a supplier to the oil and gas sector, has
  purchased four RenAM 500Q systems. Mike Corliss, VP, Technology,             Sandvik

  says, “A project which previously required a 24 month wait from
  concept to commercialisation can now be reduced to eight months.”
• Siemens has invested in RenAM 500Q technology as part of a £27
  million investment for its UK subsidiary Material Solutions.
• PrinterPrezz (USA) has invested in a RenAM 500M system as part
  of a one-stop 3D printing facility for the medical sector, including the
  manufacture of medical devices, surgical aids, and prosthetics.
                                                                             Knust-Godwin
Healthcare – market drivers

Requirement for faster procedures to reduce waiting times, more economical treatments, more patient-
specific treatments (e.g. implants), and safer procedures with reduced human errors.

Increased life expectancy on a global basis means greater incidences of degenerative diseases.

Growth in research in key areas such as biomedical, nanomaterials and green energy.
Raman spectroscopy

Market applications

Focus on new application areas to address in existing and new markets
for our Raman systems. Current focus in the areas of healthcare
(cancer diagnosis) and the environment (microplastics).

Several inVia Raman microscope systems supplied for research by
academics and water companies into the identification of microplastics.
Includes the Danish Technological Institute which is working with private
                                                                            inVia system at the Danish Technological Institute
companies and the Danish Environmental Protection Agency on
technologies to remove plastic particles from the aqueous environment.

The new RA816 Biological Analyser is a compact benchtop Raman
imaging system, designed exclusively for biological and clinical
research. At the John Ratcliffe Hospital in Oxford, UK, a system is being
used for brain tumour research.

                                                                            R816 Biological Analyser
Neurosurgery
New 2D patient registration module
The new neurolocate™ 2D module, has obtained a CE mark and can be
offered to hospitals across Europe. It allows the surgeon to accurately
determine the position of the patient relative to the neuromate robot.

The 2D module requires just two X-rays to register patient position, and
is supported within the new neuroinspire™ version 6 planning software.

Clinical studies

Results released of a pioneering clinical trial for the treatment of
Parkinson’s using the drug GDNF, for which Renishaw manufactured a
drug delivery device on behalf of North Bristol NHS Trust. The drug
delivery system was shown to have performed effectively and reliably.
Our products are also being used in another Parkinson’s clinical trial
(using the drug CDNF) in Scandinavia, and we are seeing significant
interest in the use of our technologies for the treatment of brain tumours
and neurodegenerative diseases.
Brexit

             The Board continues to oversee the work of the Brexit steering group in identifying the key risks arising
             from a no-deal Brexit and implementing mitigation plans, being:

             • the establishment of a new distribution warehouse in Ireland which, if required, would significantly
             reduce the number of direct shipments between the UK and the EU post Brexit;

             • an increase in inventory of certain components and finished goods held at our various sites within the
             EU and the UK; and

             • continued ongoing assessment and updating of other key issues arising from Brexit and the
             mitigation against any possible negative impacts.

             The steering group will continue to carefully monitor the ongoing developments in the Brexit process
             and consider the impact of these against our current plans as the situation develops in the coming
             months.

01/08/2019
32
Outlook - summary

• Challenging business environment expected to continue during this year.

• Our vision remains unchanged: long-term investments in patented and innovative products and
  processes, high-quality manufacturing, and the provision of excellent local support to customers in all
  our markets around the globe.

• Short term focus is on continuing to improve productivity and drawing maximum benefit from the
  investments that we have made in people, innovation and infrastructure over the last few years.

• We remain confident in the long-term prospects for the Group due to the high quality of our people, our
  innovative product pipeline, extensive global sales and marketing presence and relevance to high-value
  manufacturing.
Disclaimer
This document contains statements about Renishaw plc that are or may be forward-looking statements.

These forward-looking statements are not guarantees of future performance. They have not been reviewed by the auditors of Renishaw
plc. They involve known and unknown risks, uncertainties and other factors which may cause the actual results, performance or
achievements of any such person to be materially different from any results, performance or achievements expressed or implied by
such statements. They are based on numerous assumptions regarding the present and future business strategies of such persons and
the environment in which each will operate in the future. All subsequent oral or written forward-looking statements attributable to
Renishaw plc or any of its shareholders or any persons acting on its behalf are expressly qualified in their entirety by the cautionary
statement above. All forward-looking statements included in this document speak only as of the date they were made and are based on
information then available to Renishaw plc. Investors should not place undue reliance on such forward-looking statements, and
Renishaw plc does not undertake any obligation to update publicly or revise any forward-looking statements.

No representation or warranty, express or implied, is given regarding the accuracy of the information or opinions contained in this
document and no liability is accepted by Renishaw plc or any of its directors, members, officers, employees, agents or advisers for any
such information or opinions.

This information is being supplied to you for information purposes only and not for any other purpose. This document and the
information contained in it does not constitute or form any part of an offer of, or invitation or inducement to apply for, securities.

The distribution of this document in jurisdictions other than the United Kingdom may be restricted by law and persons into whose
possession this document comes should inform themselves about, and observe any such restrictions. Any failure to comply with these
restrictions may constitute a violation of laws of any such other jurisdiction.
You can also read