INVESTOR PRESENTATION - | AXON ENTERPRISE May 2021
←
→
Page content transcription
If your browser does not render page correctly, please read the page content below
INVESTOR PRESENTATION
    |   AXON ENTERPRISE   |
             May 2021
Safe-harbor statement
Forward-looking statements in this letter include, without limitation, statements regarding: the impact of the COVID-19 pandemic; proposed products and services and related development efforts and
activities; expectations about the market for our current and future products and services; strategies and trends relating to subscription plan programs and revenues; strategies and trends, including the
benefits of, research and development investments; the timing and realization of future contracted revenue; expectations about customer behavior; statements concerning projections, predictions,
expectations, estimates or forecasts as to our business, financial and operational results and future economic performance, including our outlook for 2021 and 2022 full year revenue, Adjusted EBITDA,
stock-based compensation expense, and capital expenditures; statements of management’s strategies, goals and objectives and other similar expressions; as well as the ultimate resolution of financial
statement items requiring critical accounting estimates, including those set forth in our Form 10-K for the year ended December 31, 2020. Such statements give our current expectations or forecasts of
future events; they do not relate strictly to historical or current facts. Words such as “may,” “will,” “should,” “could,” “would,” “predict,” “potential,” “continue,” “expect,” “anticipate,” “future,” “intend,”
“plan,” “believe,” “estimate,” and similar expressions, as well as statements in future tense, identify forward-looking statements. However, not all forward-looking statements contain these identifying
words.

We cannot guarantee that any forward-looking statement will be realized, although we believe we have been prudent in our plans and assumptions. Achievement of future results is subject to risks,
uncertainties and potentially inaccurate assumptions. The following important factors could cause actual results to differ materially from those in the forward-looking statements: the potential global
impacts of the COVID-19 pandemic; our exposure to cancellations of government contracts due to appropriation clauses, exercise of a cancellation clause, or non-exercise of contractually optional periods;
our ability to design, introduce and sell new products or features; our ability to defend against litigation and protect our intellectual property, and the resulting costs of this activity; our ability to manage our
supply chain and avoid production delays, shortages and impacts to expected gross margins; the impact of stock compensation expense, impairment expense, and income tax expense on our financial
results; customer purchase behavior, including adoption of our software as a service delivery model; negative media publicity regarding our products; the impact of product mix on projected gross margins;
defects in our products; changes in the costs of product components and labor; loss of customer data, a breach of security, or an extended outage, including by our third party cloud-based storage
providers; exposure to international operational risks; delayed cash collections and possible credit losses due to our subscription model; changes in government regulations in the U.S. and in foreign
markets, especially related to the classification of our products by the United States Bureau of Alcohol, Tobacco, Firearms and Explosives; our ability to integrate acquired businesses; our ability to attract
and retain key personnel; and counter-party risks relating to cash balances held in excess of FDIC insurance limits. Many events beyond our control may determine whether results we anticipate will be
achieved. Should known or unknown risks or uncertainties materialize, or should underlying assumptions prove inaccurate, actual results could differ materially from past results and those anticipated,
estimated or projected. You should bear this in mind as you consider forward-looking statements. Our Annual Report on Form 10-K and our Quarterly Reports on Form 10-Q list various important factors
that could cause actual results to differ materially from expected and historical results. These factors are intended as cautionary statements for investors within the meaning of Section 21E of the Exchange
Act and Section 27A of the Securities Act. Readers can find them under the heading "Risk Factors" in the Annual Report on Form 10-K and in the Quarterly Reports on Form 10-Q, and investors should refer
to them. You should understand that it is not possible to predict or identify all such factors. Consequently, you should not consider any such list to be a complete set of all potential risks or uncertainties.

Except as required by law, we undertake no obligation to publicly update forward-looking statements, whether as a result of new information, future events or otherwise. You are advised, however, to
consult any further disclosures we make on related subjects in our Form 10-Q, 8-K and 10-K reports to the SEC.

                                                                                                                                                                                                                     2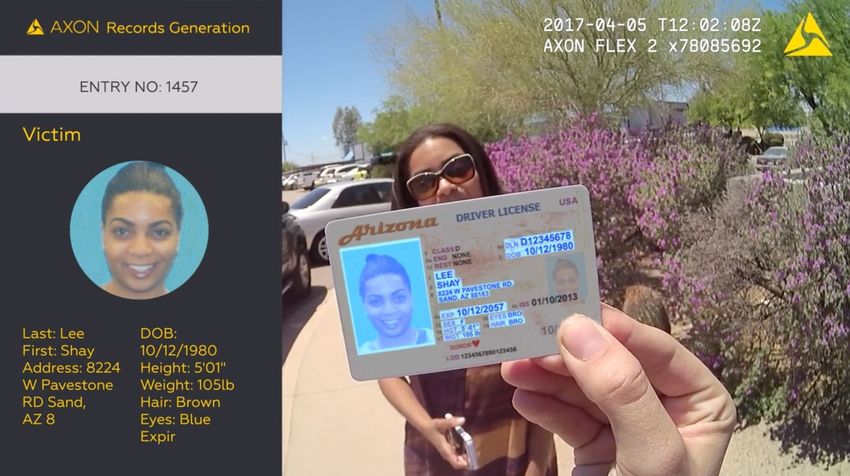
PROTECT LIFE

CAPTURE TRUTH

ACCELERATE JUSTICE

                     3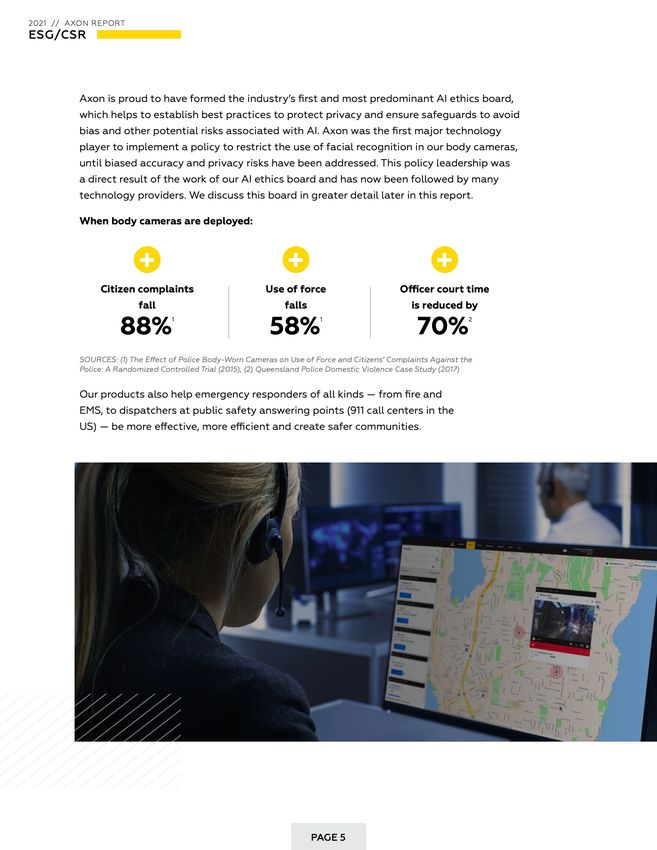
to stun.
          Axon is building the future envisioned by Star Trek creator Gene
          Roddenberry, where technology helps elevate humanity. TASER devices
          were directly inspired by Captain Kirk’s Phaser.

                                                                                4
TASER is a trademark of Axon Enterprise, Inc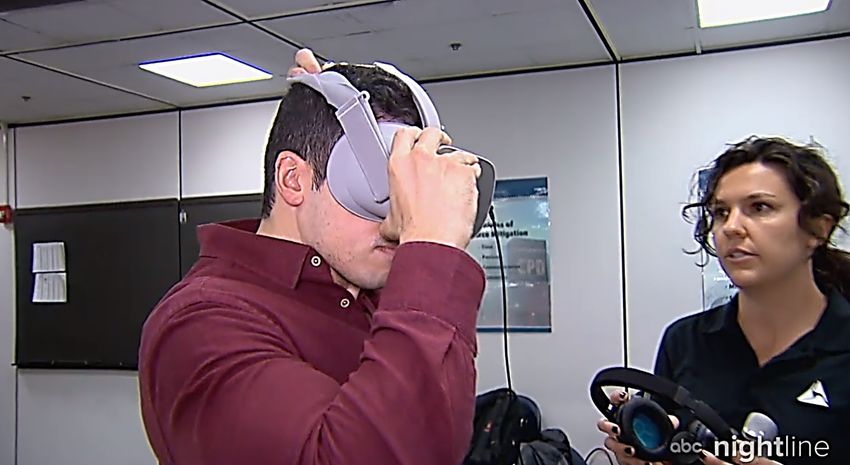
Axon’s mission is to protect life

                                         1. OBSOLETE THE                                                                                                                                                                        ~249,000 LIVES SAVED FROM
                                             BULLET                                                                                                                                                                             DEATH OR SERIOUS INJURY1

                                         2. REDUCE SOCIAL                                                                                                                                                                       COMPLAINTS DOWN 88%2 USE
                                            CONFLICT                                                                                                                                                                            OF FORCE DOWN 58%2

                                         3. ENABLE A FAIR &                                                                                                                                                                     GUILTY PLEAS UP 20%3
                                            EFFECTIVE JUSTICE                                                                                                                                                                   OFFICER COURT TIME
                                            SYSTEM                                                                                                                                                                              REDUCED BY 70%4

1 M.W. Kroll Study (2009) 2 The Effect of Police Body-Worn Cameras on Use of Force and Citizens’ Complaints Against the Police Study (2015)   3 Newport News Case Study (2015)   4 Queensland Police Domestic Violence Case Study (2017)
                                                                                                                                                                                                                                                       5
ESG is a core competency

                           Full 2021 report:
                           https://s22.q4cdn.com/113350915/files/doc_financials/2020/q4/AXON_ESGReport_Feb2021.pdf
                                                                                                               6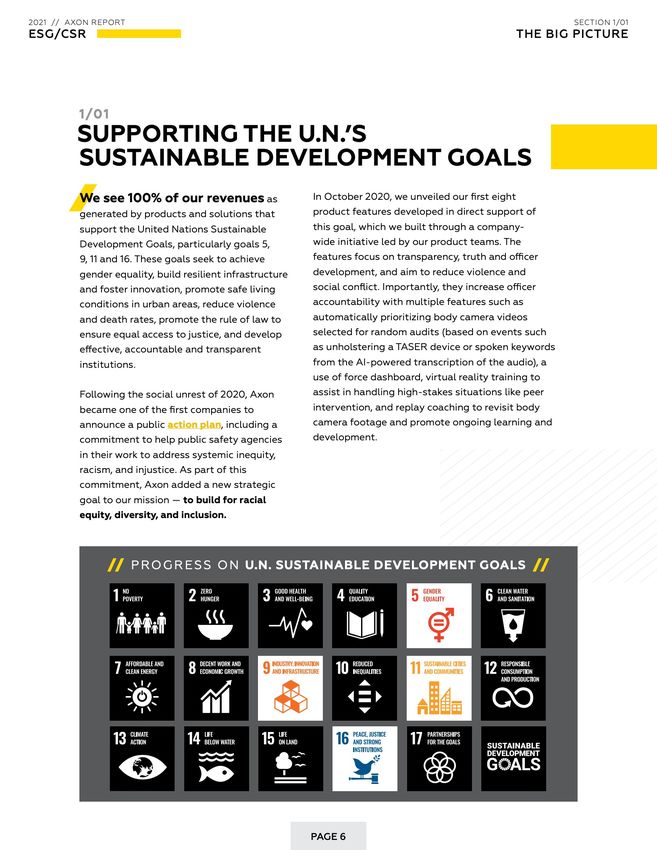
Axon leadership has generated a powerful financial profile

                                                                                                                                                                                                                                                                             2016–20
                                                                                                                                                                                                                                                                              CAGR
                     750K+                                                               73%                                                                                                   Revenue ($ million)

                     TASER devices in place
                                                                         2020 revenue from recurring bundles                                                                                                                                                         $681     26%
                        today globally

                                                                                                                                                                                                                                                $531                  $177    57%
                                                                                                                                                                                                                   $420
                                                                                                                                                                                        $344                                                       $130

                    ~119%                                                                                                                                                                                                                                                     40%
                                                                                                                                                                                                                                                                      $137

                        Net dollar retention
                                                                            $242mm                                                                            $268
                                                                                                                                                                                             $58
                                                                                                                                                                                             $51
                                                                                                                                                                                                                         $92

                                                                                                                                                                                                                         $75
                                                                                                                                                                                                                                                   $119

                                                                           Annual recurring software revenue                                                      $29
                                                                                                                                                                  $36
                                                                                                                                                                                                                                                                      $367    16%
                                                                                                                                                                                                                        $253                       $282
                                                                                                                                                                  $203                       $235

                            77%                                                        23%                                                                     2016                       2017                       2018                       2019                 2020
                     2020 cloud gross margin                                 2020 Adjusted EBITDA margin
                                                                                                                                                                                     Axon Cloud                      Sensors & Other                         TASER

Note: TASER devices in place today globally represents total number of units sold in the last 5 years. Annual recurring revenue is as of Axon’s latest quarterly report. Refer to quarterly shareholder letters, filed on form 8-K, for Non-GAAP reconciliations                    7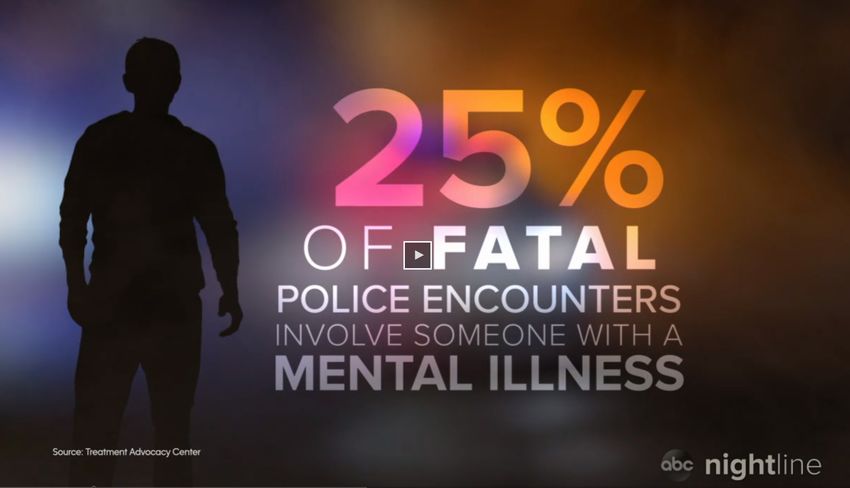
Evolving public safety ecosystem
         AXON 1.0                       AXON 2.0                               AXON 3.0
         Pre-2010                       2010-2019                            2020 & beyond

         Devices              Smart Devices + Workflow         Smart Devices + Workflow + Intelligence

                                                                                       TASER

                             TASER              EVIDENCE.COM
                                                                 BODY-WORN CAMERAS                    AXON FLEET

                                                                                      AXON CLOUD

       TASER
                                                                  EVIDENCE.COM                      AXON DISPATCH
                            BODY-WORN
                                                AXON FLEET                           AXON RECORDS
                             CAMERAS
                                                                           ACCELERATE JUSTICE

                                     CAPTURE TRUTH                           CAPTURE TRUTH

       PROTECT LIFE                   PROTECT LIFE                               PROTECT LIFE
                                                                                                           8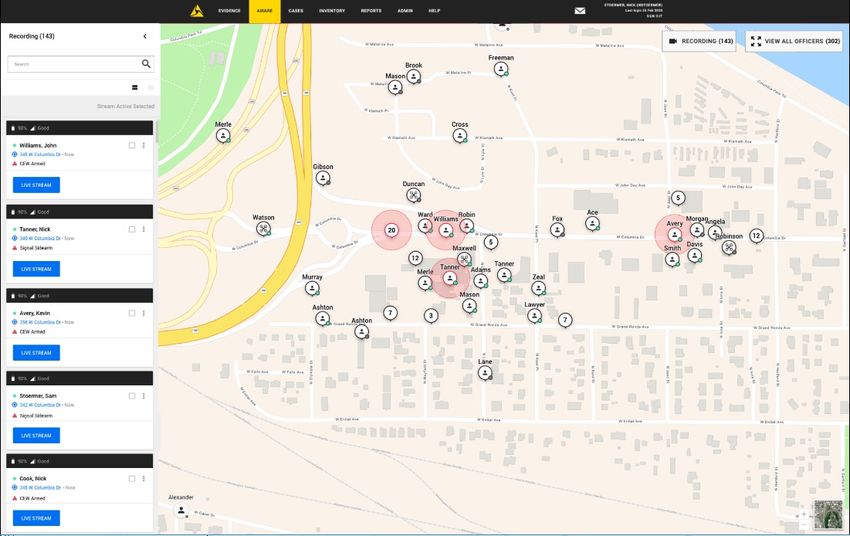
Large & growing TAM through value-added new products and markets

                                                                                                                                  $27B TAM
                                                                                                                                                   TAM by product
                                                                                                                                                        Axon Air
                                                                                                                                      Records             $1B
                  % of total TAM by market                                                                                                                                                       % of total TAM by geography
                                                                                                                                        $2B

                                                                                                                                 AR / VR                                                              Asia (ex. China)
                          Federal
                            6%
                                                                                                                                  $2B                                                                       7%
       Consumer
          7%                                                            Law                                                                                                             Middle East
                                                                    Enforcement                                                                                                            9%
                                                                                                           Consumer
                                                                        54%                                                                                                      South America
Enterprise                                                                                                Self-defense                                              BWC / DEMS
   8%                                                                                                                                                                                 4%
                                                                                                              $2B                                                      $11B
                                                                                                                                                                                                                               Domestic US
                                                                                                                                                                                                                                  59%
                                                                                                                        Dispatch                                                         EU
                                                                                                                                                                                        14%
                                                                                                                          $2B

 Corrections,                                                                                                                              Fleet
Fire, and Other                                                                                                                            $3B                                   Commonwealth
      24%
                                                                                                                                                           TASER                     7%
                                                                                                                                                            $5B

             AR / VR – augmented reality / virtual reality, BWC – body worn cameras, DEMS – digital evidence management system
             Note: TAM figures may not foot due to rounding , see appendix for sources and pricing                                                                                                                                9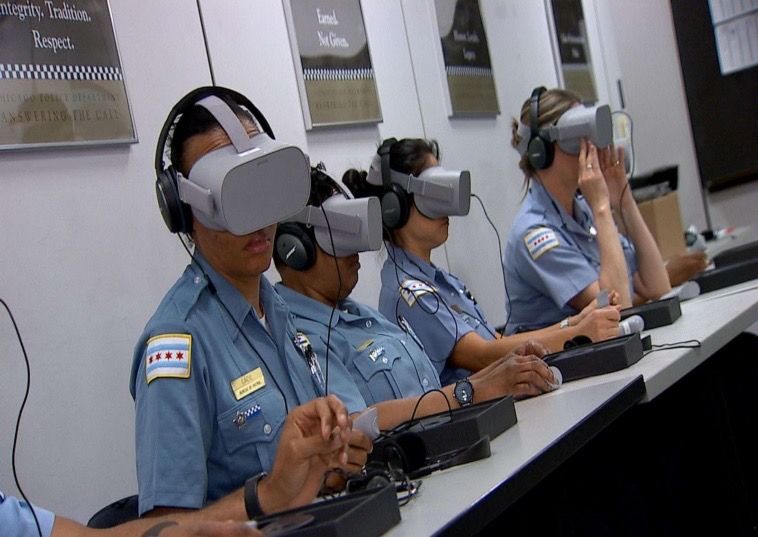
Growth drivers: Cloud-connected products and services
      Axon products are generally cloud-connected and sold via mutually reinforcing integrated bundles. Our key revenue drivers belong to three broad categories:

TASER                                                                                                                                                 Software
TASER devices                                                                                                                                         Digital evidence management
Virtual reality & training                                                                                                                            Productivity
De-escalation tools                                                                                                                                   Real-time Operations

                                                                                                                               Sensors
                                                                                                                               Body cameras
                                                                                                                               Fleet in-car cameras
                                                                                                                               Axon Air drones                         10
Products &
Bundles
Axon flywheel:
Build products and
bundles that give our
customers superpowers to
ensure everyone gets
home safe. This creates
more users (aka people)
and nodes (aka devices)
on the Axon network that Data & AI Superpowers
then creates more data
that we can unlock more
value from with machine
learning and AI. We use
that to create even more
great products and
bundles.
Users &
Nodes
11Growth driver: TASER & de-escalation has become eminent
TASER product leadership Expansion beyond public Expansion into new AR / VR
safety geographies
Numerous agencies adopted Recent wins include U.S. DoJ, EU, EMEA, South America, etc. AR / VR empathy training
cloud-connected TASER 7 DHS and Corrections delivered via Axon Cloud
12Growth driver: VR training helps with unbiased and empathetic public safety
13Growth driver: Cameras = transparency and trust
SIGNAL
APPS FLEX
SIDEARM
Axon Body 3
with LTE-live streaming and GPS
FLEET BODY began shipping Sep. 2019
Body camera programs address a transparency and accountability problem.
They create a giant data management and storage problem.
Axon’s camera + software solution solves all.
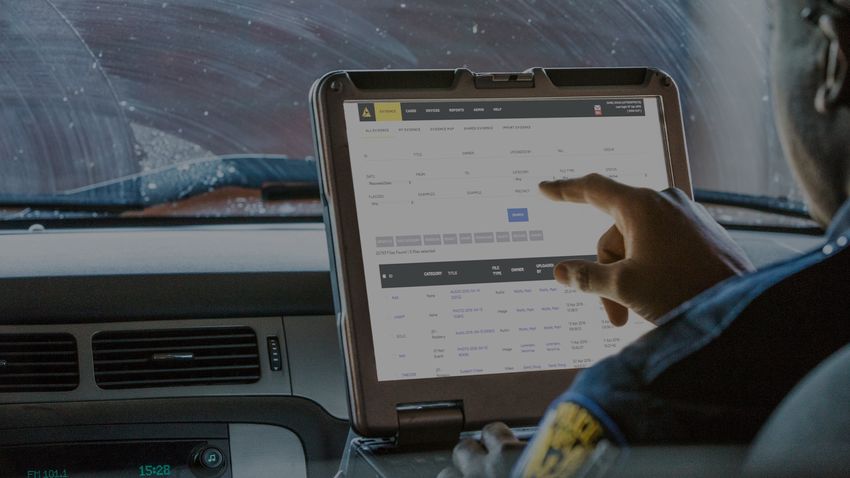
14Growth driver: Helping agencies manage digital evidence
Understand the major digital evidence
challenges Axon solves for agencies:
15
https://vimeo.com/427422866Growth driver: Productivity solutions to unlock efficiencies in public safety
Legacy
Citizen reporting stolen vehicle
Fragmented point solutions Cloud-based integrated software platform
Bloated and expensive Efficient and cost effective
Complex and stale UI Simple and consumer-grade UI
Slow, manual and reactive AI-driven proactive public safety
Note: Image on right is illustrative and represents Axon’s vision 16Growth driver: Real-time operations transforms communications beyond radios
Integrated public safety suite for Synchronized video
optimal visibility and control recording for all officers
on-site
Real-time view of officer
presence and devices
GPS enabled
heatmaps
LTE live streaming for
real-time situational
awareness
17The role of Axon’s strategic growth areas during a public safety incident
Time
Write
Citizen-
911 call and and file
captured Officer on scene Officer leaves incident Justice system
evidence dispatch More efficient Shorten
report
Axon software makes Axon’s dispatch solution A TASER device may or Axon body cameras and Fleet Axon Records incorporates Incident data and post-arrest
it easy to capture enables officers to arrive may not be deployed cameras capture video video into the incident log interview video are used and
digital evidence, knowing critical information when responding to an evidence, which is safely and uses AI to save viewed by prosecutors, defense
including CCTV video incident. If deployed, all stored in Evidence.com. Live- officers’ time. All use of attorneys, media, the community
and citizen mobile use of force data is streaming provides real-time force is tracked using Axon and the public
evidence logged in Evidence.com, situational awareness back to Standards software.
and real-time alerts are dispatch and command
sent back to dispatch and
command
18Video: How Axon products work together to empower public safety
https://vimeo.com/333871354
19
Note: Some technology shown is illustrative, representing Axon’s visionFINANCIAL OVERVIEW
20Powerful long-term growth engine
1 Strong growth and profitability at scale, early innings of global expansion
2 High visibility with significant revenue from recurring bundles
3 Strategic R&D driving to 70%+ target gross margins and robust operating leverage
4 Strong cash generation and abundant operating flexibility
21Strong growth with scaling profitability
Revenue Adjusted EBITDA
($ millions) ($ millions) 24%
23%
28% 22% 26% 28% 30%
17%
15%
% growth y/y $729 12%
$681 $172
$156
% margin
$531
$420 $88
$344
$61
$40
2017 2018 2019 2020 LTM
2017 2018 2019 2020 LTM Rule of 401 40 37 43 51 54
Note: Refer to shareholder letters, filed on SEC form 8-k, for non-GAAP reconciliations 22
1 Rule of 40 defined as revenue growth plus adjusted EBITDA marginHigh visibility with significant revenue from recurring bundles
SaaS Annual Recurring Revenue % Total Revenue Tied to Subscription Bundles
($ millions) (Non-subscription revenue tied to consumer, new & emerging markets)
$242
GR
CA $174
51%
$122
71% 73%
$83
55%
46%
$46
34%
Q1 17 Q1 18 Q1 19 Q1 20 Q1 21 2016 2017 2018 2019 2020
Note: Annual recurring revenue includes recurring license, integration, warranty and storage revenue. 23Strategic R&D driving to 70%+ target gross margins and robust operating leverage
Commitment to drive leverage
Growth R&D
x
TASER
2020 Gross Long-term
New margin target model
products
Real Time Records Air AR / VR
63% 70%
Operations
Software & Sensors
2020 Gross Long-term
Sustaining R&D Sales investment target model
margin
Existing
59% 70%
Enterprise Consumer
products
TASER Fleet BWC + Axon consolidated
Devices DEMS
2020 Adj EBITDA Long-term
Corrections Federal Fire EMS target model
margin
Existing New
23% 30%
customers customers
Note: Long-term targets exclude share-based compensation
Refer to appendix for Non-GAAP reconciliations
AR / VR – augmented reality / virtual reality
BWC – body worn cameras
24
DEMS – digital evidence management systemAxon’s path
BY 2030, WE BELIEVE
TASER will obsolete AI will eliminate Cloud & IoT will Axon will reimagine
the bullet paperwork transform public safety
communications
25Key Considerations
Powerful platform revolutionizing public safety and creating societal value
High-growth subscription revenue model with track record of significant operating leverage
Addressing a $27 billion market opportunity and millions of users globally
Holistic software / AI-based solution for public safety, from incident to judicial process
Management team with a proven track record of executing, unlocking new markets
26APPENDIX
27Strong, engaged independent board of directors
MICHAEL GARNREITER JULIE ANNE CULLIVAN HADI PARTOVI CAITLIN KALINOWSKI
Chairman of the Board Director Director Director
DR. RICHARD CARMONA ADRIANE BROWN DR. MATTHEW R. MCBRADY MARK W. KROLL, PH.D
Director Director Director Director
28
Note: Independent directorsAxon’s Independent AI and Policing Technology Ethics Board
DANIELLE MECOLE CHRISTY WAEL JEREMY CHRIS GILES
CITRON JORDAN LOPEZ ABD-ALMAGEED GILLULA HARRIS HERDALE
Cyber Civil Rights Initiative Police Reform Racial Equity DOJ Civil Rights USC, Researches debasing, EFF Texas Appleseed Independent Digital Investigation,
Professor at Boston University Community Leader Division deep fakes and digital forensics Google Social Justice Non-Profit Ethics Advisor
DR. REBEKAH MILES WARREN CHARLIE CARMEN BARRY
DELSOL BRUNDAGE STANLEY BECK BEST FRIEDMAN
Cyber Civil Rights Initiative AO Ethicist: Oxford’s Future of Retired California Highway Patrol Former Chief of Police for LAPD, Former Chief of Police for Seattle NYU The Policing Project
Professor at Boston University Humanity Institute & OpenAI Commissioner Former Interim Superintendent of Police
Chicago Police
29TAM Walk-up: User count x monthly pricing
LAW ENFORCEMENT ADJACENT MARKETS CONSUMER COMMERCIAL ENTERPRISE FEDERAL
USER CATEGORY Patrol Non-Patrol Non-Sworn Patrol Cars Drone Users Corrections Private Sec Fire/EMS Personal safety Constr/Infrstc Log/Wholesale Manufacturing Civilian LE Millitary LE Nat'l Grd Front Line Mil. ANNUAL TAM BY PRODUCT CATEGORY
USERS 665,280 85,060 325,714 410,000 140,000 453,900 1,126,370 665,712 20,000,000 2,535,680 2,182,000 1,696,800 162,000 90,706 50,000 168,592
DOMESTIC US
DE-ESCALATION $60 $60 $60 $60 $60 $60 $1.84b
VR/AR $18 $18 $9 $18 $18 $18 $18 $18 $18 $4 $2.7b
CONSUMER $8 $1.39b
CAMERA & SENSOR DEVICES $35 $35 $35 $35 $18 $18 $18 $35 $35 $35 $3.65b
FLEET DEVICES $70 $35 $42 $42 $1.02b
DIGITAL EVIDENCE MANAGEMENT $105 $105 $53 $105 $53 $105 $105 $105 $105 $1.56b
FLEET DIGITAL EVIDENCE MANAGEMENT $128 $128 $128 $1b
AXON AIR $150 $15 $30 $30 $0.46b
PRODUCTIVITY $65 $65 $65 $65 $65 $65 $0.74b
COMMUNICATIONS $50 $50 $50 $50 $50 $2b
ANNUAL TAM BY MARKET $2.65b $0.24b $0.49b $0.97b $0.25b $1.19b $2.23b $2.3b $2b $0.53b $1.38b $.36b $1.04b $0.58b $0.13b $0.09b $16B
LAW ENFORCEMENT ADJACENT COMMONWEALTH
Commonwealth ANNUAL TAM BY PRODUCT
USER CATEGORY Commonwealth EU Primary EU Remaining South America Middle East Asia (ex China) Corrections Private Sec Fire/EMS
Patrol Cars CATEGORY
Domestic US TAM - $16B
USERS 250,329 888,831 587,103 1,159,811 1,268,481 1,071,400 154,273 88,630 211,913 168,060
DE-ESCALATION $45 $45 $45 $45 $45 $45 $45 $45 $45 $3.08b International TAM - $11B
INTERNATIONAL
VR/AR $18 $18 $18 $18 $18 $18 $18 $18 $18 $18 $1.82b
CAMERA & SENSOR DEVICES $35 $35 $35 $35 $35 $35 $35 $0.13b
FLEET DEVICES
DIGITAL EVIDENCE MANAGEMENT $53 $53 $53 $53 $53
$70
$53 $26 $53
$2.79b
$0.11b
$27B TAM
FLEET DIGITAL EVIDENCE MANAGEMENT $59 $0.25b
AXON AIR $20 $20 $10 $10 $10 $1.14b
PRODUCTIVITY $50 $50 $0.64b
THREE STRATEGIC GROWTH CATEGORIES
COMMUNICATIONS $50 $50 $50 $50 $1.23b
TASER
Sensors
ANNUAL TAM BY MARKET $0.81b $2.35b $1.48b $1.01b $2.44b $1.93b $0.27b $0.16b $0.23b $0.50b $11B Software 30
Note: TAM figures may not foot due to rounding
Sources: U.S. Department of Justice (2008, 2011, 2016), U.S. Bureau of Justice Statistics (2020), U.S. Bureau of Labor Statistics (2020), U.S. Fire Administration (2020), U.S. Department of Homeland Security (2017), American School & University (2020), Australian Institute of
Criminology (2006), Federal Jobs (2015), Statistics Canada (2016), Statistics Canada (2018), Eurostat (2019), Interpol (2020), New Zealand Police Association (2016), Statista (2014), Wikipedia (2020), Understanding Italy (2020), Gov.UK (2020); TAM based on 2020 pricing.Officer Safety Plan 7+ Premium Integrated Bundle
Customer payment & cash flow =$239 / officer / month over 5 years + program startup fee
Illustrative GAAP revenue allocation per officer
$5,000 Axon Cloud software (Annual recurring revenue) Hardware warranty revenue
TASER cartridges & training revenue TASER hardware revenue
$4,500
Camera hardware revenue Customer payment / Cash flow
$4,000
$3,500
$3,000
$2,500
$2,000
$1,500
$1,000
$500
$0
Year 1 Year 2 Year 3 Year 4 Year 5 Year 6 Year 7 Year 8 Year 9 Year 10
TASER hardware revenue recurs every 5 years. Camera hardware revenue occurs every 2.5 years. >90% of cash flows are reoccurring. Chart assumes no upsell upon contract renewal for
illustrative purposes.
31Right-sized
& custom
bundles for
any agency
Based on 5-year pricing. TASER hardware revenue recurs every 5 years. Camera hardware revenue occurs every 2.5 years. >90% of cash flows are reoccurring.Non-GAAP reconciliation
Three months ended Twelve months ended
31-Mar-2021 31-Mar-2020 31-Dec-2020 31-Dec-2019 31-Dec-2018
EBITDA and Adjusted EBITDA
Net income (loss) $ (47,917) $ 4,074 $ (1,724) $ 882 $ 29,205
Depreciation and amortization 4,291 2,881 12,475 11,361 10,615
Interest expense 5 7 55 46 86
Investment interest income (533) (693) (4,086) (7,040) (3,002)
Provision for (benefit from) income taxes (1,760) (3,933) (4,567) 1,188 (1,101)
EBITDA $ (45,914) $ 2,336 $ 2,153 $ 6,437 $ 35,803
Adjustments
Stock-based compensation expense $ 89,610 $ 20,195 $ 133,572 $ 78,495 $ 21,879
Transaction costs related to strategic investments 385 833 1,032 – 1,382
Loss on disposal and abandonment of intangible assets 11 13 320 67 2,117
Loss on disposal and impairment of property and equipment, net 45 517 1,722 2,542 303
Costs related to FTC litigation 233 6,135 19,064 240 –
Payroll taxes related to XSPP vesting 1,452 – – – –
Unrealized net gain on strategic investment and warrants in
– – (2,055) – –
unconsolidated affiliate
Adjusted EBITDA $ 45,822 $ 30,029 $ 155,808 $ 87,781 $ 61,484
Adjusted EBITDA margin 23.5% 20.4% 22.9% 16.5% 14.6%
33You can also read