Epoch's Quarterly Capital Markets Outlook

Page created by Louis Page
 
CONTINUE READING
Epoch's Quarterly Capital Markets Outlook
Epoch’s Quarterly
                                                                                                        Capital Markets Outlook

                                                                                    WILLIAM W. PRIEST, CFA                KEVIN HEBNER, PhD                    RICK VANDALE, CFA
                                                                                    Executive Chairman                    Managing Director, Global            Managing Director, Global and
                                                                                    and Co-CIO                            Investment Strategist                U.S. Portfolio Management

Thursday, June 24, 2021 | The webinar replay will be available on our website: www.eipny.com

The information contained in this presentation is distributed for informational purposes only and should not be considered investment advice or a recommendation of any particular
security, strategy or investment product. Information contained herein has been obtained from sources believed to be reliable, but not guaranteed. The information contained in this
presentation is accurate as of the date submitted, but is subject to change. Any performance information referenced in this presentation represents past performance and is not
indicative of future returns. Any projections, targets, or estimates in this presentation are forward looking statements and are based on Epoch’s research, analysis, and assumptions
made by Epoch. There can be no assurances that such projections, targets, or estimates will occur and the actual results may be materially different. Other events which were not
taken into account in formulating such projections, targets, or estimates may occur and may significantly affect the returns or performance of any accounts and/or funds managed
by Epoch. To the extent this presentation contains information about specific companies or securities including whether they are profitable or not, they are being provided as a
means of illustrating our investment thesis. Past references to specific companies or securities are not a complete list of securities selected for clients and not all securities selected
for clients in the past year were profitable.
Epoch's Quarterly Capital Markets Outlook
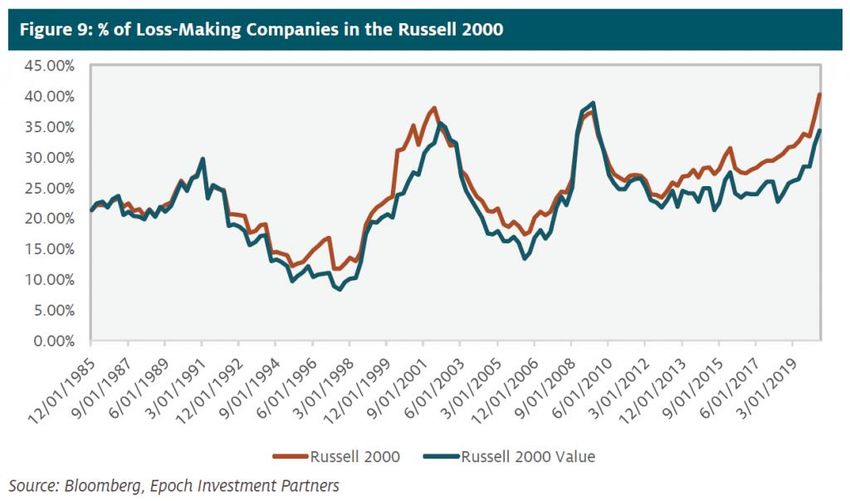
The Reopening Trade: Time to Favor Quality Growth?
Consumer: Key driver of economy well into 2022
•   $2 tn savings: Pent-up demand
•   Booming labor market: Rebound will take 2+ years
Shape of recovery: Does transitory mean 3 Qs or 3 years?
•   Labor market: Supplementary jobless benefits expire by Labor Day for 10+ mn
•   Commodities: Lumber prices won’t normalize until 2023+
•   Semiconductors: Major headwind for IP recovery, especially autos
•   Housing: Strong fundamentals, soaring prices
Key developments in H2: Good news already priced in?
•   “Infrastructure”: Base-case is $3.0 tn with $1.5 tn in tax offsets, over 10 years, via reconciliation
•   Employment & wage growth: Strong and, so far, no signs of accelerating wages
•   Corporate earnings: Solid outlook, but revisions may soon peak
Five major risks: Beyond the inflation obsession
•   COVID: Major risk in many EMs
•   Inflation: Risks are highest in decades
•   Taper tantrum: Does tapering mean hikes are imminent?
•   DC policies: Corporate tax hikes, antitrust (Lina Khan, FTC)
•   Valuations: Currently fair, conditional on low interest rates

                                                                                                            2
The Long Road Back to “Normal”: High Frequency, Micro Data
 Open Table reservations (% chg from 2019)                                              TSA # travelers (mn, 7dma)

           Almost back to “normal”;                                                                   Currently 12% below 2019 mean
            NYC & LA are lagging,
              Miami is booming

Google mobility: Retail & recreation activity                                           Apple: U.S. mobility tracker

                                                                                            Transit almost back to pre-COVID;
    3% below baseline (1/2020)
                                                                                                    Baseline 1/2020

                                    Source: Bloomberg, Open Table, TSA, Google, Apple                                                 3
Shape of Recovery: From Demand- to Supply-constrained
    There has never been a V-shaped recovery:
    # of months to return to peak employment
                                                  Every recovery since WWII: Same basic shape
                                                  • Months to return to pre-recession peak employment
                                                        o 2008: 75 mths
                                                        o 2001: 53 mths
                                                        o 1990: 37 mths
                                                  • We’re only 15 mths into this recovery!

                                                         Where did all the sawmills go?
                                                      Lumber prices: 3+ years to normalize
Source: Bloomberg, BLS

                                                Source: Bloomberg, CME                                  4
Celebrate Reopening: But Don’t Lose Sight of the Forever Virus
      Nowhere near herd immunity

                                      Vaccination rates are anything but uniform
                                      • 14 U.S. states have full vaccination rates < 40%

                                      Delta variant
                                      • Won’t be last mutation of genetically unstable virus

         Above global average                               Below global average

                                     Source (all three charts): Our World in Data
                                                                                               5
Will the Inflation Genie Escape?
      "The least responsible economic policy in 40 years." Larry Summers, Harvard
Tempting FAIT: Three elements of America’s risky experiment
1.   MMT/fiscal stimulus: To ensure “broad-based & inclusive” full employment
      • What is upper limit on fiscal policy? Only limiting principle is inflation
2.   Reopening + $2 tn consumer savings: “Roaring Twenties” redux?
      • From demand- to supply-constrained
3.   Monetary policy: Dual mandate reinterpreted, more tolerant of running hot
      • FAIT: Flexible Average Inflation Targeting
      • Jobs vs inflation
MMT: First ignored, then ridiculed and finally accepted
Old view: Economy typically operates near full employment
     • So fiscal stimulus is dangerous: Will crowd out private sector and spur inflation
New view: Economy almost always operates well below full employment
    • Fiscal stimulus is necessary: Inflation a remote risk, less costly than persistent unemployment
Why now? The dog didn’t bark
    • No inflation in spite of massive fiscal stimulus, ZIRP, and multiple rounds of QE

      “When it comes to the economy we’re building, rising wages aren’t a bug; they’re a feature.”
       — President Biden

                                                                                                        6
Fed Overestimating its Abilities to Fine-tune Economy
          Market suggests 40% chance CPI
          will exceed 3% over next 5 years
                                                  “Keeping emergency settings after the emergency
                                                  has passed carries bigger risks for the Fed than
                                                  missing its inflation target by a few decimal points.”
                                                   — Stanley Druckenmiller

                                                     Inflation soared from late-1960s, was
                                                   walloped by Volcker, has been stable since
                                                  Three distinct inflation regimes since 1960
Source: Bloomberg, Minneapolis Fed

 “We have the tools and the experience
 to gently guide inflation back to target.”
  — Lael Brainard, Fed Governor

                                              Source: Bloomberg, NBER                                7
How Likely is a Repeat of The Great Inflation?
   Shock therapy: Only way to slay inflation
                                                         The Great Inflation: Five key features
    once expectations become unanchored
                                                         1. Complacency: Following long period of
 Key events during Great Inflation of 1965-82               benign inflation (1953-65)
                                                         2. Accelerated govt spending (from 1964)
                                                         3. Fed prioritized jobs vs inflation (until ‘79)
                                                         4. Two OPEC supply shocks (9% of PCE)
                                                         5. Took many years: Multiple policy errors

                                                       The early-50s: A better historical analogy
                                                        GDP growth soared as Korean War
                                                     spending led to transitory burst of inflation

Source: Bloomberg, NBER, Minneapolis Fed

“In a rapidly changing world the opportunities
for making mistakes are legion.”
 — Arthur Burns, Fed chair, 1970-78

                                                 Source: Bloomberg, NBER, Minneapolis Fed                   8
Investors Took a Beating During Great Inflation of 1965-1982
  FIN likely to benefit from higher S-T inflation;
 underperformers include TECH, HLTH & CONS                         A little inflation: +’ve cyclical signal
                                                                   • But too much inflation is negative,
        Correlation between 2Y inflation
                                                                       signals end of cycle & recession
         breakeven and equity sectors
                                                                   Eight inflationary periods since 1925
                                                                   • Average real return: -7%
                                                                        o Non-inflationary periods: +10%

                                                                Equity markets typically tumble when
                                                                   L-T inflation expectations rise
                                                                 CORR with 5Y5Y inflation swap

Source: Bloomberg, Epoch Investment Partners

“For those who are quick to dismiss inflation, it is
worth remembering that it is a destructive force
… a genie that should be kept in the bottle.”
 — Aswath Damodaran, NYU

                                                       Source: Bloomberg, Epoch Investment Partners           9
Inflationary Pressures: Likely Transitory, but Risks Are Large
Four signals to watch
1.       5Y5Y: Currently 2.2% vs 2YBE of 2.7%
2.       Wages: Compositional effects, focus on ECI and Atlanta Fed
3.       Rents: Big weight in CPI & PCE, house prices booming
4.       Bottlenecks: Semis, lumber, autos,… (relative price changes  inflation)
     •        How long is transitory, 3Qs or 3Ys?

Two structural risks: Inflation is a policy choice
MMT: Keep pushing the envelope. The endgame for MMT is inflation.
          •      Divided govt is best insurance against inflation: 50 Senators not enough
Fed: Prioritizing jobs over price stability
          •      FRB has six members: Powell’s term ends in Feb, the two Vice Chairs before then

     "There are slippery slopes, and once you start a process of accelerating inflation there
     are precious few examples of where inflation has been brought back down without very
     substantial economic disruption and without enormous disruption to financial markets.”
      — Larry Summers, Harvard

                                                                                                   10
The Fed’s Next Policy Action: A Taper Tantrum is Unlikely This Time
     Tapering to be announced in Q3                     Tapering doesn’t mean hikes are imminent
           Commencing in Q4,
            initially with MBS

     10Y yield: Round trip in 2013-14                   Equities performed well despite the tantrum

           Tantrum

          Source for all charts: Bloomberg, FRB, NBER
                                                                                                 11
A Second Likely Policy Action: Higher Corporate Taxes
 Proposed corporate tax: From 21% to 28%
                                           Tax hike to 28%: Mild headwind for EPS
                                           • Hit to SPX EPS of 5% to 8% in 2022
                                                 o Higher in tech & healthcare
                                           • Consensus: 25% is more likely than 28%

                                           Global minimum tax
                                           • US corporate profits booked in tax havens
                                                 o 5% of foreign profits in 1965, 60% today
                                           • Will mainly affect 45 companies
                                                 o Mostly in tech & healthcare
Source: U.S. Treasury Department

          Corporate tax share: Shrinking      Corp tax receipts, select countries (% GDP)

                   Source: Bloomberg         Source: U.S. Treasury Department, "The Made in America Tax Plan"
                                                                                                                12
Value vs Growth: SVX Usually Outperforms Early Cycle
       Twenty-five-year perspective                                            Performance during pandemic: Three phases

   Value typically performs with real yields                                    Both SVX & SGX trading close to fair value

                                 Correlation: 80%

                                                                                                 SGX’s earnings & CF growth
                                                                                                  has been much stronger

           Source for all charts: Bloomberg, Epoch Investment Partners, NBER
                                                                                                                              13
Equity Market: Fairly-Valued, Conditional on Bond Yields
                                                                                SPX: EPS with consensus forecasts
Earnings growth                                                                              Consensus
• Strong rebound: Already priced in?                                                         2019-21: 11% (annualized)
                                                                                               2022: 12%
                                                                                               2023:   6%
Valuations
• Neutral-ish: Assuming lower for longer rates

Speculative excesses abound
• Reflecting excessive liquidity, “free” money

          If interest rates stay near current range, equity markets appear fairly-valued

            Source (all 3 charts): Bloomberg, Epoch Investment Partners, NBER
                                                                                                                         14
America’s Risky Economic Experiment: Investment Conclusions
1. Strongest GDP Growth Since 1984: Consumer-driven
•   Supportive policy: But both fiscal & monetary impulses have peaked
•   Reopening + massive savings: Strongest rebound in service sectors

2.   Market Risks
•    COVID: The forever virus, especially EMs
•    Inflation: Likely transitory, but watch for wage-price spiral
•    Taper tantrum: Tapering  imminent hikes
•    DC policies: Corporate tax hikes, antitrust
•    Valuations: Fair, provided rates stay low & FCF meets high expectations

3. Portfolio Positioning as Re-opening Trade Matures
•   Quality growth: Sustainable FCF growth
•   Capital allocation: Especially important as CF recovers
•   Global Champions: Winner-takes-most economy

4. What is Your Business Strategy for the Digital Age?
• We remain focused upon firms with resilient business models and strong FCF growth
      o We look for a demonstrated ability to allocate that CF effectively between return of capital
          options and reinvestment/acquisition opportunities
• It is imperative that companies successfully implement a business strategy for the Digital Age
      o Especially favors companies in tech, healthcare, and communication sectors

                                                                                                       15
The COVID-19 Crisis Created a Historic Opportunity

Opportunity to buy companies in the U.S. Small Cap universe at very
reasonable prices.

          R2000 (Small Cap) vs. R1000 (Large Cap)
          Performance as of September 30, 2020
                                    20%

                                    15%

                                    10%

                                     5%

                                     0%

                                    -5%

                                   -10%
                                                     QTD                YTD    1 Year   3 Year   5 Year   10 Year

         ◼ Russell 2000                               4.9               -8.7    0.4      1.8      8.0       9.9

         ◼ Russell 1000                               9.5               6.4    16.0     12.4     14.1      13.8

                         Small Cap underperform Large Cap across all time periods depicted.
Source: Epoch Investment Partners; Frank Russell Company ("Russell").

                                                                                                                    16
Small Caps Outperforming Large Caps Since Vaccine Breakthrough

        R2000 (Small Cap) vs. R1000 (Large Cap)
        Performance as of June 18, 2021

          60.0
                                                                                                      49.8
          50.0

          40.0
                             31.4
          30.0                                                                                               27.7

          20.0
                                       13.7                     12.7
          10.0                                                          5.9                 5.2
                                                                                      1.0
            0.0
                               4Q 2020                            1Q 2021             2Q 2021     9/30/2020-6/18/2021

                                                                          R2000   R1000

Source: Epoch Investment Partners; Frank Russell Company ("Russell").

                                                                                                                        17
Window of Opportunity Remains Open for Small Caps

Historically, small caps have been one of the best performing asset classes following a
sharp decline in the market.
                                              25 Worst Rolling Quarter Small Cap Returns Since 1926
                       50%
                                                        37.8%
                       40%
                       30%
                                                   20.8%
                       20%                                                                   15.2%
                                                                            12.5%                             10.7%
                                                                        6.9%             8.2%             5.8%
                       10%
                        0%
                      -10%
                      -20%
                      -30%     -23.6%
                      -40%           -34.6%
                      -50%
                              Trailing Quarter    1 Year Return        3 Year Return    5 Year Return   10 Year Return

                                                           Large Cap     Small Cap

                                           Period ending March 31, 2020                QTD Return
                                           Russell 2000 Index (small cap)                 -30.6

                                           Russell 1000 Index (large cap)                 -20.2
Source: Ibbotson Associates

                                                                                                                         18
Window of Opportunity Remains Open for Small Caps

Historically, small caps have performed better in higher GDP environments.

Small cap sales, earnings, and cash flows are levered to better economic U.S. growth and when
U.S. GDP grows quickly, especially well above 2%, small caps tend to perform much better.

                                            Russell 2000 Returns During Different GDP Environments

                                                                                              Average Return    Median Return
                          Real GDP Range                           # Instances
                                                                                               (Current year)   (Current Year)

                          0 – 2%                                            7                     2.4%            -1.6%

                          2 – 4%                                          18                     13.0%            16.3%

                          > 4%                                              9                    12.7%            21.3%

                        US Real GDP Growth                                         2020               2021(E)       2022 (E)

                                                                                     -3.5                 6.4           3.5

Source: eVestment – https://www.macrotrends.net/countries/USA/united-states/gdp-growth-rate

                                                                                                                                 19
Window of Opportunity Remains Open for Small Caps

Small cap fundamentals look superior to large caps

                    Expected Sales Growth                               Expected Earnings Growth
 14.0                                                          120
                 13.0

                                                                     101.8
 12.0
                          10.8                                 100

 10.0
                                                                80
  8.0                                           7.3
                                                       6.4
                                                                60            53.0
  6.0

  4.0                                                           40
                                                                                                  31.5

  2.0
                                                                20
                                                                                                              8.7
  0.0
                    2021E                         2022E
                                                                 0
                                                                         2021E                        2022E

             R2000 (Small Caps)         S&P 500 (Large Caps)         R2000 (Small Caps)   S&P 500 (Large Caps)

Source: Epoch Investment Partners; FactSet

                                                                                                                    20
Window of Opportunity Remains Open for Small Caps

Small cap relative valuations remain near all time lows

                                                     R2 ex. Biopharma / SP5, Relative P/E
 180%                                                                                                                                                        180%

 170%                                                                                                                                                        170%

 160%                                                                                                                                                        160%

 150%                                                                                                                                                        150%

 140%                                                                                                                                                        140%

 130%                                                                                                                                                        130%

 120%                                                                                                                                                        120%

 110%                                                                                                                                                        110%

 100%                                                                                                                                                        100%

   90%                                                                                                                                                       90%
              2002
                      2003
                              2004
                                      2005
                                             2006
                                                    2007
                                                           2008
                                                                  2009
                                                                         2010
                                                                                2011
                                                                                       2012
                                                                                              2013
                                                                                                     2014
                                                                                                            2015
                                                                                                                   2016
                                                                                                                          2017
                                                                                                                                 2018
                                                                                                                                        2019
                                                                                                                                               2020
                                                                                                                                                      2021
                                                                                 NTM            FY2

Source: Fury Research Partners, FactSet.

                                                                                                                                                                    21
Window of Opportunity Remains Open for Small Caps

Small cap flows could prove favorable

                                                              Small-Cap Flow s
                 In millions of dollars

      10000

      -30000

      -70000

    -110000

    -150000
          Dec-03      Jun-05   Dec-06     Jun-08   Dec-09   Jun-11   Dec-12      Jun-14   Dec-15   Jun-17   Dec-18   Jun-20

The Nasdaq 100’s market capitalization is $14.8 trillion versus $1.2 trillion for the S&P Small-Cap 600.

Source: EPFR; Jefferies

                                                                                                                              22
What's Driving the Rally in Small Caps?

To date lower quality companies have led the rally in small cap equities accentuated by the
wild speculation in "Meme" stocks.

                  S&P SmallCap                S&P SmallCap            S&P 600 SmallCap Low Quality versus High
                  600 Quality –               600 Quality -                        Quality Index
                  Highest Quintile            Lowest Quintile
                                                                160
                  Index (USD)                 Index (USD)
                                                                150
 YTD                    11.5%                       39.5%
                                                                140

                                                                130

                                                                120

                                                                110

                                                                100

                                                                        S&P SmallCap 600 Quality
                                                                        S&P SmallCap 600 Quality - Lowest Quintile Index (USD)

Source: S&P Dow Jones Indices LLC. As of June 18, 2021

                                                                                                                                 23
What's Driving the Rally in Small Caps?

Beware the "Meme" stocks
Definition:
A meme stock is a stock that has seen an increase in volume and stock price, not because of the
company’s performance, but rather because of hype on social media and online forums. For this reason,
these stocks often become overvalued, seeing drastic price increases in just a short amount of time.

                                                                      YTD Return                 ROE 5-Year Avg

                                GameStop Corp                       1,252.7%                       -22.1%
                                AMC                                 2,357.7%                       -97.8%

                               500%
                                               424%                  R2V Total Return
                               400%

                               300%

                               200%
                                                       100%
                               100%
                                                                           28.8%                    31.5%
                                                                                    7.1%                    8.6%
                                  0%
                                              Meme Stocks                   Other Stocks               Index

                                                                           YTD       QTD
Source: FRP, FactSet; as of 6/9/21; Meme stocks are AMC, BBBY, CLNE, EXPR, GME, GEO, and WKHS.

                                                                                                                   24
Advocating a High-Quality Approach

High and low FCF Yield and ROE quintiles indexed to 100 (last 35 years)

                 CAGR 1986-2020 (35 Years)                                                       CAGR 1986-2020 (35 Years)

                 HIGH FCF YIELD (Q1) RUSSELL 2000                           15.1%                HIGH ROE (Q1) RUSSELL 2000            11.5%

                 LOW FCF YIELD (Q5) RUSSELL 2000                            -0.7%                LOW ROE (Q5) RUSSELL 2000                  0.4%

                 RUSSELL 2000 VALUE                                         10.2%                RUSSELL 2000 VALUE                    10.2%

                 RUSSELL 2000                                               9.7%                 RUSSELL 2000                               9.7%
 16,000                                                                                5,000
                                                                              13,554                                                               4,566
 14,000                                                                                4,500

                                                                                       4,000
 12,000
                                                                                       3,500
 10,000                                                                                                                                            2,969
                                                                                       3,000
                                                                                                                                                   2,553
  8,000                                                                                2,500

                                                                                       2,000
  6,000
                                                                                       1,500
  4,000                                                                        2,969
                                                                                       1,000
  2,000                                                                        2,553    500
               100
                                                                                               100                                                  117
                                                                                 78
       -                                                                                  -

                                                                                                     High ROE (Q1)     Russell 2000 Value
                      High FCF Yield (Q1)              Russell 2000V
                                                                                                     Russell 2000      Low ROE (Q5)
                      Russell 2000                     Low FCF Yield (Q5)
As of December 31, 2020
Source: Russell, Jeffries, Epoch Investment Partners

                                                                                                                                                       25
Advocating a High-Quality Approach

High quality small caps are as cheap as they ever have been.

                                      R2 Relative Median P/E (High Quality vs. Low Quality)
 120%                                                                                                                                                         120%

 100%                                                                                                                                                         100%

   80%                                                                                                                                                        80%

   60%                                                                                                                                                        60%

   40%                                                                                                                                                        40%

   20%                                                                                                                                                        20%

      0%                                                                                                                                                      0%
              2002
                       2003
                               2004
                                       2005
                                              2006
                                                     2007
                                                            2008
                                                                   2009
                                                                          2010
                                                                                 2011
                                                                                        2012
                                                                                               2013
                                                                                                      2014
                                                                                                             2015
                                                                                                                    2016
                                                                                                                           2017
                                                                                                                                  2018
                                                                                                                                         2019
                                                                                                                                                2020
                                                                                                                                                       2021
                                                                                 NTM             FY2

Source: Fury Research Partners, FactSet.

                                                                                                                                                                    26
Advocating a High-Quality Approach

Quality lags off bear market bottoms and then recovers

                                           R2 High Quality / R2, Relative Index, Monthly
                                                     1.05

                                                     1.00

                                                     0.95

                                                     0.90

                                                     0.85
  -8
  -6
  -4
  -2
   0
 -24
 -22
 -20
 -18
 -16
 -14
 -12
 -10

  +2
  +4
  +6
  +8
 +10
 +12
 +14
 +16
 +18
 +20
 +22
 +24
 +26
 +28
 +30
 +32
 +34
 +36
                                           Months Before/After Market Trough (0 = Trough Month)

                                                       Feb-03      Feb-09     Mar-20

Source: Fury Research Partners, FactSet.

                                                                                                  27
Advocating a High-Quality Approach

Passive solutions lead to large exposures in loss-making companies

                                                                     28
The Small Cap Opportunity from Our Perspective

▪ Small Caps had underperformed Large Caps for almost a decade.
▪ The onset of the pandemic accelerated this trend, providing an attractive
  opportunity.
▪ While Small Caps have outperformed Large Caps since 3Q 2020, the
  window on the Small Cap opportunity has not closed in our opinion.
▪ We advocate taking a high-quality approach to Small Cap investing based on
  superior fundamentals and historical precedent.
▪ We also advocate an active versus passive approach due to the index's large
  exposure to loss-making companies.

                                                                               29
Epoch Thought Leadership

RECENT PUBLICATIONS AND WHITE PAPERS

           Podcast – Actively Speaking                               Moore’s Law & the Race for the
           Our latest releases:                                      Rest of the Chessboard
           Jun. 16, 2021                                             The Cambrian explosion of breakthroughs in AI,
           Will the Inflation Genie Escape                           autonomous driving, 5G, and cloud computing will
                                                                     drive double-digit growth in semiconductor
           May 27, 2021
                                                                     revenues for the foreseeable future. Superstar
           Money 3.0: Central Bank Digital Currencies
                                                                     firms have come to dominate all subsectors of the
           (CBDC)
                                                                     increasingly concentrated semiconductor industry.

           America’s Risky Experiment: Will the                      The Epoch Core Model:
           Inflation Genie Escape?                                   Our Proprietary Stock Model
           Inflation risks are at a four-decade high due to          More than just our proprietary stock selection
           today’s combination of a generous Treasury, an            model, the Epoch Core Model (ECM) is a
           overly tolerant Fed, and a reopening economy.             rules-based expression of Epoch’s free cash
           Investors should brace themselves for more                flow investment philosophy. Learn about its
           inflation scares, which will likely remain a key driver   components and how it’s being used to
           of equity markets well into 2022.                         enhance the firm’s investment processes
                                                                     across strategies.

           Money 3.0: Central Bank Digital                           Winning at Active Management
           Currencies (CBDC)                                         Authored by three Epoch portfolio managers,
           During the past two years, CBDC has progressed            the book examines the issues facing the
           from a bold speculative concept to a seeming              investment management industry and
           inevitability and core feature of our financial           explores the essential roles of culture,
           ecosystem. This paper explores the implications for       philosophy and technology.
           monetary policy, the FinTech and payments sectors,
           and the potential disintermediation of significant
           swaths of the commercial banking system.

                                                                                                                      30
You can also read