Big shed briefing - Savills
←
→
Page content transcription
If your browser does not render page correctly, please read the page content below
UK Logistics – July 2021

    S P OT L I G H T
     Savills Research
                                         Big shed briefing

EMDC 525 where Panattoni and AEW, advised by Savills, have leased 523,404 sq ft to Buy it Direct

        H1 take-up 82% above long-term average                      Vacancy at 4.37%           Supply falls at fastest pace ever
UK logistics: Big shed briefing
H1 2021 take-up above
82% long-term average
Nationwide overview
Record levels of take-up and supply falling at its fastest ever rate
back to 22% of the market, down from 44% of the market in 2020. In their place, demand
for units between 100,000 and 200,000 sq ft has increased, accounting for 36% of the
market, up from 27% in 2020. In the most part this has been driven by online retailers
taking smaller parcel delivery style units, the sector alone has taken 2.8m sq ft of units
under 200,000 sq ft in 2021. Given the number of large requirements in the market, we
expect that the full-year figures will see this balance shift. Take-up from manufacturers
Richard Sullivan
has also risen, to account for 15% of take-up, up from 8% in 2020, correlating with recent
National Head DIRFT: Prologis have bought back the
of Industrial & Logistics
notes from the ONS which show that manufacturing is increasing its share of UK GDP.
404,000 sq ft former Arcadia unit and
020 7409 8125 leased to Boohoo
rsullivan@savills.com Supply and Pipeline
Given the strong levels of take-up, supply has fallen at its fastest pace ever and now
As 2021 has progressed, it would seem that not a day goes stands at 25.08m sq ft, a fall of 6.93m sq ft since the start of the year. This fall in supply
by without reading another news story that relates back means that, at a nationwide level, vacancy now stands at 4.37%, the lowest level since
to the logistics sector. The property press continues to Savills started recording the metric, and a fall of 221 bps in 12 months. Grade A supply
report information on new occupier requirements and now stands at 6.91m sq ft, again the lowest level we have ever recorded.
transactions, which in turn creates opportunities for We are currently tracking 16.79m sq ft of speculative development which will add
investors to deploy capital in the sector. In the wider market, much-needed supply given the current levels of take-up and requirements.
issues remain about the availability of labour, with HGV
Take-up strongest H1 performance ever recorded
drivers in particular currently being in short supply, and
macro events such as the recent incident in the Suez Canal
have shone a light on the fragility of global supply chains. 60
These macro events are reinforcing the view that, in the
medium term, supply chains will shift from operating ‘just in 50
time’ to a ‘just in case’ model. Essentially this means holding
more inventory than has previously been considered normal, 40
which in turn means having access to more warehouse
Sq ft (millions)
space. 30
Away from wider supply chain issues, online retail
continues to play an important role in the continued health 20
of the sector. Forecasts from Forrester suggest that, whilst
fluctuations in the level of online retail should be expected as 10
life returns to normal, overall, the pandemic has accelerated
the growth that we were already experiencing. With 0
Forrester suggesting that online retail will reach 37% of all 2007 2008 2009 2010 2011 2012 2013 2014 2015 2016 2017 2018 2019 2020 2021
retail sales by 2025, up from 20% before the pandemic, it is Q1 Q2 Q3 Q4 Long-term H1 average
clear that more warehouse space will be required.
Over the next 18-24 months, however, the key issue will Source Savills Research
be one of warehouse supply. The availability of construction
materials - an issue which we explore in more detail on Supply fastest decline in availability ever recorded
the last page of this report - will mean that the pace of
delivery for new speculative supply will not be able to keep 40 Supply Grade A proportion 60%
up with demand. This could cause a bottle-neck effect as
occupiers consider their options when looking to satisfy new 35
50%
requirements. 30
Grade A as a proportion of total stock
40%
Take-up
Supply (sq ft millions)
25
At the halfway point of 2021, 24.41m sq ft of warehouse
20 30%
space has been transacted, setting a new H1 take-up
record in the process, 82% above the long-term H1 average 15
of 13.4m sq ft. Examining the take-up trends in further
20%
detail shows some interesting trends which demonstrate 10
a resilience and strength in the market, which may counter 5
10%
historical perceptions. Firstly, we have logged 107 separate
transactions so far this year, which against the annual 0
Q1 Q2 Q3 Q4 Q1 Q2 Q3 Q4 Q1 Q2 Q3 Q4 Q1 Q2 Q3 Q4 Q1 Q2 Q3 Q4 Q1 Q2 Q3 Q4 Q1 Q2 Q3
0%
average of 113 transactions per year shows just how active the
2015 2015 2015 2015 2016 2016 2016 2016 2017 2017 2017 2017 2018 2018 2018 2018 2019 2019 2019 2019 2020 2020 2020 2020 2021 2021 2021
market is. Also, take-up for units over 500,000 sq ft has fallen
Source Savills Research
savills.com/research 2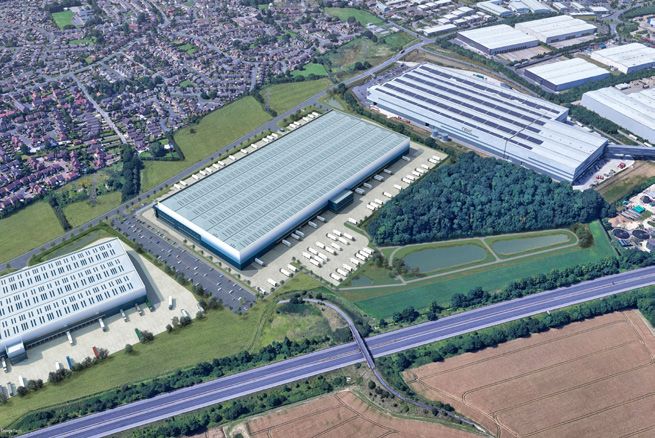
UK logistics: Big shed briefing
H1 2021 take-up has reached 2.65m sq ft. We’re
currently tracking another 3.78m sq ft, which is due
to complete in Q3 2021. It’s set to be another strong
year
London and the South East
Vacancy rate remains constrained at 3.95%
Didcot Quarter, where Savills IM, Take-up
advised by Savills, has leased 121,464 sq H1 2021 take-up totalled 2.65m sq ft, in line with the long-term H1 average.
ft to Simon Hegele Savills is currently tracking c. 900,000 sq ft of existing supply which is under
offer, along with c. 2.89m sq ft of bespoke built-to-suit space due to exchange
imminently.
Occupier preference continues to lean towards high-quality Grade A space
Toby Green
accounting for 80% of all take-up, of that 37% is built to suit, 36% speculatative
Director
South East
development and 27% Grade A second-hand units. In terms of sq ft transacted,
020 7409 9903 the region shows a decline on the level of activity seen in 2020 which was inflated
tgreen@savills.com by the 2.3 million sq ft Amazon deal in Dartford. It’s important to look at activity
Supply in terms of deal count: H1 2021 saw 18 separate transactions, an 100% increase on
The level of supply has remained broadly H1 2020, demonstrating a high level of occupier activity. The deals were centred
stable over the last year. Currently, supply around the smaller size bands: 89% by deal count were within the 100,000-
is 4.87m sq ft across 33 units, which reflects 200,000 sq ft size band and the remaining 11% were within the 200,000-
a vacancy rate of 3.95%. This is the fourth 300,000 sq ft size band. There have been no deals this year above 300,000 sq ft.
lowest vacancy out of the regions. Savills has continued to see a rise in occupier activity from the Data Centre
Occupier preference towards better quality and Film sectors, together they have accounted for 36% of the total take-up, an
units in the past year has caused a shift in increase from 10% in 2020 and compares with a long-term average of 17%.
the quality balance of the available stock.
Now, 41% of the supply is classified as Grade Development Pipeline
A compared to 71% last year. Smaller units There are now 30 units under construction totalling 5.32m sq ft, a 250% rise from this time
make up the majority of the available stock last year. This includes some larger units such as the 450,000 sq ft Powerhouse 450 at The
- by unit count, 90% are within the 100,000- Bridge Dartford and the 338,267 sq ft uni at Purfleet Commercial Park. There are 22 spread
200,000 sq ft size band, 4% within the within the South East totalling 3.72m sq ft with an average size of 168,917 sq ft and eight
200,000-300,000 sq ft band and 6% in the within the Inner M25 totalling 1.6m sq ft averaging 200,361 sq ft.
300,000-400,000 sq ft size band. The largest
unit on the market is Panattoni Park Luton Take-up H1 in line with long-term average
346, providing 346,132 sq ft of speculatively 500,000 sq ft+
300-400,000 sq ft
400-500,000 sq ft
200-300,000 sq ft
10
developed space. 100-200,000 sq ft Rolling Average - 5 Year
9
Closer analysis shows that 38% of the
8
supply sits in more peripheral locations. It
7
should also be noted that 27% of the total
Sq ft (millions)
6
supply is located in the Inner M25, meaning
5
that just 1.97m sq ft of supply is in core South
4
East locations.
3
2
Key statistics 1
Stats yr/yr change 0
2007 2008 2009 2010 2011 2012 2013 2014 2015 2016 2017 2018 2019 2020 2021
Source Savills Research
Take-up
2.65m sq ft 42% Supply dominated by smaller-sized units
500,000 sq ft+ 400-500,000 sq ft
300-400,000 sq ft 200-300,000 sq ft
Supply 8
100-200,000 sq ft
4.87m sq ft 3.7% 7
6
Development
5.32m sq ft
5
Pipeline
Sq ft (millions)
250%
4
Quoting
£8.00- 3
Grade A Rent
£22.00/sq ft 10% 2
1
Vacancy rate
3.95% 1 bps 0
Q1 Q2 Q3 Q4 Q1 Q2 Q3 Q4 Q1 Q2 Q3 Q4 Q1 Q2 Q3 Q4 Q1 Q2 Q3 Q4 Q1 Q2 Q3 Q4 Q1 Q2 Q3
2015 2015 2015 2015 2016 2016 2016 2016 2017 2017 2017 2017 2018 2018 2018 2018 2019 2019 2019 2019 2020 2020 2020 2020 2021 2021 2021
Source Savills Research Source Savills Research
3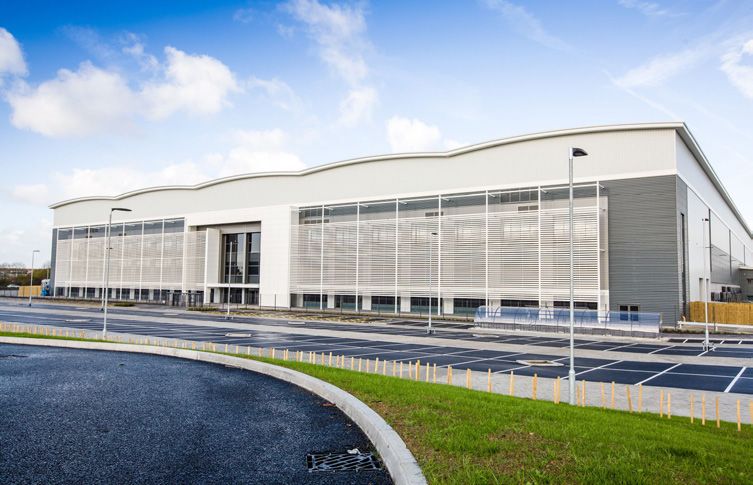
UK logistics: Big shed briefing
H1 2021 has been another strong year for take-up,
reaching 5.08m sq ft. Supply is now chronically
low at 3.42m sq ft, pushing the vacancy rate to the
lowest on record at 2.98%. Rents are set to increase
substantially
East Midlands
Strong levels of take-up leaves just 0.34 years of supply
EMG 220, where SEGRO are Take-up
speculatively developing a 220,000 sq H1 2021 take-up has reached 5.08m sq ft across 20
ft unit which will PC in October separate transactions, with demand coming from a
diverse range of occupiers, up 113% on the long-term
H1 average.
Occupier preference continues to revolve
Charles Spicer
around better quality units. In 2021, 81% of space
Director
Birmingham
transacted has been Grade A, with the remaining
0121 6348 407 being Grade B space. In terms of specification, 57%
caspicer@savills.com of space transacted has been second-hand space, 33%
speculatively developed space, with the remaining
Supply being built-to-suit space.
The supply of units over 100,000 sq ft has In terms of deal count, 50% have been within
rapidly declined in the past year, standing at the 100,000-200,000 sq ft size band, 20% within
3.42m sq ft across 17 separate units. This has the 200,000-300,000 sq ft band, with the balance
pushed the vacancy rate to the lowest level for larger units. Savills has seen an uptick in
on record at 2.98%, leaving just 0.34 years’ requirements for larger units in 2021 which should
worth of supply in the region. Moreover, mean the average size deal continues to increase from
Savills is aware that c. 900,000 sq ft of the its current level of 254,000 sq ft.
vacant supply is currently under offer, set to
exchange in Q3 2021. This will compress the Development Pipeline
supply and vacancy rate further, pushing There are currently 14 units under construction,
rental growth in the process. which total 3.43m sq ft. Pleasingly, 57% of these units
The largest unit on the market is Magna are over 200,000 sq ft, which should help cater for
Park Lutterworth South 1 comprising the larger requirements in the market.
c.750,000 sq ft - it’s currently under offer due
to exchange in Q3 2021. Take-up H1 is 113% above the long-term H1 average
The current supply is skewed towards 14 Q4
Q3
smaller-sized units with 82% by unit count 12
Q2
being within the 100,000-200,000 sq ft Q1
Rolling Average - 5 years
size band. Above 200,000 sq ft, there are 10
only three units on the market, meaning
Sq ft (millions)
8
that occupiers will increasingly be pushed
to examine BTS options to satisfy such 6
requirements.
4
2
Key statistics
Stats yr/yr change 0
2007 2008 2009 2010 2011 2012 2013 2014 2015 2016 2017 2018 2019 2020 2021
Source Savills Research
Take-up
5.08m sq ft 10% Supply has fallen 54% in last year, vacancy at 2.98%
500,000 sq ft+
9 400-500,000 sq ft
Supply 300-400,000 sq ft
3.42m sq ft 54%
8 200-300,000 sq ft
100-200,000 sq ft
7
Development 6
Sq ft (millions)
Pipeline 3.43m sq ft 193% 5
4
Quoting
Grade A Rent £7.50/sq ft
3
11% 2
Vacancy rate 1
2.98% 347 bps 0
Q1 Q2 Q3 Q4 Q1 Q2 Q3 Q4 Q1 Q2 Q3 Q4 Q1 Q2 Q3 Q4 Q1 Q2 Q3 Q4 Q1 Q2 Q3 Q4 Q1 Q2 Q3
2015 2015 2015 2015 2016 2016 2016 2016 2017 2017 2017 2017 2018 2018 2018 2018 2019 2019 2019 2019 2020 2020 2020 2020 2021 2021 2021
Source Savills Research Source Savills Research
savills.com/research 4
UK logistics: Big shed briefing
Take-up has rebounded strongly reaching 3.75m sq ft
through 21 seperate transactions, it’s the second best H1
on record. Given that just 20% of our supply is Grade A,
the 1.86m sq ft of speculative pipeline will be welcomed
by occupiers
West Midlands
Vacancy rate now 5.03%, down from 10.31% a year ago
Parallel 113, Darlaston Road, where 474,591 sq ft of Grade B second-hane space.
St Francis Group are speculatively The shortage of vacant stock is reducing the incentives offered with
developing a unit of 113,000 sq ft transactions whilst pushing on rental growth. With the current supply
and demand dynamics, we predict rental growth will exceed the 2.2% p.a
forecast by RealFor in the next five years.
Ranjit Gill
Take-up
Director
Birmingham
Take-up in H1 2021 reached 3.75m sq ft across 21 separate transactions.
0121 634 8402 Historically, demand has centred around the manufacturing and
rsgill@savills.com automotive sectors; however, we are now seeing a rapid uptick in activity
from other occupiers. In 2021, 47% of activity has come from 3PLs, 30%
Supply from online retailers and the remainder spread over other sectors - a
The level of supply within the region currently positive indicator for the market.
stands at 4.31m sq ft across 23 separate units, Occupier preference has revolved around Grade A space, accounting
a 50% decrease from this time last year. for 85% of space transacted in the region. Grade B space accounted for
According to the average annual take-up, 8% of all space transacted, whilst 7% was Grade C. Activity continues to
there is now just 0.91 years’ worth of supply revolve around smaller-sized units - by deal count, 71% were within the
in the region. 100,000-200,000 sq ft size band, and 14% within the 200,000-300,000 sq
The current stock is heavily skewed ft band. The largest deal this quarter was CEVA leasing Wolverhampton 450
towards lower quality second-hand units. comprising 448,089 sq ft, it was speculatively developed by Panattoni.
Currently, just 20% of space on the market
is Grade A, whilst 44% is Grade B, and Development Pipeline
36% Grade C. Closer analysis highlights There are 11 units currently under construction within the West Midlands,
that a large proportion of this stock is in totalling 1.86 million sq ft. Nine are within the 100,000-200,000 sq ft size
need of refurbishment and is not currently band, and two within the 300,000-400,000 sq ft band.
capable of accomodating modern occupier
requirements. Developers are beginning to Take-up 77% above long-term H1 average
recognise this, and we are seeing older Grade A Spec
A
B and C units refurbished to provide fit-for- 8 B
purpose space. 7
C
Rolling Average - 5 years
Furthermore, in terms of unit count, 70%
6
are within the 100,000-200,000 sq ft size
Sq ft (millions)
band, whilst 26% are within the 200,000- 5
300,000 sq ft size band and 4% in the 4
400,000-500,000 sq ft size band. The largest 3
unit on the market is Stafford 475 comprising
2
Key statistics 1
Stats yr/yr change 0
2007 2008 2009 2010 2011 2012 2013 2014 2015 2016 2017 2018 2019 2020 2021
Source Savills Research
Take-up
3.75m sq ft 275% Supply down 50% in a year, just 20% now Grade A
A Spec
A
10
Supply B
C
4.31m sq ft 50%
9
8
Development 7
Sq ft (millions)
Pipeline 1.86m sq ft 675%
6
5
Quoting 4
Grade A Rent £7.50/sq ft 8%
3
2
Vacancy rate 1
5.03% 528 bps 0
Q1 Q2 Q3 Q4 Q1 Q2 Q3 Q4 Q1 Q2 Q3 Q4 Q1 Q2 Q3 Q4 Q1 Q2 Q3 Q4 Q1 Q2 Q3 Q4 Q1 Q2 Q3
2015 2015 2015 2015 2016 2016 2016 2016 2017 2017 2017 2017 2018 2018 2018 2018 2019 2019 2019 2019 2020 2020 2020 2020 2021 2021 2021
Source Savills Research Source Savills Research
5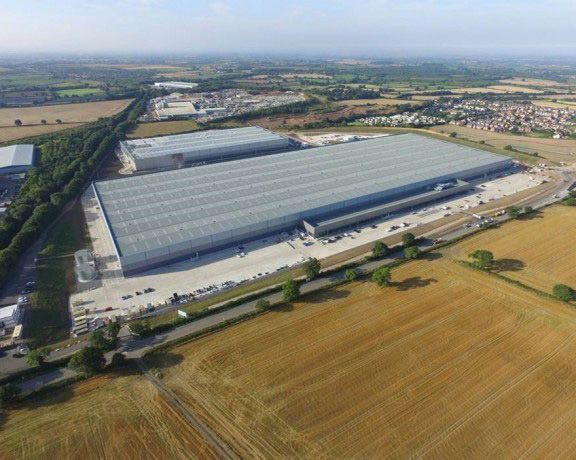
UK logistics: Big shed briefing
The North West has continued to see a huge uptick
in enquiries and subsequent transactional activity.
The strongest H1 take-up on record has caused the
amount of supply to fall to 2.7m sq ft; this leaves the
region with 0.59 years’ of supply
North West
Vacancy rate falls further, hitting 3.37%, the lowest level ever
Symmetry Park, Wigan, where Tritax Take-up
Symmetry can deliver 1.4m sq ft after Take-up in H1 2021 has surpassed expectations reaching
receiving planning consent in June 3.58m sq ft across 18 separate transactions. It’s the best H1
we have ever recorded, 89% above the long-term average.
In terms of Grade, 60% of space transacted in 2021 has
been Grade A, 27% Grade B, and the remaining Grade C.
Jon Atherton
As Covid-19 has delayed construction times, we have seen
Director
Manchester
an increase in take-up of second-hand space in the region to
0161 277 7207 satisfy immediate requirements. 2021 has seen 45% of space
jatherton@savills.com transacted being second-hand, 28% being built-to-suit, with
the remainder being speculatively developed space. Occupier
Supply demand has centred on smaller sized units; the average deal
The supply of warehouse space has decreased size in 2021 currently stands at 198,822 sq ft.
dramatically in the last 12 months to stand at We continue to see strong levels of activity from a
2.7m sq ft across 14 separate units. Using the variety of different occupier types in the North West, which
three-year average annual take-up of 4.56m continues to demonstrate the strength of the market. The
sq ft, this equates to just 0.59 years’ worth of largest deal this year has been Amazon committing to a
supply in the region. 650,000 sq ft unit in Knowsley.
Grade A stock now accounts for 36%
of all available space, of which 17% has Development Pipeline
been speculatively developed. In terms of There are currently 10 units being developed, totalling 2.12m
unit count, the supply is skewed towards sq ft. Six are in the 100,000-200,000 sq ft size band, two
the smaller size bands, 64% are between in the 200,000-300,000 sq ft size band, and two within the
100,000-200,000 sq ft band, 21% within the 300,000-400,000 sq ft size band.
200,000-300,000 sq ft range and 7.5% within
the 300,000-400,000 sq ft and 400,000-
500,000 sq ft size bands. The largest available Take-up best H1 ever recorded, at 3.58m sq ft
unit is Matrix 420 in Chorley, comprising Let prior to PC
BTS
421,810 sq ft of Grade A second-hand space. 6
New
Second Hand
Savills is aware that 36% of the current Rolling Average - 5 Years
5
available space is under offer and due to
exchange in Q3 2021 - this would drop the
Sq ft (millions)
4
vacancy rate further to 2.12%.
3
2
1
Key statistics
Stats yr/yr change 0
2007 2008 2009 2010 2011 2012 2013 2014 2015 2016 2017 2018 2019 2020 2021
Source Savills Research
Take-up
3.58m sq ft 36% Supply fallen by 36% in 12 months
8 500,000 sq ft+
Supply 400-500,000 sq ft
2.7m sq ft
300-400,000 sq ft
7
36% 200-300,000 sq ft
100-200,000 sq ft
6
Development 5
2.12m sq ft
Sq ft (millions)
Pipeline 144% 4
Quoting 3
Grade A Rent £7.25/sq ft no change 2
1
Vacancy rate
3.37% 211 bps 0
Q1 Q2 Q3 Q4 Q1 Q2 Q3 Q4 Q1 Q2 Q3 Q4 Q1 Q2 Q3 Q4 Q1 Q2 Q3 Q4 Q1 Q2 Q3 Q4 Q1 Q2 Q3
2015 2015 2015 2015 2016 2016 2016 2016 2017 2017 2017 2017 2018 2018 2018 2018 2019 2019 2019 2019 2020 2020 2020 2020 2021 2021 2021
Source Savills Research Source Savills Research
savills.com/research 6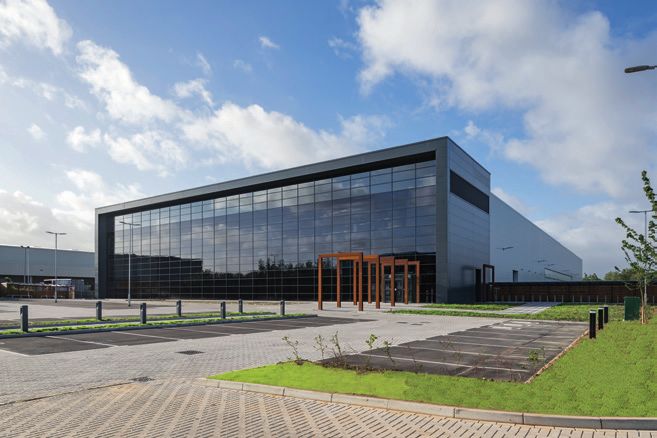
UK logistics: Big shed briefing
The strength of the occupational market seen in 2020 has
continued into 2021. H1 2021 take-up has been record-breaking,
reaching 6.77m sq ft. Supply is now at the lowest level ever
recorded. Consequently, we have seen a dramatic uptick in
rents and a reduction in incentives offered
Yorkshire and the North East
Vacancy rate just 2.90%; 0.28 years’ worth of supply in the market
Take-up
Following the three strongest years of take-up ever recorded
in the market, H1 2021 has performed exceptionally,
with take-up totalling 6.77m sq ft through 10 separate
transactions. This has already surpassed the average annual
figure by 36% and is the strongest H1 ever recorded in the
Tom Asher
region.
Director
Mammoth 602, where GLP are set to Of the space transacted, 43% was build-to-suit, 34% was
Leeds
speculatively develop a 601,761 sq ft unit speculatively developed space, and 23% was second hand.
0113 220 1228
tom.asher@savills.com The largest deal in H1 2021 was Amazon committing to c.2m
sq ft at the Wakefield Hub.
Supply Activity was spread over the size bands - by deal count,
Supply of units over 100,000 sq ft is now at 37% were within the 100,000-200,000 sq ft size, 21% in
the lowest level ever recorded in the region. both the 200,000-300,000 sq ft and 300,000-400,000 sq ft
Currently, there is 2.45m sq ft available across size bands. The 400,000-500,000 sq ft size band saw 5% of
17 separate units. This has pushed the vacancy deals, and the 500,000 sq ft+ size band saw 16%.
rate lower to 2.90%, leaving just 0.28 years’ The majority of activity in 2021 has stemmed from 0nline
worth of supply in the market according to the retailers, who accounted for 43% of all take-up, and 3PLs,
three-year annual average take-up. who accounted for 27%.
Now, just 5% of the available supply
is classified as Grade A. The region is in Development Pipeline
desperate need of new stock to relieve this There are currently 10 units under construction totalling
chronic shortage. 65% of the stock is Grade B, 2.71m sq ft. Two of the units announced speculatively are over
with 30% Grade C. As with a large proportion 600,000 sq ft, which will be welcome by occupiers given the
of Grade B and C stock, they could often number of larger requirements in the region.
be considered obsolete through not being
capable of accommodating modern occupier Take-up best H1 ever recorded
requirements. Let prior to PC
BTS
An ongoing concern is that we are seeing 12 New
Second Hand
occupier demand for larger units increase Rolling Average - 5 years
10
within the region; however, 88% of the stock
is within the 100,000-200,000 sq ft size
Sq ft (millions)
8
band, and 12% the 200,000-300,000 sq ft size
band. Consequently, occupiers have to either 6
commit to built-to-suit units or look towards
4
neighbouring regions.
2
Key statistics
Stats yr/yr change 0
2007 2008 2009 2010 2011 2012 2013 2014 2015 2016 2017 2018 2019 2020 2021
Source Savills Research
Take-up
6.77m sq ft 0.07% Supply dominated by smaller units
7 500,000 sq ft+
Supply 400-500,000 sq ft
300-400,000 sq ft
2.45m sq ft 50% 6 200-300,000 sq ft
100-200,000 sq ft
5
Development
2.71m sq ft
Sq ft (millions)
Pipeline 58% 4
3
Quoting
Grade A Rent £7.00/sq ft 17% 2
1
Vacancy rate
2.90% 335 bps 0
Q1
2015
Q2
2015
Q3
2015
Q4
2015
Q1
2016
Q2
2016
Q3
2016
Q4
2016
Q1
2017
Q2
2017
Q3
2017
Q4
2017
Q1
2018
Q2
2018
Q3
2018
Q4
2018
Q1
2019
Q2
2019
Q3
2019
Q4
2019
Q1
2020
Q2
2020
Q3
2020
Q4
2020
Q1
2021
Q2
2021
Q3
2021
Source Savills Research Source Savills Research
7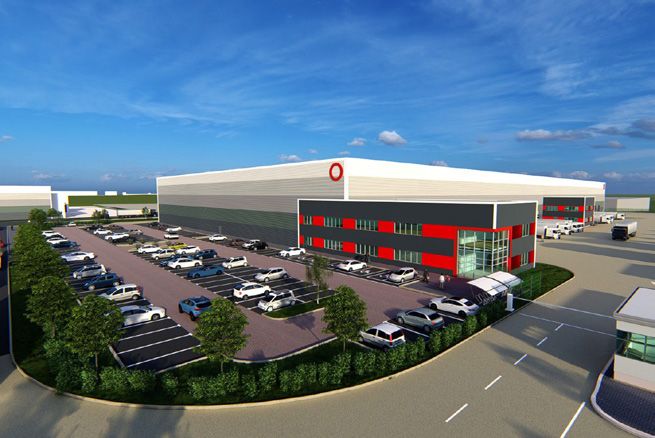
UK logistics: Big shed briefing
Recently, the South West & Wales has seen an increase
in activity due to competitive pricing compared to other
regions. However, the lack of good quality supply continues
to hinder take-up. Developers and investors should focus on
improving existing Grade B & C space to improve returns
South West & Wales
H1 2021 take-up reached 1.1m sq ft; incentives reduce
Take-up
Take-up in the South West and Wales market
totalled 1.1m sq ft across seven separate
transactions, 30% above H1 2020. Adhering to
regional trends, deal volumes have centred around
Rob Cleeves
the smaller size bands, with 72% of deals being
Director Tungsten Park, Avonmouth, where a
Bristol
within the 100,000-200,000 sq ft size band, 14% in
240,000 sq ft speculative unit is under
01179 102 227 the 200,000-300,000 sq ft size band, and 14% the
construction
rcleeves@savills.com 300,000-400,000 sq ft size band.
H1 2021, has seen 62% of take-up being second-
Supply hand space, 29% built-to-suit space, and 9%
The supply of units over 100,000 sq ft in the speculatively developed space. The supply is
region currently stands at 4.62m sq ft across hindering take-up as occupier requirements centre
24 separate units. Imperial Park in Newport is around new, modern units.
the largest unit at 800,000 sq ft, skewing the
current availability. Development Pipeline
The quality balance is heavily skewed There is currently 825,210 sq ft under construction
towards lower-quality units, with just 16% in the region across five units. Four of these units
of available space classed as Grade A, down are under construction in the South West and one
from 36% at the start of last year. This is in Wales. Of the five, two are under construction in
hindering take-up as occupiers are looking the 100,000-200,000 sq ft size band, and a single
at neighbouring regions to satisfy their unit in both the 200,000-300,000 sq ft band and
requirements for good quality units. the 300,000-400,000 sq ft band.
Additionally, by unit count, the supply
continues to be dominated by smaller units,
with 66% being within the 100,000-200,000 Take-up dominated by smaller-sized units
sq ft size band. There are three units available 6
500,000 sq ft+
400-500,000 sq ft
above 300,000 sq ft, all of which are of 300-400,000 sq ft
second-hand quality.
200-300,000 sq ft
5 100-200,000 sq ft
Savills is aware that 21% of the current Rolling Average - 5 years
Sq ft (millions)
vacant stock is under offer and due to 4
exchange in Q3 2021. This is set to bring the
3
vacancy rate to 9.39%
2
1
Key statistics
Stats yr/yr change 0
2007 2008 2009 2010 2011 2012 2013 2014 2015 2016 2017 2018 2019 2020 2021
Source Savills Research
Take-up
1.1m sq ft 30% Supply just 16% are Grade A, skewed by Imperial Park
A Spec
5
Supply A
4.62m sq ft
B
16% 4 C
Development
Sq ft (millions)
3
Pipeline 0.83m sq ft 654%
2
Quoting
Grade A Rent £7.25/sq ft no change
1
Vacancy rate
11.90% 170 bps 0
Q1 Q2 Q3 Q4 Q1 Q2 Q3 Q4 Q1 Q2 Q3 Q4 Q1 Q2 Q3 Q4 Q1 Q2 Q3 Q4 Q1 Q2 Q3
2015 2015 2015 2015 2016 2016 2016 2016 2017 2017 2017 2017 2018 2018 2018 2018 2019 2019 2019 2019 2020 2020 2020
Source Savills Research Source Savills Research
savills.com/research 8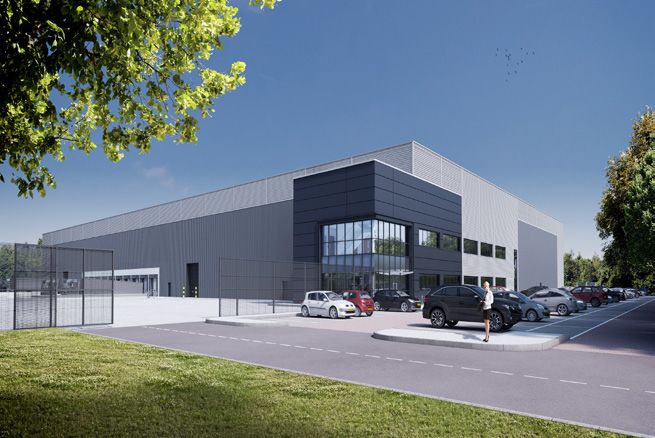
UK logistics: Big shed briefing
We have recorded a significant uptick in occupier
requirements in the last year, highlighting the
prominence of locating in the East of England due
to our ports and proximity to London and the rest
of the UK
East of England
Supply is skewed due to one large unit; it’s now under offer
Delta Park , Peterborough, where Take-up
Trebor are speculatively developing Take-up in H1 2021 has reached 901,000 sq ft through three
two units totaling 538,000 sq ft separate transactions, whilst a slight decline on 2020, this
remains 117% above the long-term H1 average.
New speculatively developed space accounted for the
largest proportion of take-up, reaching 68% - the remaining
William Rose
32% was built-to-suit space. No second-hand space has been
Director
Peterborough
taken in the region, highlighting occupier preference towards
01733 201 391 better quality units. The two recent speculatively developed
wrose@savills.com units at Peterborough Gateway were let in Q1 2021, shortly
after completion, to MH Star and Oatly. The short void period
Supply highlights the continued occupier demand within the region.
The level of supply in the region has increased As the supply consists of low-quality second-hand space, we
by 14% over the last year. Currently, there are seeing occupiers increasingly go down the build-to-suit route
is 1.45m sq ft available within the region to obtain large modern units. The shortage of new space will
through four units. The largest unit on the continue to bring reduced incentives and positive rental growth.
market is 736 Kingston Park in Peterborough
comprising 736,000 sq ft of Grade A space - Development Pipeline
it’s currently under offer, set to exchange in There are currently two units under construction at Delta Park in
Q3 2021. Following the exchange, there will be Peterborough of 307,500 sq ft and 230,940 sq ft. After they reach
just three units available, providing 709,380 PC, there will be no other units under construction in the region.
sq ft of Grade C second-hand space. Further Without any pipeline development, occupiers will need to look to
analysis demonstrates all of the Grade C sites such as Gateway 14, Suffolk Park, Flagship Business Park or
available space is in need of refurbishment Peterborough South in order to satisfy requirements for good quality
and is arguably more suitable for demolition space.
in order to accommodate modern occupiers.
Aside from the aforementioned 736 Take-up dominated by Grade A space
Kingston Park, the remaining vacant units are 4 Let prior to PC
BTS
all below 350,000 sq ft. New
The vacancy rate remains constrained Second Hand
3
at 5.73%, which continues to push on rental Rolling Average - 5 years
Sq ft (millions)
growth. As 736 Kingston Park exchanges, the
vacancy rate will drop to 2.81% demonstrating 2
the volatility of supply in the region.
1
Key statistics
Stats yr/yr change 0
2007 2008 2009 2010 2011 2012 2013 2014 2015 2016 2017 2018 2019 2020 2021
Source Savills Research
Take-up
0.9m sq ft 14% Supply 51% is currently under offer
500,000 sq ft+
2.0
Supply
400-500,000 sq ft
300-400,000 sq ft
1.45m sq ft 14% 200-300,000 sq ft
100-200,000 sq ft
1.5
Development
Sq ft (millions)
Pipeline 0.54m sq ft 11%
1.0
Quoting
Grade A Rent £6.00/sq ft no change 0.5
Vacancy rate
5.73% 48 bps 0.0
Q1 Q2 Q3 Q4 Q1 Q2 Q3 Q4 Q1 Q2 Q3 Q4 Q1 Q2 Q3 Q4 Q1 Q2 Q3 Q4 Q1 Q2 Q3 Q4 Q1 Q2 Q3
2015 2015 2015 2015 2016 2016 2016 2016 2017 2017 2017 2017 2018 2018 2018 2018 2019 2019 2019 2019 2020 2020 2020 2020 2021 2021 2021
Source Savills Research Source Savills Research
9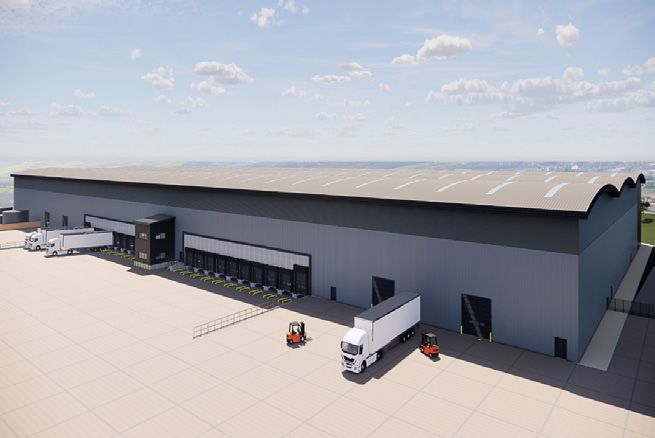
UK logistics: Big shed briefing
Statistically, demand for buildings over 100,000 sq ft
appears to have declined. However, demand is present,
but the shortage of available good quality stock and new
development pipeline produces figures that would suggest
otherwise. This critical shortage has, however, reduced
incentives and increased rental growth across the wider
market
Scotland
Re-occupation of vacant stock pushes vacancy lower to 5.70%
Take-up
Take-up of units in H1 2021 reached
550,000 sq ft through a single transaction.
HarperCollins has committed to a 550,000
sq ft built-to-suit unit at Nova Business Park
in Glasgow. This letting has taken another
Ross Sinclair
substantial piece of development land away
Director
Glasgow
from the future pipeline.
Nova Park, Glasgow, where HaperCollins
0141 222 4145 Take-up continues to be constrained
have committed to a 550,000 sq ft BTS
rsinclair@savills.com by both shortages in the size and quality
of available units throughout the region;
Supply occupiers are having to settle for lower
The supply of warehouse space in Scotland quality, and smaller-sized units to satisfy
for units larger than 100,000 sq ft has fallen their requirements.
6% in the last year to stand at 1.25m sq ft
across nine separate units. Development Pipeline
The supply continues to be dominated There are still no units being speculatively
by second-hand space with no new units developed over 100,000 sq ft in Scotland.
available. Currently, 49.7% of the space As take-up increases, we expect a stable or
available is Grade B second-hand space, and declining supply which will keep the vacancy
50.3% is Grade C second-hand space. rate low in the short to medium term and, in
Of the nine units currently available, eight turn, push on rental growth. Consequently,
are within the 100,000-200,000 sq ft size the occupier led build-to-suit market will
band, and there is a single unit within the have to satisfy the needs of the industrial
200,000-300,000 sq ft size band. market in Scotland.
The decrease in the amount of supply in
the region has caused the vacancy rate in Take-up dominated by bespoke BTS letting
Scotland to now stand at 5.70%. 2.0
BTS
New
The largest unit on the market is 10-12 Second Hand
Cloberfield in Milngavie, totalling 226,449
Rolling Average - 5 years
sq ft - Savills are the acting agents. 1.5
Sq ft (millions)
1.0
0.5
Key statistics
Stats yr/yr change 0.0
2007 2008 2009 2010 2011 2012 2013 2014 2015 2016 2017 2018 2019 2020 2021
Source Savills Research
Take-up
0.55m sq ft 22% Supply majority under 200,000 sq ft
5 500,000 sq ft+
Supply 400-500,000 sq ft
1.25m sq ft
300-400,000 sq ft
6% 4
200-300,000 sq ft
100-200,000 sq ft
Development
0 sq ft
3
Pipeline
no change
Sq ft (millions)
Quoting
2
Grade A Rent £6.50/ sq ft 13%
1
Vacancy rate
5.70% 57 bps
0
Q1
2015
Q2
2015
Q3
2015
Q4
2015
Q1
2016
Q2
2016
Q3
2016
Q4
2016
Q1
2017
Q2
2017
Q3
2017
Q4
2017
Q1
2018
Q2
2018
Q3
2018
Q4
2018
Q1
2019
Q2
2019
Q3
2019
Q4 Q1 Q2 Q3 Q4 Q1
2019 2020 2020 2020 2020 2021
Q2
2021
Q3
2021
Source Savills Research Source Savills Research
savills.com/research 10UK logistics: Big shed briefing
The continued positive sentiment in the occupational
market means investors remain keen to deploy capital
into the sector. Given the weight of capital targeting
the sector there is every likelihood yields will compress
further in the coming months
National investment
Investment volumes set to reach new record
from speculative development and large-scale build-to-suits, there will be increased
competition for the best assets and we expect to see further downward pressure on yields
in H2. Investors searching for value would be advised to examine what refurbishment
opportunities exist for well-located, second hand assets that are either vacant or have
upcoming lease events. Such opportunities will present options to deliver better quality
stock into a supply starved market.
Tom Scott
Director, Investment volumes already exceeding annual average
UK Investment Savills IM have acquired a 1m sq ft
020 7075 2819 fulfilment centre for £161m 5.0 H2
tscott@savills.com
H1
The positive sentiment in the occupational market 4.5
continues to feed into the logistics investment 4.0
market, with investment volumes for the half-year
3.5
reaching £3.8bn. This is a 239% increase on H1 2020
and already exceeds the five-year annual average 3.0
£ (billions)
investment volume, which stands at £3.7bn per 2.5
year. Given that, traditionally, the latter part of any 2.0
year sees a stronger performance in the investment
1.5
market, it is all but certain that 2021 will see another
record year for capital deployed into the logistics 1.0
sector, exceeding the £4.7bn transacted in 2020. 0.5
Whilst there have been notable portfolio
0.0
transactions such as BentallGreenOak purchasing
a £300m portfolio from Morgan Stanley and
Blackstone acquiring the Albion and Vantage
portfolios for a combined £469m, there have also
been a number of high-value single asset purchases
Prime investment yields record lows at 3.5%
from overseas investors. Savills Investment
Management (advised by Savills) has purchased
Distribution
the largest single-let unit this year, paying £161m for Multi-let
9.0
an Amazon fulfilment centre in Bardon, and Deka
(also advised by Savills) has purchased the John
8.0
Lewis Distribution Centre in Milton Keynes for
£100m, reflecting a net initial yield of 3.75%.
7.0
We expect this trend to continue in the second
Yield %
half of the year as the logistics market presents 6.0
an interesting dichotomy for UK Institutions.
For funds keen to raise cash either in line with 5.0
strategy or more promptly to meet redemptions,
the logistics market offers a ready pool of 4.0
experienced buyers often able to pay prices above
valuation. In addition, many other investors still 3.0
remain underweight to the logistics sector and are
prepared to invest into a market with strong rental
growth prospects and capital growth maintaining
its upward trajectory.
The sheer and ever increasing weight of capital
combined with strengthening sentiment across
the market has seen further downward pressure
on yields, which now stand at record low levels of
3.5% for both distribution warehouses and multi-let
estates, moving in 100 bps and 75 bps respectively
in the last 12 months. The question on many
investors’ minds now will be how low can they go
and where can we find value?
With the occupational market showing no sign
of slowing and new grade A product being created
1113.5% Rental growth
forecast by RealFor by
2025
2021 Outlook
What next for rental growth?
Given the sharp declines in vacancy across most to replenish the pipeline, the competition for these units will be fierce.
of the regions we cover, and the strong current We expect this situation will accelerate rental growth over the next two
levels of take-up, attention has turned towards years before dropping back over the latter half of the five year forecast period.
what rental growth should be expected in the
medium term. The latest rental growth forecasts Rental growth forecast 13.5% growth by 2025 to be eclipsed
from RealFor suggest the wider logistics market
should expect to see growth of 2.7% p.a until 18.0
2025. Whilst these macro-econometric forecasts 16.0
take into account past performance and wider
14.0
economic indicators such as GDP, employment
Rental growth % 2021-2025
and consumer confidence, they do not readily 12.0
consider localised market conditions.
10.0
Given that vacancy has hit record low levels
in many regions, construction materials are in 8.0
short supply, and occupier demand remains at 6.0
record levels, there is a clear case to suggest
that actual rental growth will exceed the 4.0
current forecasts. 2.0
In Yorkshire, for example, vacancy has
reached a historic low of 2.35%, and take- 0.0
up at the half-year has reached 6.7m sq ft,
already exceeding the annual average. There
is just 113,000 sq ft of Grade A space on the
market, and whilst the developers are aiming Source RealFor
BUILD COST AND PROGRAMME
The latest indicators from the Savills Manufacturers, however, are still projects are being delayed, and some of
ProgrammE and Cost Sentiment Survey playing catch up, having furloughed the planned speculative announcements
(S.P.E.C.S) demonstrate that build costs workers and reduced production. What’s for the remainder of the year may have
and programme delivery time scales more, for a short period, British Steel to be pushed back to 2022. Given the
Will Cooper are expected to rise in the short term also stopped accepting new orders, pressures in the supply chain and the
Director, Building & as the availability of cladding, steel and only to reverse the decision while lack of available contractors, developers
Project Consultancy concrete negatively impact the delivery simultaneously raising prices by £100 should factor in the potential for tender
020 7409 8952 of new warehouse space. Globally, per tonne, the second price rise in a price inflation and a significant delay to
wcooper@savills.com a perfect storm has emerged as the little over a month. Whilst Savills is programmes.
demand for raw materials has surged as tracking 16.79 m sq ft of speculative
lockdown restrictions have ended. warehouse construction, some of these
Savills Research
We are a dedicated team with an unrivalled reputation for producing well-informed and
accurate analysis, research and commentary across all sectors of the UK property market.
Richard Sullivan Richard Merryweather Simon Collett Kevin Mofid Will Laing
Agency Investment Building Research Research
0207 409 8125 0207 409 8838 Consultancy 0203 618 3612 0207 535 2955
rsullivan@savills.com rmerryweather 0207 409 5951 kmofid@savills.com will.laing@savills.com
@savills.com scollett@savills.com
Savills plc: Savills plc is a global real estate services provider listed on the London Stock Exchange. We have an international network of more than 600 offices and associates throughout the Americas, the UK,
continental Europe, Asia Pacific, Africa and the Middle East, offering a broad range of specialist advisory, management and transactional services to clients all over the world. This report is for general informative
purposes only. It may not be published, reproduced or quoted in part or in whole, nor may it be used as a basis for any contract, prospectus, agreement or other document without prior consent. While every effort has
been made to ensure its accuracy, Savills accepts no liability whatsoever for any direct or consequential loss arising from its use. The content is strictly copyright and reproduction of the whole or part of it in any form
is prohibited without written permission from Savills Research.You can also read