A Social Network Analysis of the Western Journal of Emergency Medicine Special Issue in Educational Research and Practice
←
→
Page content transcription
If your browser does not render page correctly, please read the page content below
Original Research

  A Social Network Analysis of the Western Journal of Emergency
   Medicine Special Issue in Educational Research and Practice
John W. Cyrus, MA, MLIS*              *Tompkins-McCaw Library for the Health Sciences, Virginia Commonwealth University,
Sally A. Santen, MD, PhD†               Research and Education Department, Richmond, Virginia
Chris Merritt MD, MPH, MHPE‡          †
                                        Virginia Commonwealth University School of Medicine, Department of Emergency
Brendan W. Munzer, MD§                  Medicine, Richmond, Virginia
William J. Peterson, MD§              ‡
                                        Alpert Medical School of Brown University, Departments of Emergency Medicine &
Jeff Shockley, MBA, PhD¶                Pediatrics, Providence, Rhode Island
Jeffrey N. Love, MD, MHPE||           §
                                        University of Michigan, Department of Emergency Medicine, Ann Arbor, Michigan
                                      ¶
                                        Virginia Commonwealth University, School of Business, Department of Supply Chain
                                        Management and Analytics, Richmond, Virginia
                                      ||
                                        George Washington University, Department of Emergency Medicine, Washington, DC,
                                        Maryland

Section Editor: Jeffrey Druck, MD
Submission history: Submitted March 3, 2020; Revision received July 1, 2020; Accepted July 15, 2020
Electronically published October 8, 2020
Full text available through open access at http://escholarship.org/uc/uciem_westjem
DOI: 10.5811/westjem.2020.7.46958

        Introduction: Scholarship and academic networking are essential for promotion and productivity. To
        develop education scholarship, the Council of Emergency Medicine Directors (CORD) and Clerkship
        Directors of Emergency Medicine (CDEM) created an annual Special Issue in Educational Research
        and Practice of the Western Journal of Emergency Medicine. The objective of this study was to
        evaluate the network created by the special Issue, and explore changes within the network over time.

        Methods: Researchers used bibliometric data from Web of Science to create a social network
        analysis of institutions publishing in the first four years of the special issue using UCINET software. We
        analyzed whole-network and node-level metrics to describe variations and changes within the network.

        Results: One hundred and three (56%) Accreditation Council for Graduate Medical Education-
        accredited emergency medicine programs were involved in 136 articles. The majority of institutions
        published in one or two issues. Nearly 25% published in three or four issues. The network analysis
        demonstrated that the mean number of connections per institution increased over the four years (mean
        of 5.34; standard deviation [SD] 1.27). Mean degree centralization was low at 0.28 (SD 0.05). Network
        density was low (mean of 0.09; SD 0.01) with little change across four issues. Five institutions scored
        consistently high in betweenness centrality, demonstrating a role as connectors between institutions
        within the network and the potential to connect new members to the network.

        Conclusion: Network-wide metrics describe a consistently low-density network with decreasing
        degree centralization over four years. A small number of institutions within the network were
        persistently key players in the network. These data indicate that, aside from core institutions that
        publish together, the network is not widely connected. There is evidence that new institutions are
        coming into the network, but they are not necessarily connected to the core publishing groups.
        There may be opportunities to intentionally increase connections across the network and create
        new connections between traditionally high-performing institutions and newer members of the
        network. Through informal discussions with authors from high-performing institutions, there are
        specific behaviors that departments may use to promote education scholarship and forge these new
        connections. [West J Emerg Med. 2020;21(6)242-248.]

Western Journal of Emergency Medicine                          242                               Volume 21, no. 6: November 2020
Cyrus et al. Social Network Analysis of WestJEM Education Issues
INTRODUCTION
For educators, publication is important for both the Population Health Research Capsule
dissemination of educational innovation and academic
promotion. Research collaboration between institutions improves What do we already know about this issue?
circulation and generalizability, reflecting a growing trend The ability of the WestJEM Special Issue in
for joint research among academic scholars and institutions.1 Educational Research and Practice to encourage
For any research community the knowledge-creation process and connect scholars across institutions is not yet
depends on researchers’ collective ability to combine and known.
integrate the findings from previous studies to advance new
incremental knowledge in that area. Education research and What was the research question?
scholarship are essential for the dissemination of innovative What are the characteristics of the social network
educational practices. In the recent past there has been an of institutions created by the special issue?
emphasis among academic institutions to focus on educational
requirements of certifying organizations and financial outcomes What was the major finding of the study?
with less emphasis on such things as scholarly teaching and An increasingly diverse group of institutions is
research.2–4 The Western Journal of Emergency Medicine represented in the network with a core of schools
(WestJEM), Council of Emergency Medicine Directors (CORD), publishing in consistent groups.
and the Clerkship Directors of Emergency Medicine (CDEM)
came together in 2015 to create a Special Issue in Educational How does this improve population health?
Research and Practice. This special issue provides the There is opportunity to increase education
opportunity for EM researchers to collaborate and disseminate research collaboration by intentionally
educational innovations. expanding the network to include new institutions
In this study we sought to understand the network of authors’ and encouraging new groupings of institutions on
institutions publishing in the special issue through social network publications.
analysis (SNA), a strategy used to investigate the social structures
of groups or individuals.5 SNA conceptualizes a network using
the ties (edges) that connect its members (nodes) by focusing
on attributes of the relationship.6 SNA has been used in medical single identifier. We used institutional identifiers to calculate
education to analyze research topics and trends, the dissemination the number of articles with authors from more than one
of educational innovations, communities of practice, and institution. The following data were abstracted for all articles
scholarship networks.7,8 This tool captures quantitative aspects appearing in the 2015, 2017, 2018 and 2019 WestJEM special
of the patterns of relationships, which allows for comparisons issues: author(s); article title; year of publication; digital
between different groups and network structures. When compared object identifier; and the times cited within the Web of Science
over time, SNA can show changes in relationships between (Clarivate Analytics, clarivate.com); authors’ affiliations; article
members of a network. type (original research, commentary, education innovation, etc);
Co-authorship networks are a type of social network that number of institutions represented by authors; and whether or
may help to explain the latent structure of particular scientific not data were gathered from one or multiple institutions.
inquiry or the status of individual authors of research. These
networks also have the potential to identify high productivity Data Analysis
institutions, aiding in the discovery and dissemination of best We used the institution and co-authorship data to analyze
practices strategies for promoting educational scholarship. The the social network associated with each year of the Special Issue
objective of this study was to evaluate and map this network of in Educational Research and Practice as well as all four years
education scholars publishing in the special issue and measure combined. The software UCINET (Analytic Technologies,
characteristics of the network to assist faculty in establishing analytictech.com) was used to conduct a SNA of the WestJEM
robust publishing connections. Special Issues. UCINET allows the analysis of a social network
through whole-network and node-level metrics as well as visual
METHODS representation of the network. Whole-network and node-level
Data Collection metrics are used to describe variations in the network in each of
To assess social connectivity among authors and institutions the four years and across all years while the sociogram depicts
published in the first four CORD/CDEM special issues the extent of the network created by all of the special issues.
we collected and analyzed bibliometric data as described Institutional review board approval was not required as this is
previously.9 Publication data were exported from Web of based on publicly available data and not considered to be human
Science, and the authors’ institutional affiliations were collapsed subjects research. Specific metrics of interest at the network and
so that multiple names for one institution were grouped into a node (institution) levels are included in Table 1.
Volume 21, no. 6: November 2020 243 Western Journal of Emergency MedicineSocial Network Analysis of WestJEM Education Issues Cyrus et al.
Table 1. Definitions of selected social network metrics included in this study assessing connectivity among authors and institutions.
Network level metrics
Average degrees The average number of connections for a member of the network. This helps describe how connected an
average (typical) institution is across the special issue network.
Network density The proportion of actual connections to all possible connections across the entire special issue network
(range: 0-1). In the context of this study, a denser network (higher value, closer to 1) would mean the authors’
institutions are more directly connected to each other, while a less dense network (closer to 0) would mean
fewer direct connections between author institutions making up the special issue network.10
Degree centralization Measures the concentration of power or influence within a network or the variance in the distribution of
centrality in a network. This is a normalized value of the importance of single players within the given network.
In our case, high degree centralization would suggest that the network is characterized by few centralized
institutions whereas a low centralization score would suggest that institutions are more evenly distributed
across the special issue network.
Node level metrics
Degree centrality The number of connections between one institution and the other institutions within the network. In this study,
a network node is represented by a single institution and the degree would count the number of connections
to other institutions making up the special issue network.11
Betweenness Measure of how often a node (institution) is connected to other nodes (institutions) that are not then
centrality connected to each other. As such, the measure serves as an indicator of which institutions serve as key
bridges or connectors within the special issue network.10,11
RESULTS make up the global network of special issue publications
Over four years of the WestJEM CORD/CDEM special (answering the question: how centralized is the network?).
issues, authors from 122 institutions contributed to 136 articles The score is a ratio that compares the actual sum differences
that were included in this analysis; a description of this dataset is between the individual institution’s degree centrality score and
published elsewhere.9 Of the 122 institutions that published in a the maximum degree centrality score in the network. As such,
special issue, 41.8% (51) published in a single year, 33.6% (41) the resulting measure can range from 0-1 in the global network,
published in two years (consecutive or not), 13.9% (17) published where a score closer to 0 would represent a global network
in three years, and 10.6% (13) published in all four years. Fifty- where all institutions are on more equal footing, whereas a
six percent (76) of the publications in the special issues included larger score would indicate a network where fewer institutions
authors from more than one institution with a low of 42% (14) in were more central to the network. Overall, it appears that
2015 and a high of 69% (25) in 2017. In analyzing the network degree centralization was low in each of the years of the
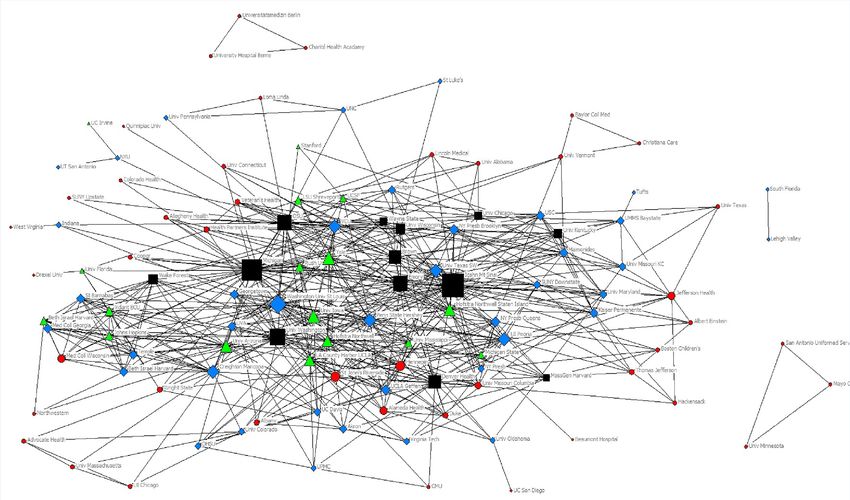
created by the special issues, Figure 1 represents the relationship special issues (average 0.28 across four issues). However, as
between institutions across all four years. noted in Table 2, in the 2018 and 2019 issues, there was greater
participation by a more diverse set of institutions than was seen
Network-wide metrics in the earlier issues.
Density
Network density is a ratio measure that compares the number Node-level Metrics
of actual connections between institutions in the network to the Degree Centrality
total possible potential institutional connections that make up Degree centrality for a particular institution represents the
the network of scholarship. The resulting score can range from importance of a particular institution in the network (ie, which
0-1. In each of the four years analyzed, and in the cumulative institutions are in the center). For each institution, we calculated
analysis, network density remained fairly constant across the the degree centrality score for that institution, which is simply
special issues, ranging from 0.08-0.1 (mean score of 0.09). (For the sum total of the number of connections that a particular
whole-network metrics, see Table 2.) Given that the network institution has to other institutions making up the network of
density score remained about .08 across all publications and scholarship. Three institutions placed in the top three in terms of
years, this would imply that there was no observed expansion in degree centrality within the network most years (Michigan, Mt.
collaboration between the different institutions making up the Sinai, and Ohio State). There was considerable variation within
scholarship network. degree centrality each year for each institution (see Table 3). With
the exception of 2018, a year in which Yale did not publish in the
Degree Centralization special issue, the average degree of the network nodes increased
Degree centralization measures to what extent there are between the initial issue and the most recent (eg, 3.48 in 2015 to
a small number of highly centralized nodes (institutions) that 6.17 in 2019, mean 5.34).
Western Journal of Emergency Medicine 244 Volume 21, no. 6: November 2020Cyrus et al. Social Network Analysis of WestJEM Education Issues
Betweenness Centrality a diverse network of authors and institutions. The network was
Betweenness is another measure of centrality importance diverse in the individual institutions represented in the issues
based on where a particular institution stands as a crossover and new institutions being introduced to the network as well as
point for shortest paths between all the other nodes in the entire some variability of the authorship groups. In other words, often
network. The betweenness centrality score for an institution, papers included different authors from different institutions and
therefore, is the number of the shortest paths that pass through a different group of authors for other papers. Still, there were a
that institution in the network of scholarship. The top five small number of institutions that published in consistent author
institutions based on betweenness scores for all four years groups, without introducing new members to that group, and
combined were Michigan, Mt. Sinai, Ohio State, University were more highly connected to the rest of the network.
of Washington, and Yale (see Table 3). These institutions also Social network analysis focuses on the interactions
had authors publish in either three or four years of the special between the members of the network.12 The analysis provides
issues. While the node with the highest betweenness score varied information about how members interact with one another
from year to year, the same group of five institutions remained and what is the level of connectedness.13 In the network, every
important actors in the network across the four years. network member, is not tied to every other node. There may
be clusters of densely knit connections, while other members
DISCUSSION may only be connected from the periphery through a central
Social network analysis serves as a useful method for member. The relationships reflect a flow of interactions and
investigating characteristics of the WestJEM Special Issue in opportunities. It is these varying degrees of closeness, or
Education and Research and Practice network as it highlights key connectedness, that determine the influence that node may have
players within the network and trends within each year and across on others. Social network analysis has been widely applied
multiple years. SNA allows observation and mapping of the across other fields and in a few studies on medical networks to
characteristics, connections, and frequency of interactions in the describe the relationships of the members.7,8,14,15
author network. This study found that the special issues represent As indicated in Table 2 by the network density remained
Figure 1. Sociogram of networked institutions from the first four years of the WestJEM Special Issue in Educational Research and Practice.
Circles represent institutions that published in a single issue. Diamonds represent institutions that published in two issues. Triangles represent
institutions that published in three issues. Squares represent institutions that published in all four issues. The node size is weighted by the
number of connections (degree) per node (reported for select institutions in Table 3 in the “All Years” column).
Volume 21, no. 6: November 2020 245 Western Journal of Emergency MedicineSocial Network Analysis of WestJEM Education Issues Cyrus et al.
Table 2. Whole-network metrics for each year of the Special Issue in Educational Research and Practice and all years combined.
Network metrics 2015 2017 2018 2019 All years
Density 0.08 0.1 0.09 0.1 0.08
Average degree 3.48 6.1 5.61 6.17 9.66
Degree centralization 0.31 0.33 0.23 0.24 0.32
Authors from two+ institutions (%) 42.42 69.44 55.56 54.84 55.88
Table 3. Degree centrality and betweenness metrics for select institutions in each year and cumulatively.
Degree centrality (rank)
Program
2015 2017 2018 2019 All years # Publications1 NIH rank2 length (years)
Average degree 3.48 6.1 5.61 6.17 9.66
centrality
Michigan 17 (1st) 20 (2nd) 24 (1st) 11 (11th) 73 24 1st 4
Mt. Sinai 8 (2nd-tie) 16 (3rd) 19 (4th) 23 (1st) 66 12 4th 4
Ohio State 3 (24th) 8 (19th-tie) 20 (2nd-tie) 9 (18th-tie) 41 17 15th 3
University of 8 (2nd-tie) 1 (53rd-tie) 10 (10th-tie) 8 (25th-tie) 32 6 Not ranked 4
Washington
Yale 8 (2nd-tie) 5 (30th-tie) n/a 16 (6th) 29 6 3rd 4
Betweenness (rank)
Michigan 0.30 (1st) 0.12 (3rd) 0.14 (1st) 0.02 (12th) 0.12 24 1st 4
Mt. Sinai 0.03 (6th) 0.16 (2nd) 0.06 (4th) 0.06 (2nd) 0.12 12 4th 4
Ohio State 0.03 (7th) 0.02 (14th) 0.06 (5th) 0.06 (3rd) 0.08 17 15th 3
University of 0.15 (2nd) 0 (27th-tie) 0 (13th-tie) 0 (16th-tie) 0.06 6 Not ranked 4
Washington
Yale 0.03 (9th) 0 (27th-tie) n/a 0.09 (1st) 0.05 6 3rd 4
1
This is the number of publications in the dataset for Social network analysis.
2
NIH (National Institutes of Health) research rankings provides a benchmark for other research in the department (http://www.brimr.org/
NIH_Awards/2018/NIH_Awards_2018.htm).
low and did not change significantly over four years. One would special issue. At the same time, measures of power concentration
expect that if the same people are in a network and developing within the network decreased over the four-year period. This
new relationships over time, then density would increase as more suggests that, aside from traditional key players reaching out
connections are made. Rather, there was no change in density to form new groups, new institutions are entering the network
reflected here, which suggests that relationships are stable and with each subsequent year with novel authorship groups. Some
that the same institutions continue to publish together with little of the new connections observed in the network may be due to
change to the institutions represented in certain author groups. reasons as various as individuals moving to new institutions, a
There is some data to suggest that while the central players in the trainee obtaining a new faculty positions, or novel authors joining
network, described in part by betweenness scores in Table 3, did the network. One might also hypothesize that the expansion
not vary greatly across the four issues and continued to published of the network is due to both formal connections generated by
in similar author groups, that some of these institutions formed work on task forces, work groups, committees, and educational
additional authorship groups with new or existing members of the scholarship programs, as well as by informal connections such as
network. However, these new connections were not brought into colleagues not attached to a specific working group.
the more established authorship groups. To understand the network dynamics better, we informally
The creation of new authorship groups mentioned above contacted the authors at institutions with the highest consistent
is supported by the fact that the average number of connections metrics in degree centrality and betweenness to provide insights
per institution increased between the initial and most recent on a departmental approach to creating successful educational
Western Journal of Emergency Medicine 246 Volume 21, no. 6: November 2020Cyrus et al. Social Network Analysis of WestJEM Education Issues
scholarship in an attempt to identify common themes. By institutions were consistently high performers in terms of
contacting these representative institutions, we sought to provide connectedness and centrality within the network. This social
insight on approaches and key strategies in building productive network analysis provides insight into the early network created
multi-institutional collaborations for educational scholarship. by the initial four years of the special issue. Future work is
Based on discussions among the authors regarding the required to determine whether these findings are consistent across
content of these discussions, there were some common threads other journals (generalizable) and whether or not changes take
for collaboration success. The first approach to scholarship was place in the network that were not identified by this study due to a
participation in working groups, task forces and longitudinal limited period.
educational scholarship programs at a national level, such as
Medical Education Research Certification at CORD, which ACKNOWLEDGEMENTS
appears to be important in developing multi-institutional The authors would like to acknowledge the following: David
research.16 These successful collaborations started with an author Way (data collection in previous paper); insights about discussion
group that was passionate about a specific question and topic. – David Way, Doug Franzen, Ambrose Wong; social network
Second, after working together on smaller projects, relationships analysis methodology – Jeff Smith.
and research groups formed that then led to working on other
papers. These groups changed over time as new people joined
and left, and new connections were made. As some research
groups matured, collaborators brought in new members leading
to new ideas and an organic growth of the network. Finally, Address for Correspondence: John W. Cyrus, MA, MLIS, Virginia
Commonwealth University, Tompkins-McCaw Library for the Health
sometimes groups have a strong educational researcher or mentor
Sciences, 509 N 12th St, Richmond, VA 23298. Email: cyrusjw@
that helps to drive the work and provides opportunities for others vcu.edu.
to engage.
Conflicts of Interest: By the WestJEM article submission agreement,
LIMITATIONS all authors are required to disclose all affiliations, funding sources
Limitations of this study included inability to account for and financial or management relationships that could be perceived
as potential sources of bias. No author has professional or financial
changes made by the movement of people to new institutions. It
relationships with any companies that are relevant to this study.
is unclear how these movements may have affected the yearly There are no conflicts of interest or sources of funding to declare.
rankings based on the data from the above figures. Additionally,
this SNA is a snapshot of one journal and its special issue. The Copyright: © 2020 Cyrus et al. This is an open access article
WestJEM Special Issue in Educational Research and Practice distributed in accordance with the terms of the Creative Commons
is co-sponsored by CORD, which may lead to a bias in how Attribution (CC BY 4.0) License. See: http://creativecommons.org/
licenses/by/4.0/
collaborations are created (eg, meeting at the annual CORD
assembly). Another significant limitation was the potential
publication bias by the supplement in the choice to publish
specific manuscripts. Although some of the process may be
blinded, the reviewers and editors may have their own biases REFERENCES
regarding which types of articles they choose. 1. Ronda-Pupo GA and Guerras-Martín LÁ. Collaboration network of
Additional research is needed to identify how research knowledge creation and dissemination on Management research:
networks are formed for publications of other journals. Future ranking the leading institutions. Scientometrics. 2016;107(3):917-39.
research is needed to further our understanding of how network 2. Love JN, Coates WC, Santen SA, et al. The MERC at CORD
connections and academic collaborations are forged, and the
Scholars Program in medical education research: a novel faculty
factors – whether individual, institutional, or across a network
development opportunity for emergency physicians. Acad Emerg Med.
such as that described here – may lead to more and stronger
2009;16(12):S38-41.
connections among academic educators. The time covered by this
3. Zibrowski EM, Weston WW, Goldszmidt MA. “I don’t have time”: issues
analysis, four issues of one journal in four different years, may
of fragmentation, prioritisation and motivation for education scholarship
not be sufficient to detect changes that require a greater amount of
among medical faculty. Med Educ. 2008;42(9):872-8.
time, eg, changes resulting from key authors changing, changes
in leadership, or changes to the practice environment. 4. Yarris LM, Juve AM, Artino AR, et al. Expertise, time, money,
mentoring, and reward: systemic barriers that limit education
CONCLUSION researcher productivity: proceedings from the AAMC GEA Workshop. J
By performing a social network analysis of the WestJEM Grad Med Educ. 2014;6(3):430-6.
Special Issue in Educational Research and Practice, we sought 5. Scott J. Social network analysis. Sociology. 1988;22(1):109–27.
to identify patterns of collaboration within the institutional 6. Otte E, Rousseau R. Social network analysis: a powerful strategy, also
authorship groups and, additionally, to understand which for the information sciences. J Inf Sci. 2002;28(6):441–53.
Volume 21, no. 6: November 2020 247 Western Journal of Emergency MedicineSocial Network Analysis of WestJEM Education Issues Cyrus et al.
7. Dow AW, Sewell DK, Lockeman KS, et al. Evaluating a center for Social and Behavioral Sciences. In Wasserman S and Faust K
interprofessional education via social network analysis. Acad Med. (Eds.), Social Network Analysis: Methods and Applications. (3-27).
2020;95(2):207-12. Cambridge: Cambridge University Press.
8. Warm E, Arora VM, Chaudhry S, et al. Networking matters: a social 13. Ergün E and Usluel YK. An analysis of density and degree-centrality
network analysis of the Association of Program Directors of Internal according to the social networking structure formed in an online
Medicine. Teach Learn Med. 2018;30(4):415-22. learning environment. Educ Technol Soc. 2016;19(4):34-46.
9. Love JN, Santen SA, Way DP, et al. Early impact of the Western Journal 14. Keating N, Ayanian J, Cleary P, et al. Factors affecting influential
of Emergency Medicine CDEM/CORD Special Issue in Educational discussions among physicians: a social network analysis of a primary
Research & Practice. West J Emerg Med. 2020;21(1):71-7. care practice. J Gen Intern Med. 2007;22(6):794-8.
10. Borgatti SP and Cross R. A relational view of information seeking and 15. Shapiro J, Zhang B, Warm EJ. Residency as a social network:
learning in social networks. Manag Sci. 2003;49(4):432–45. burnout, loneliness, and social network centrality. J Grad Med Educ.
11. Lowes S, Lin P, Wang Y. Studying the effectiveness of the discussion 2015;7(4):617-23.
forum in online professional development courses. J Interact Online 16. Love JN, Yarris LM, Santen SA, et al. A novel specialty-specific,
Learn. 2007;6(3):181-210. collaborative faculty development opportunity in education research:
12. Wasserman S and Faust K. (1994). Social Network Analysis in the program evaluation at five years. Acad Med. 2016;91(4):548-55.
Western Journal of Emergency Medicine 248 Volume 21, no. 6: November 2020You can also read