TATOO: Testing and Analysis Tool for - Object-Oriented Software
←
→
Page content transcription
If your browser does not render page correctly, please read the page content below
TATOO: Testing and Analysis Tool for
             Object-Oriented Software

 Amie L. Souter1 , Tiffany M. Wong2 , Stacey A. Shindo1 , and Lori L. Pollock1
                 1
                     Department of Computer and Information Sciences
                        University of Delaware, Newark, DE 19716
                       {souter, pollock, shindo}@cis.udel.edu
                           2
                              Department of Computer Science
                         Dartmouth College, Hanover, NH 03755
                             Tiffany.M.Wong@dartmouth.edu

       Abstract. Testing is a critical component of the software development
       process and is required to ensure the reliability, robustness and usability
       of software. Tools that systematically aid in the testing process are cru-
       cial to the development of reliable software. This paper describes a code-
       based testing and analysis tool for object-oriented software. TATOO pro-
       vides a systematic approach to testing tailored towards object behavior,
       and particularly for class integration testing. The underlying program
       analysis subsystem exploits combined points-to and escape analysis de-
       veloped for compiler optimization to address the software testing issues.

1    Introduction

Testing is a critical component of the software development process and is re-
quired to ensure the reliability, robustness and usability of software. Unfortu-
nately, testing, and in particular ad hoc testing, is labor and resource intensive,
accounting for 50%-60% of the total cost of software development[13]. There-
fore, it is imperative that testing techniques be developed that provide as much
automation and ease of use as possible. In particular, tools that systematically
aid in the testing process are crucial to the development of reliable software.
    Object-oriented features enable the programmer to design and develop soft-
ware that is reusable and modular. Encapsulation, inheritance, and polymor-
phism are extremely useful to the programmer, but create difficulties for the
tester. Encapsulation allows the programmer to create classes with state and
functionality. All instantiated classes possess different state at different times
through a program’s execution, requiring many different test cases in order to
adequately test the states of different objects. Complex class interactions are
introduced through inheritance and class composition. These interactions also
need to be tested, requiring test cases to exercise the complexities of these class
relationships. Dynamic binding caused by polymorphism creates additional com-
plexities when testing object-oriented software. A single polymorphic call site
represents potential calls to one of a number of different methods with the same

T. Margaria and W. Yi (Eds.): TACAS 2001, LNCS 2031, pp. 389–403, 2001.

c Springer-Verlag Berlin Heidelberg 2001
390 Amie L. Souter, Tiffany M. Wong, Stacey A. Shindo, and Lori L. Pollock
name. Each possible receiver type must be executed in order to adequately test
a program.
In this paper, we present a Testing and Analysis Tool for Object-Oriented
programs, TATOO, which embodies our novel code-based testing method focused
on object manipulations[16]. Our tool establishes an environment to systemati-
cally test programs by providing: (1) automatically generated test tuples based
on object manipulations, (2) test coverage information through code instrumen-
tation and test coverage identification, (3) feedback about external influences
that may affect the correctness of the testing runs, and (4) visualization of the
underlying program representation that shows the interactions of objects in a
program.
TATOO is composed of two subsystems: program analysis and testing. The
program analysis subsystem’s main objective is to produce the program rep-
resentation needed for the testing subsystem. The testing subsystem generates
the test tuples needed for generating test cases as well as provides test cover-
age information. In addition, the testing subsystem controls the user interface
environment.
TATOO is a prototype tool implemented in Java, consisting of several com-
ponents:
– The extended FLEX compiler infrastructure[11], which translates the source
program into a program representation useful for testing.
– A test tuple generator that generates paths based on object manipulations.
– A Java graphical user interface that displays the source code and information
corresponding to the component under test.
– The daVinci toolkit[8], which displays the program representation in a high
quality manner, and facilitates communication with the Java GUI, allowing
interaction between the graphical program representation and the source
code and testing information.
– A code instrumentation tool.
– A trace analyzer, which provides coverage information about an executed
program based on a given set of test tuples.
The major contribution of this work is a systematic framework for integration
testing. The framework is based on a testing technique that focuses on object
manipulations, and is capable of analyzing incomplete programs. Unlike previous
work, the technique addresses the common situation of instance variables being
objects and not primitive types.
The remainder of this paper is organized as follows. Section 2 provides back-
ground information on testing and object manipulations. An overview of TATOO
is given in Section 3. Sections 4 and 5 describe the details of the TATOO subsys-
tems. In Section 6, we evaluate the overhead attributed to the use of the program
representation. Finally, we conclude with possible extensions to the tool.TATOO: Testing and Analysis Tool for Object-Oriented Software 391
2 Underlying Testing and Analysis Technique
There are two main testing philosophies, namely, black-box and white-box testing.
Black-box testing [2] does not use any knowledge of the internals of a program.
The program is a black-box in which information about the source code is un-
known; we only know what is provided from a program specification. Black-box
tests are designed to uncover errors, but the focus of such testing is on verifying
that a specified function operates according to the specification. Black-box test-
ing has also been referred to as functional testing or specification-based testing.
White-box, structural, or code-based testing techniques are based on knowl-
edge of the code. White-box testing is not an alternative to black-box testing; in
fact, they complement each other and both should be performed. Test cases are
derived through examining the program code and using well-defined data flow
or control flow information about the program. Control flow-based techniques
are motivated by the intuition that covering different control-flow paths would
exercise a large proportion of program behaviors. For example, branch testing [7]
is a control flow based testing method, which is based on exercising all the true
and false outcomes of every branch statement. The general idea behind data
flow testing [14,10], is to generate test data based on the pattern of data used
throughout a program.
Data flow testing is based on the premise that testing paths that read and
write values stored into the same memory locations tests the behavior of a pro-
gram in terms of its manipulation of data. More specifically, data flow testing is
based on def-use pairs in a program, where a def of a variable is an assignment
of a value to the variable via a read or assignment operation, and a use of a
variable is a reference to the variable, either in a predicate or a computation.
A def-use pair for variable v is an ordered pair (d,u) where d is a statement in
which v is defined and u is a statement that is reachable by some path from d,
and u uses v or a memory location bound to v. Data flow testing uses def-use
pairs in order to generate paths through the definition and use statements in the
code. Then test data is generated based on those paths. The idea is that for each
definition in the program, we want to exercise all of the uses of the definition.
Systematic testing techniques are categorized into different levels of testing.
First, unit testing of object-oriented programs focuses on validating individual
classes. As classes are combined or integrated together, integration testing is
performed to validate that the classes function appropriately when combined
together. Our research has focused on extending data flow testing to the object-
oriented domain with special concern for testing instance variables that are ob-
jects and code-based integration testing of object-oriented components.
2.1 Object Manipulation-Based Testing
Our approach to code-based testing of object-oriented software seeks to provide
coverage in terms of the elemental read and write actions, which is similar to data
flow testing. We call our approach the OMEN approach, because it is based on392 Amie L. Souter, Tiffany M. Wong, Stacey A. Shindo, and Lori L. Pollock
covering basic Object Manipulations in addition to using Escape iNformation to
provide helpful feedback to the tester in an interactive testing tool environment.1
Object-oriented programming focuses on the data to be manipulated rather
than the procedures that do the manipulating. An object-oriented program
achieves its goals by creating objects of specific classes. The state of an ob-
ject is encapsulated as a copy of all of the fields of data that are defined in the
corresponding class definition. Actions are performed on an object by invoking
methods defined in the class definition, often called sending a message to the
object. A method invocation can modify and/or read the data stored in the
particular object.
Table 1. Basic object manipulations.
Object-related Statements Object Manipulations
copy r1 = r2 read of reference r2
write to reference r1
load r1 = r2 .f read of reference r2
read of field r2 .f
write to reference r1
store r1 .f = r2 read of reference r2
read of reference r1
write to field r1 .f
global load r = cl.f read of class variable f
write to reference r
global store cl.f = r read of reference r
write class variable cl.f
return r read of reference r
object creation create a new object
r = new Object(....) write to reference r
MOD and USE
method invocation write to reference r
r = r0 .methodname(r1 ,..., rn ) read of references r0 -rn
MOD and USE of r0 ’s
fields
In order to better understand the possible behaviors of an object-oriented
program in terms of object manipulations, we identify the most elemental ob-
ject manipulation as either a read or write action. The actions that a particular
statement or method performs on an object can be decomposed into a sequence
of these elemental actions. Table 1 depicts the elemental object manipulations
performed by each object-related statement. We assume that the program has
been preprocessed such that all statements that perform object manipulations
1
In addition, we view the test cases and the results of executing the test cases as
an omen to predicting the behaviors of the executing program in the production
environment.TATOO: Testing and Analysis Tool for Object-Oriented Software 393
have been expressed in the form of these basic statements. Due to aliasing and
polymorphism, we may have a set of objects potentially referenced by each refer-
ence, but for these descriptions, we use the singular form. However, our analysis
addresses the potential for a set of objects being referenced.
We extrapolate the concept of data flow testing to the testing of elemental
object manipulations by defining a (write, read) association of a given object’s
state, extending this association to include object creation points. From Table 1,
we can see that the statement that reads an object field is the load statement,
while the store statement writes to an object field. To ensure that we do not miss
any viable (write, read) pairs, we assume that a given load/store statement may
read/write the field of any object which the reference is potentially referencing
at that program point. Because objects are instantiated at run-time through
executable statements, we extend (write, read) pairs to triples of the form (write,
read, object creation) to reflect the fact that a test case should cover the creation
of the object before any writes or reads to that object.
2.2 Using Escape Analysis Information
Escape analysis is a relatively new technique used for optimizing object-oriented
codes, particularly Java codes[17,6,3,4]. The analysis is used to determine which
synchronization operations are unnecessary and could be eliminated, as well as
for reducing the number of objects that are unnecessarily allocated on the heap
when they could be allocated on the stack.
We use escape analysis for testing, in order to provide useful feedback to the
tester. For example, when a program is being tested and errors are uncovered,
the tester or developer needs to find the cause of the error, i.e., debug the code.
Our key insight is that the escape information will provide useful feedback to the
tester about possible problem areas, where objects interact with outside code,
which may be causing inadvertent changes to an object.
3 TATOO System Architecture
TATOO provides a tester with an interactive testing environment to systemati-
cally test software using the OMEN testing technique. The prototype testing tool
allows the tester to visualize a graphical representation of the program, which
characterizes how objects interact with other objects. In addition, the testing
tool provides the tester with both visual and report-based coverage information
about the program under test. TATOO also provides information about how ob-
jects interact with unanalyzed portions of code, as well as where objects may
potentially escape through method calls or return statements. This information
is useful in determining potentially fault prone sections of code.
The tool architecture is composed of two main subcomponents, namely the
program analysis subsystem and the testing subsystem, as shown in figure 1. The
program analysis subsystem performs the required analysis to obtain the anno-
tated points-to escape (ape) graph program representation described in section394 Amie L. Souter, Tiffany M. Wong, Stacey A. Shindo, and Lori L. Pollock
4.1. In addition, a term representation used to view the ape graph, and an anno-
tation table which maintains the required information necessary for the testing
subsystem are generated. After program analysis is performed, the testing sub-
component computes test tuples for testing the program component under test.
In addition, the testing subcomponent provides a graphical user interface en-
vironment that supports two primary features: test coverage identification and
program representation visualization. The test coverage identifier provides an
environment that lets the user execute the program and then visualize coverage
information. Alternatively, the primary purpose of the program representation
visualizer is to allow the user to visualize object interactions.
e In
d Tester pu
Co tD
rce at
S ou a
APE Graph
Program Testing
Analysis Term Representation
Subsystem Subsystem
Annotation Table
Fig. 1. Overall tool architecture.
4 Program Analysis Subsystem
Figure 2 depicts the subcomponents of the program analysis subsystem. Java
bytecode produced from any Java source compiler is the input to the program
analysis subsystem. The FLEX static analyzer [11] translates the Java byte code
into an intermediate format based on object manipulations, and then performs
points-to analysis to construct the Annotated Points-to Escape (ape) graph [16].
Annotations necessary for calculating read-write relationships between fields of
objects are an important aspect of the ape graph.
The ape graph object, produced by the FLEX static analyzer, is then parsed
to construct a graphical term representation needed to visually display the ape
graph. In addition, a textual representation of the annotation table is generated,
which consists of the annotations for each edge in the ape graph. The final
output of the program analysis subsystem is the ape graph object, the ape graph
graphical representation, and the annotation table.TATOO: Testing and Analysis Tool for Object-Oriented Software 395
Term Representation
Java Source Java compiler Java FLEX APE Parser
Code Bytecode Static Analyzer Graph
AnnotationTable
Fig. 2. Program analysis subsystem.
4.1 Ape Graph Program Representation
To develop the ape graph program representation, we extended and modified
the points-to escape graph program representation [17] to exploit its ability to
mimic object manipulations. The points-to escape graph representation com-
bines points-to information about objects with information about which object
creations and references occur within the current analysis region versus outside
this program region. For our purposes, the current analysis region is the current
component under test (CUT), where a component is not necessarily a class or
method, but any grouping of methods. The points-to information characterizes
how local variables and fields in objects refer to other objects. The escape in-
formation can be used to determine how objects allocated in one region of the
program can escape and be accessed by another region of the program.
In the points-to escape graph, nodes represent objects that the program
manipulates and edges represent references between objects. Each kind of object
that can be manipulated by a program is represented by a different set of nodes
in the points-to escape graph. There are two distinct kinds of nodes, namely,
inside and outside nodes. An inside node represents an object creation site for
objects created and reached by references created inside the current analysis
region of the program. In contrast, an outside node represents objects created
outside the current analysis region or accessed via references created outside
the current analysis region. There are several different kinds of outside nodes,
namely, parameter nodes, load nodes, and return nodes.
The distinction between inside and outside nodes is important because it
is used to characterize nodes as either captured or escaped. A captured node
corresponds to the fact that the object it represents has no interactions with
unanalyzed regions of the program, and the edges in the graph completely char-
acterize the points-to information between objects represented by these nodes.
On the other hand, an escaped node represents the fact that the object escapes
to unanalyzed portions of the program. An object can escape in several ways.
A reference to the object was passed as a parameter to the current method, a
reference to the object was written into a static class variable, a reference was
passed as a parameter to an invoked method and there is no information about
the invoked method, or the object is returned as the return value of the current
method.
There are also two different kinds of edges. An inside edge represents ref-
erences created inside the current analysis region. An outside edge represents
references created outside the current analysis region.396 Amie L. Souter, Tiffany M. Wong, Stacey A. Shindo, and Lori L. Pollock
We have extended the points-to escape graph by adding annotations to edges
in the graph. The annotations provide information about where basic object
manipulations i.e., loads and stores of objects, occur within a program. Using
the annotations, we are able to compute store-load i.e., (write-read) pairs for
the objects in the program, which can be used in a manner similar to data flow
testing.
For each method in the CUT, we build one ape graph per method. For each
load/store of the reference represented by a particular edge e in an ape graph,
we maintain:
– a sequence of statement numbers, (s1 , s2 , ..., sn ), where sn is the unique state-
ment number of the load/store statement; s1 , s2 , ...sn−1 contains the state-
ment numbers of the call sites where this edge was merged into the caller’s
ape graph during interprocedural analysis performed during construction of
the current method’s ape graph. Statement s1 is the statement number of
the call site within the current analysis method which eventually leads to
the load/store statement.
– a corresponding sequence of statement numbers, (evs1 , evs2 , ...evsn ), where
each evsi is the unique number of the earliest statement at which the state-
ment si could have an effect on other statements. We call this the earliest
visible statement for si , evsi . The earliest visible statement evsi = si when
the statement si is not inside a loop; otherwise evsi = the statement number
of the header of the outermost loop containing si .
4.2 Example Annotation Construction
Figure 3 shows an example set of annotations added to a single edge of an ape
graph. The nodes in this graph represent objects created within the current anal-
ysis region; therefore, they are both inside nodes. The edge labeled top represents
a reference from a field named top of the object of type Stack, annotated with
both a load and store annotation. The annotations indicate that there exist both
a load and store of the field top. Further, the location where the load and store
occurs is maintained through the annotations. The annotation, (store 25-13-3),
represents two calls, one invoked on line 25 of the program. The second call
invoked on line 13 can lead to a store of an object into the field top at line 3.
Similarly, the load of the field top occurs at line 7, following a chain of calls from
lines 27 and 14. The above example does not include evs statement numbers,
but they would be maintained in the same manner.
The annotation chains are easily constructed because the ape graphs for
individual methods of the CUT are built during a reverse topological traversal
over the call graph. Therefore, a callee’s graph is always constructed before its
callers’ graphs. When constructing a caller’s graph, the callees’ annotations are
simply merged into the caller’s graph at the appropriate call site.
To emphasize the expressiveness of the ape graph, we include a complete ape
graph for a simple method. Figure 4 illustrates the ape graph for method push.
The black nodes represent outside nodes and the white nodes represent insideTATOO: Testing and Analysis Tool for Object-Oriented Software 397
top store: 25-13-3
load: 27-14-7
Object of type Stack Object of type Data
Fig. 3. Illustration of ape graph annotation.
1: public push(Object e) {
2: if(top == null) data, 5-29-25, store
3: top = new Node(e, null); e data 3-
7, store
4: else next, 3-8, store
5: top = top.insert(e); } tore
top, 3, s
6: Node (object e, Node n){ top, 5, store
7: data = e; this
8: next = n; } top,
2, lo
a d next, 5-29-26, store
Fig. 4. Example of complete ape graph for a single method.
nodes. The graph was built by processing each statement in the method push.
The constructor call to Node on line 3 maps the nodes from the Node graph
into the ape graph for push, creating the edges (data, 3-7, store) and (next, 3-8,
store). The annotations 3-7 and 3-8 indicate that a store occurred on lines 7 and
8, through a call at line 3. A similar mapping occurs at line 5, through the call
to insert creating the other data and next edges. Due to space limitations, the
code for the method insert does not appear.
APE Graph
Test Tuple Term Representation
Generator
Annotation Table Test
Tuples
GUI &
daVinci
Test Event
Coverage Manager Graph
Identifier Visualizer
Fig. 5. Testing subsystem.398 Amie L. Souter, Tiffany M. Wong, Stacey A. Shindo, and Lori L. Pollock
5 Testing Subsystem
The testing subsystem, shown in figure 5, takes as input the ape graph object,
the term representation necessary for graphically viewing the ape graph, and
the annotation table, all generated from the program analysis subsystem. The
following subsections describe the components of the testing subsystem, namely
the test tuple generator and the test coverage identifier.
5.1 Test Tuple Generator
Algorithm 1. Compute testing tuples for a component represented by a set of
call graphs, each with possibly multiple roots.
Input: set of call graphs and ape graphs for the CUT;
Output: set of test tuples for the CUT and feedback on potential influences from outside the CUT;
1: /* Process each method’s ape graph */
2: foreach node n in a topological ordering of call graph nodes do
3: Let m = method represented by node n;
4: foreach edge e labeled STORE in m’s ape graph do
5: /* Create tuples from stores in ape graph */
6: Identify associated loads, labeling e, occurring after the STORE
7: /* Using node type and escape information create tuple or report feedback */
8: if source node of e is an inside node then
9: Replace tuple (store,load) by (cssn ,store,load);
10: else /*source node is an outside node*/
11: Feedback(object for (store,load) is potentially created outside CUT);
12: if source node not escaped and target node is escaped then
13: Feedback(value loaded in (cssn ,store,load)
is potentially changed by method outside CUT, but l is indeed referencing object created
at cssn );
14: endfor
15: foreach edge e in ape graph labeled only by LOAD do
16: if target node is a load node in APE graph then
17: Feedback(load at statement csl in method m has potentially reaching references from
outside CUT);
18: endfor
19: endfor
The test tuple construction algorithm, shown in Algorithm 1, computes a
set of test tuples for the component under test(CUT), based on object manip-
ulations. Starting at the root of each call graph of the CUT and proceeding in
topological order, the method for each call graph node is processed once, by
analyzing the node’s ape graph. This processing order avoids creating duplicate
tuples potentially identified due to subgraphs of invoked methods also appearing
in a caller’s ape graph. As a particular ape graph is analyzed, only unmarked
edges (those not already processed in a caller’s graph) are processed.
The algorithm processes each edge in a method’s ape graph. For each annota-
tion on an ape graph edge representing a store, the associated loads potentially
occurring after the store are identified, and a (store,load) tuple is created. The
annotations reflect the results of the flow sensitive points-to escape analysis usedTATOO: Testing and Analysis Tool for Object-Oriented Software 399
to build the ape graph. Thus, the evs and cs statement numbers on these anno-
tations are adequate to identify the reachable loads from a particular store. The
object creation site associated with the (store,load) tuple is determined by the
source node of the edge being analyzed. If the source node is an inside node, then
the source node is the object creation site and the node number of the source
node is used to complete the tuple for the (store,load) tuple. If the source node
is an outside node, then the object is not created inside CUT, and feedback is
given depending on the kind of the source node and whether it is interior or root
of the call graph. Additionally, feedback is given when the target node of the
ape graph edge being analyzed is escaped from CUT.
The algorithm also provides feedback for load nodes when a corresponding
store is not present in CUT. This is represented by an ape graph edge that
is labeled only with load annotations and no store annotations. The feedback
provides the tester with information about the fact that an object creation site
could have potentially occurred outside CUT, as well as the possibility that the
load in CUT has potentially reaching references from outside CUT.
5.2 Test Coverage Identifier
Source Code Test Tuple Table
T Code
EN
M Instrumenter
RU
ST
GUI & IN
Event Instrumented
RU output
Manager N Source Code
Test Tuple Coverage
JVM Trace Analyzer
Trace Report
input data
Fig. 6. Test Coverage Identifier.
The test coverage identifier provides an environment useful for providing
test coverage information about the component under test. Figure 6 illustrates
the subcomponents of the test coverage identifier. There are two user events,
INSTRUMENT and RUN, which the event manager understands. An INSTRU-
MENT event invokes the code instrumenter, which takes the program source
code and test tuple table as input. The source line numbers corresponding to
the store-load-object creation site form the entries of the test tuple table, pro-
viding all the information necessary to instrument the source code. Simple print
statements are inserted into the source code to produce instrumented code. The400 Amie L. Souter, Tiffany M. Wong, Stacey A. Shindo, and Lori L. Pollock
second event, RUN, invokes the component under test, prompting the user, if
necessary, for input data, running the program on the JVM, and generating a test
tuple trace file, in addition to the normal output of the program. The test tuple
trace file is generated by running the instrumented source code, which provides
information about the test tuples covered during the program execution.
Currently, we maintain coverage information for one run of the program.
In the future, we will maintain information for multiple runs of the program,
therefore providing more coverage information for the test suite of programs
running on the component under test. The trace analyzer currently provides
visual coverage information by analyzing the test tuple trace file and highlighting
the source code and the corresponding test tuples that were covered during the
program execution.
5.3 Ape Graph and Test Tuple Visualizer
The primary function of TATOOs ape graph and test tuple visualizer is for visual-
izing the ape graph representation of the CUT, which graphically displays object
interactions. This subsystem is composed of the daVinci toolkit[8], a graphical
user interface, and an event manager that communicates with daVinci, providing
interaction between the source code, ape graph, annotations, and test tuples.
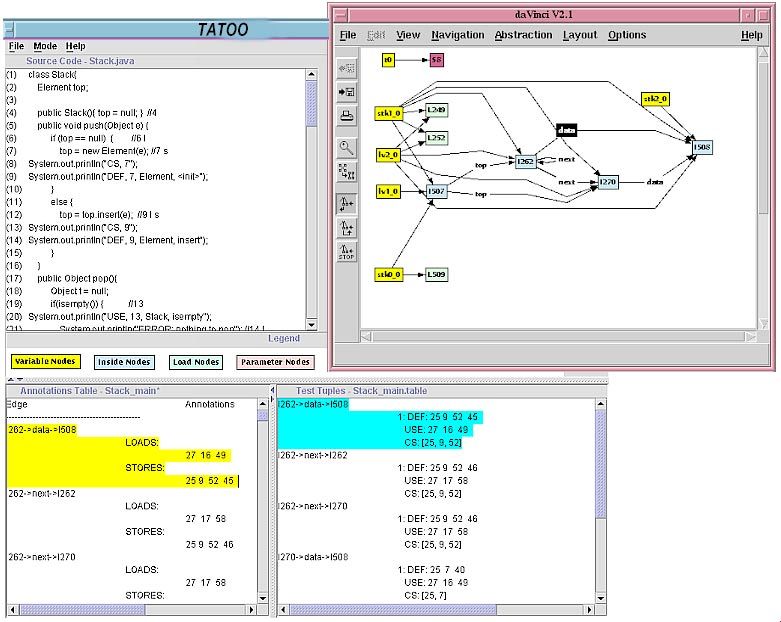
Fig. 7. The TATOO user interface including daVinci.TATOO: Testing and Analysis Tool for Object-Oriented Software 401
Visualization of the ape graph is achieved through the daVinci graph draw-
ing tool, which is an X-Window visualization tool for drawing high quality
directed graphs automatically[8]. The term representation, produced by the
program analysis subsystem, is the graphical representation used as input to
daVinci. DaVinci not only displays the graph, but allows interaction between
the graph and an external program. Our event manager communicates with
daVinci through the API defined by the daVinci toolkit.
The graph visualizer interface of TATOO is shown in figure 7. A user can view
the source code for a class, the annotations and test tuples produced for that
class, and a graphical representation of the ape graph. In addition, the user is
able to selectively view the ape graph and the source code, annotations, and test
tuples corresponding to the selected graph segment. For example, a user can click
on an edge in the daVinci graph window, and the source code, annotations, and
test tuples corresponding to the selected edge are highlighted in their respective
windows. The graph visualizer allows for a fine grain level of detail correspond-
ing to how objects interact with other objects in a program. Its usefulness stems
from the ability to statically visualize an object’s fields and the points-to re-
lationships constructed throughout the program. The escape information could
also be visualized in a similar fashion, allowing for the user to click on the escape
information, which would identify the region of code and the section of the graph
that an object could escape through. The escape information is available to us,
but this capability has not been included in our current prototype testing tool.
6 Implementation and Evaluation
TATOO has been implemented in Java and evaluated with a set of Java programs.
Table 2 shows some general characteristics of the benchmark programs we have
used with TATOO, as well as the storage requirements necessary for the ape
graph. The characteristics include the number of lines of user code, the number
of JVM instructions, the number of classes analyzed, and the number of methods
analyzed. We have reported these numbers separately for user and library sizes
in order to show that a relatively small program may rely heavily on libraries;
therefore, analysis of the user program depends not only on the user code, but
on the library code as well.
Table 2. Program characteristics and storage requirements.
Name Problem Domain # of jvm instr classes methods ave size(Kb) max
lines User Lib User Lib User Lib User Lib size(Kb)
compress text compression 910 2500 7070 17 90 50 301 6.1 1.1 43.0
db database retrieval 1026 2516 11648 9 100 240 306 14.5 0.9 98.6
mpeg audio decompr 3600 12019 7188 49 92 58 383 5.9 1.0 201
jlex scanner generator 7500 11000 7250 19 72 106 264 22.6 1.0 379
jess expert system 9734 15200 13005 108 105 468 436 13.9 1.1 668402 Amie L. Souter, Tiffany M. Wong, Stacey A. Shindo, and Lori L. Pollock
One concern in developing a code-based testing tool is the overhead of the
underlying static analysis. We have experimentally evaluated the space overhead
of our static analysis. The last three columns of table 2 show the average storage
requirements of the ape graph per method (user and library), and the maximum
ape graph storage requirement per benchmark. We computed the storage re-
quirements by computing the sum of two products. The first product is the total
number of nodes over all the ape graphs times the size of an ape graph node, and
the second product is the total number of edges over all the ape graphs times
the size of an edge. The storage requirement per ape graph is relatively small.
The compositional nature of the ape graphs avoids the requirement of keeping
all ape graphs in memory at once. The maximum ape graph represents the size
needed to maintain the main method of the program. Essentially, the maximum
ape graph contains the graphs from all of its callees, which were merged into
itself.
The test tuple construction algorithm takes one pass over the call graphs rep-
resenting the CUT. For each node in the call graph, it processes each unmarked
edge of the ape graph for that method exactly once. The ape graph is easily
extendible and the computation of additional test tuples can be performed in a
demand-driven way as clients are added.
7 Related Work
Two proposed code-based testing tools based on data flow testing techniques in-
clude the Coupling Based Coverage Tool (CBCT)[1] and Orso’s testing tool[12].
CBCT is a coverage-based testing tool that reports coverage metrics to the user,
by instrumenting the source code. CBCT is based on a coupling-based testing
technique, which is a data flow method based on coupling relationships that
exist among variables across call sites, and is useful for integration testing. To
our knowledge, CBCT has not been implemented. Orso’s testing technique for
integration testing is based on a data flow testing technique used for integra-
tion testing, in particular for polymorphic test coverage[12]. His tool is similar
to ours, but uses a different program representation, which does not provide
testing feedback to the user. There is also no mention of how they deal with
references or instance variables that are objects of different types in Java code.
Previous work on structural testing of object-oriented software has concen-
trated on data flow analysis for computing def-use associations for classes[9],
testing of libraries in the presence of unknown alias relationships between pa-
rameters and unknown concrete types of parameters, dynamic dispatches, and
exceptions[5], and developing a set of criteria for testing Java exception handling
constructs[15].
8 Conclusions and Future Work
We have presented TATOO, a testing and analysis tool for object-oriented soft-
ware. The primary benefits of this tool are its ability to automatically generateTATOO: Testing and Analysis Tool for Object-Oriented Software 403
code-based test tuples for testing, to determine test coverage through code in-
strumentation and test coverage notification, to provide feedback to the tester
about external object interactions that could affect their result, and to visually
display object interactions through the daVinci graph drawing tool.
In the future, we plan on extending this work in several ways. First, we plan
on designing and implementing a new component to TATOO which automatically
or semi-automatically generates test cases from the test tuples. Then, we plan
to perform an experimental evaluation on different variations of the OMEN
approach. Finally, we plan on designing and implementing a regression testing
component for TATOO which will indicate portions of code that need to be
re-tested after modifications have been made to the original code.
References
1. R. Alexander. Testing the polymorphic relationships of object-oriented compo-
nents. Technical report, George Mason University, 1999.
2. B. Beizer. Software Testing Techniques. Van Nostrand Reinhold, 2nd edition, 1990.
3. B. Blanchet. Escape analysis for object oriented languages. Application to Java.
In Proceedings of OOPSLA, November 1999.
4. J. Bodga and U. Hoelzle. Removing unnecessary synchronization in Java. In
Proceedings of OOPSLA, November 1999.
5. R. Chatterjee and B. Ryder. Data-flow-based Testing of Object-Oriented Libraries.
Technical Report 382, Rutgers University, March 1999.
6. J. Choi, M. Gupta, M. Serrano, V. Sreedhar, and S. Midkiff. Escape analysis for
Java. In Proceedings of OOPSLA, November 1999.
7. T. Chusho. Test Data Selection and Quality Estimation Based on the Concept of
Essential Branches for Path Testing. IEEE Transaction on Software Engineering,
13(5):509–517, May 1987.
8. M. Fröhlich and M. Werner. The Graph Visualization System daVinci. Technical
report, Universität Bremen, Germany, September 1994.
9. M.J. Harrold and G. Rothermel. Performing Data Flow Testing on Classes. In
Proceedings of the Symposium on the Foundations of Software Engineering, 1994.
10. M.J. Harrold and M.L. Soffa. Interprocedural Data Flow Testing. In Proceedings
of the ACM Symposium on Testing, Analysis, and Verification, 1989.
11. M. Rinard et. al. FLEX. www.flex-compiler.lcs.mit.edu, 2000.
12. A. Orso. Integration Testing of Object-Oriented Software. PhD thesis, Politecnico
Di Milano, 1999.
13. W. Perry. Effective Methods for Software Testing. John Wiley Inc, 1995.
14. S. Rapps and E. Weyuker. Selecting Software Test Data Using Data Flow Infor-
mation. IEEE Transactions on Software Engineering, 11(4):367–375, April 1985.
15. S. Sinha and M.J. Harrold. Criteria for Testing Exception-Handling Constructs
for Java Programs. In Proceedings on Software Maintenance, January 1999.
16. A. Souter and L. Pollock. OMEN: A Strategy for Testing Object-Oriented Soft-
ware. In Proceedings of the International Symposium on Software Testing and
Analysis, August 2000.
17. J. Whaley and M. Rinard. Compositional Pointer and Escape Analysis for Java
Programs. In Proceedings of OOPSLA, November 1999.You can also read