FY21 Half Year Results - 7 December 2020 - AFR
←
→
Page content transcription
If your browser does not render page correctly, please read the page content below

FY21
Half Year Results

7 December 2020
About Metcash

   Our purpose                       Our vision                              Our values

                                             Best store in town

     Championing                             Passionate about independents
                                                                              We believe
                                                                              Independence is worth fighting

     Successful                                                               for; in treating our people,
                                                                              retailers and suppliers the way

     Independents
                                             A favourite place to work        we like to be treated; and in
                                                                              giving back to the communities
                                             Business partner of choice       where we live and work.

                                             Support thriving communities

2 2FY20 FullFY21
             Year Results
                 Half Year Results
Group update and
    Pillar results
    Jeff Adams
    Group Chief Executive Officer

                                    3
3   FY20 Full Year Results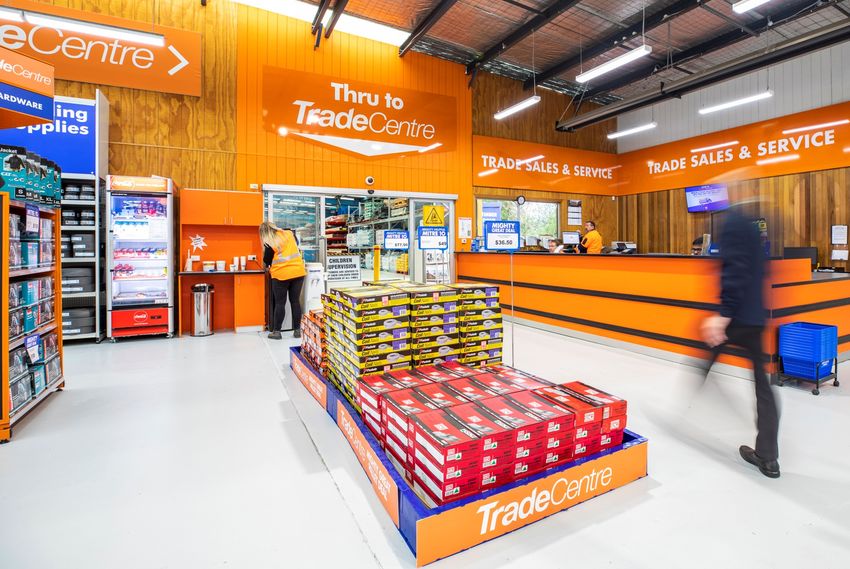
Adapted to COVID-19 challenges
Metcash is extremely proud of how its employees, suppliers and customers have responded to the evolving COVID-19 restrictions and the
unprecedented demand across all Pillars
Pillars adapted to strictly follow COVID Safe work practices, while meeting elevated levels of demand from customers and continuing to deliver key
MFuture strategic initiatives
Key priorities during this period were:
Health and safety of employees and customers
Ensuring supply chain to independent network continued to operate efficiently
Maintaining financial strength to support the network and invest in growth
The Group quickly adapted to the evolving working environment and restrictions
Non-warehouse employees working remotely
Additional investment in safety equipment and social distancing for warehouse workers
Major DCs have been fully operational throughout the period
Implemented Click & Deliver to service Hardware DIY customers in metro Melbourne
Contactless receiving and despatch implemented in DCs
4 FY21 Half Year Results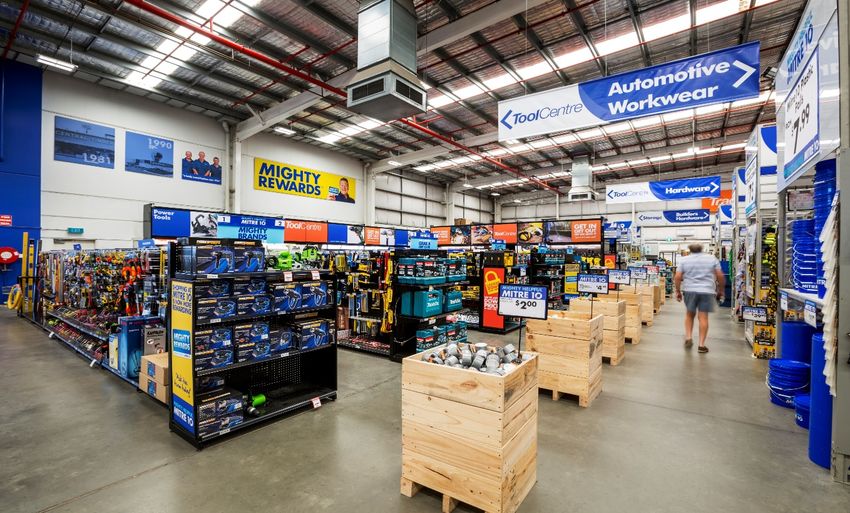
Adapted to COVID-19 challenges continued
Metcash invested to support the independent retail network
Launched online retail offering for both Food and Liquor
Successful transition to new DC in South Australia
Continued investment in MFuture initiatives despite more challenging work environment and COVID restrictions
Financial support to those retailers impacted by trading restrictions
Incurred higher operating costs during the period to strictly follow COVID Safe work practices
There continues to be a significant change in shopping behaviours with more customers shopping ‘local’
5 FY21 Half Year Results
Group highlights
Significant growth in sales volumes across all Pillars
Strong earnings growth with underlying Group EBIT up 30.4% to $203.0m
Group revenue increased 12.2% to $7.1bn and 12.3% to $8.1bn including charge-through sales
Strong sales growth underpinned by investment in MFuture initiatives
Food – move to ‘shop local’ and the improved competitiveness of retailers resulted in an increase in both foot traffic and average basket size
Liquor – high levels of demand across the retail stores more than offset the adverse impact of trading restrictions on ‘on-premise’ customers
Hardware – elevated demand from DIY customers and a return to growth in Trade
Underlying profit after tax increased 43.0% to $129.6m
1
Statutory profit after tax of $125.1m (1H20: Loss of $151.6m )
Strong cash generation and efficient management of working capital
Positive operating leverage supported through efficient management of costs while investing in COVID Safe
work practices
COVID related costs have been well managed and were ~$8m in 1H21
Continued investment in growth opportunities, including the acquisition of Total Tools (‘TTH’) and the Kollaras
private label business
Sales momentum has continued into 2H21 with strong growth in first five weeks
Increase in interim dividend to [8.0] cents per share (1H20: 6.0 cents)
Strong earnings leverage – Revenue ↑ 12.3%; Earnings ↑ 30.4%
1. Statutory loss after tax in 1H20 includes an impairment of goodwill and other assets of $237.4m (post tax)
6 FY21 Half Year Results
Results overview by pillar
                                                                                1H21      1H20     Change   Sales revenue (%)
                                                                                                                                  *

                                                                                 $m        $m          %
   Sales revenue (including charge-through sales)                                                                                              Food
   Food                                                                       4,795.9    4,381.1     9.5%          16%                         Liquor
   Liquor                                                                     2,039.1    1,784.2    14.3%                                      Hardware
   Hardware                                                                   1,258.9    1,044.2   20.6%    25%
                                                                                                                              59%
   Total sales revenue (including charge-through sales)                       8,093.9    7,209.5   12.3%
   Less: Charge-through sales                                                (1,034.2)   (919.7)    12.4%
   Total sales revenue (Statutory Accounts)                                   7,059.7    6,289.8    12.2%
                                                                                                                                           1
                                                                                                            * including charge-through sales

                                                                                1H21      1H20     Change   Underlying EBIT(%)
                                                                                 $m        $m          %
   Underlying EBIT                                                                                                                             Food
   Food                                                                         103.0      88.4     16.5%                                      Liquor
   Liquor                                                                        40.1      30.7     30.6%      31%             50%             Hardware
   Hardware                                                                      64.5      38.9     65.8%
   Business Pillars                                                             207.6     158.0     31.4%       19%
   Corporate                                                                     (4.6)     (2.3)
   Total EBIT                                                                   203.0     155.7     30.4%

     1. Direct sales from suppliers to retailers, invoiced through Metcash

7 7FY20 FullFY21
             Year Results
                 Half Year Results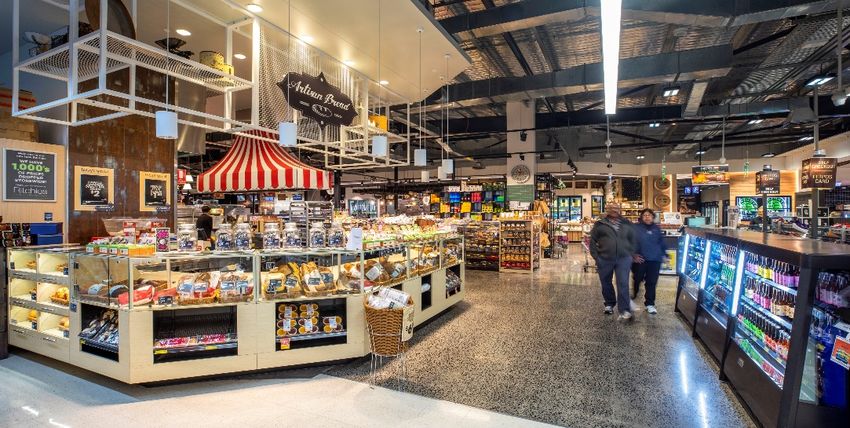
Food – sales
Total Food sales (including charge-through) up 9.5% to $4.8bn (+16.3% ex-Drakes1 and
2
7-Eleven impact ) 1H21 1H20 Change
1
Supermarkets sales increased 14.6% to $4.1bn (+18.3% ex-Drakes ) $m $m %
1
Supermarket sales ex-tobacco increased 13.0% (+16.7% ex-Drakes ) Revenue (including charge-through)
Key drivers of higher Supermarket sales: Supermarkets 4,123.2 3,596.5 14.6%
2
Change in consumer behaviour continued to benefit network Convenience 672.7 784.6 (14.3%)
– More home cooking Total revenue (including charge-through) 4,795.9 4,381.1 9.5%
– Preference for local neighbourhood shopping
Success of MFuture in assisting retention of new and returning IGA customers Charge-through sales (531.0) (472.2) 12.5%
Transaction and basket size growth Total revenue as per Statutory Accounts 4,264.9 3,908.9 9.1%
3
Price inflation 2.1% (1H20: -0.1%)
Strong growth in all states, particularly Victoria which can be partly attributed to stricter
COVID restrictions
4
Market share gains in the IGA retail network with LfL sales up +16.4%
Teamwork score increased 50bps to 74.3% supported by growing range and new and
returning suppliers being serviced through DCs (Monassen, Twisted Sister, Freedom
Foods, L’Oreal)
Net positive store openings (10 opened, 8 closed)
5
2
Convenience sales decreased 14.3% (ex 7-Eleven +5.2%) with increased demand in
rural and remote areas
1. Metcash ceased to supply Drakes in SA from 30 September 2019. Sales growth has been calculated by removing Drakes sales from the prior period 1 May 2019 to 30 September 2019 IGA Rundle Mall, SA
2. The previous supply agreement with 7-Eleven concluded on 17 August 2020. Sales growth has been calculated by removing 7-Eleven sales from the prior period 18 August 2019 to 31 October 2019
3. Excludes tobacco and produce
4. Scan data from 1,144 stores
5. Excludes store transfers in and out of banner group
8 FY21 Half Year Results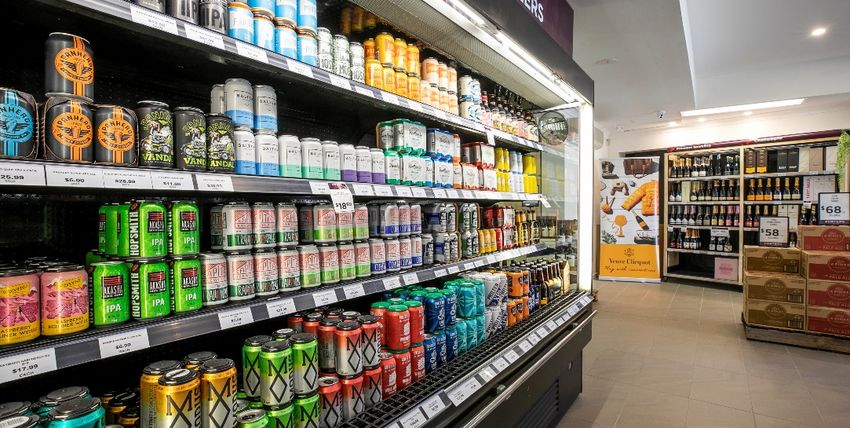
Food – EBIT
Total Food EBIT increased $14.6m or 16.5% to $103.0m
Strong growth in sales volumes 1H21 1H20 Change
Higher contribution from joint venture stores $m $m %
There was no benefit from resolution of onerous leases in 1H21 (1H20: benefit of ~$6m) 1
Total revenue (including charge-through) 4,795.9 4,381.1 9.5%
Strong EBIT growth achieved despite: EBIT 103.0 88.4 16.5%
1H20 including 5 months of sales to Drakes in SA versus no sales in 1H21 EBIT margin
2
2.1% 2.0% 10bps
1H21 only included ~3.5 months of 7-Eleven sales as the previous supply agreement
with 7-Eleven ended on 17 August 2020
While the Pillar has strictly followed COVID Safe working practices, the impact of
those additional operating costs was not material
Continued focus on operating costs helped offset the impact of cost inflation
EBIT margin improved 10bps to 2.1% reflecting the positive operating leverage from
higher sales volumes
Ritchies IGA, Rowville, VIC
1. Total revenue includes charge-through sales of $531.0m (1H20: $472.2m)
2. EBIT margin: EBIT / Total revenue (including charge-through)
9 FY21 Half Year Results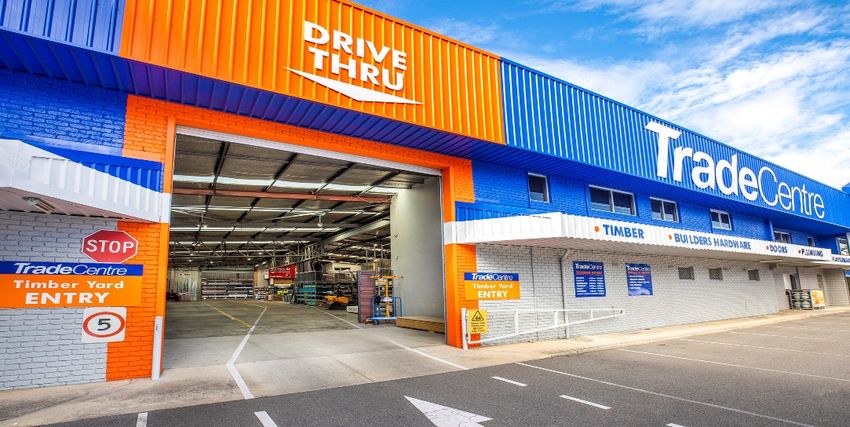
Food - MFuture initiatives
Store Store Private Low cost
clarity network label operator
New IGA brands and channel Further strengthening of network Community Co continues to be New Distribution Centre in SA
standards developed with retailer underpinned by strong sales growth well supported by retailers and operational in Dec. 20 despite
support Positioned to continue benefiting customers COVID-19 challenges
First SupaValu large format store from preference for shopping locally Increased investment to further New and re-entering suppliers
(Doonside, NSW) performing Retailers continuing to invest in accelerate growth opportunities supporting drive to be low cost
well. Second SupaValu store to stores through DSA program Focus on value range to support distributor
open in Ballina, NSW in 2H21 customers adversely impacted by Continued focus on warehouse
Further 48 stores upgraded in
Increased marketing investment 1H21 despite COVID restrictions, COVID-19 efficiency and cost-out initiatives
to further strengthen IGA brand bringing total upgraded to 539 New ‘Discounter’ range added in Additional costs associated with
presence Average retail sales growth >15% 1H21 COVID-19 not material in 1H21
ex benefit from COVID-19
Strong pipeline of stores to
undergo DSA program with ~40%
of network upgraded
10 10
FY20 Full Year Results
FY21 Half Year ResultsLiquor – sales
1H21 1H20 Change
Total sales (including charge-through) increased 14.3% to $2.0bn reflecting: $m $m %
Strong demand in retail network, more than offset:
Total revenue as per Statutory Accounts 2,035.5 1,781.0 14.3%
Adverse impact of COVID-19 trading restrictions on ‘on-premise’ customers
Charge-through sales 3.6 3.2 12.5%
Sales to IBA retail banner group increased 24.1%, with strong growth in
Cellarbrations, The Bottle-O and IGA Liquor Total revenue (including charge-through) 2,039.1 1,784.2 14.3%
Increased preference for local neighbourhood shopping
Home consumption substituting ‘on-premise’ consumption
Less overseas travel and duty-free shopping
Increase in the number of transactions and basket size
1
Strong growth in IBA retail banner group with LfL sales increasing 27%
Percentage of sales through IBA bannered network ~51%
‘On-premise’ customers at various stages of recovery from trading restrictions
Container Deposit Scheme in WA commenced on 1 October 2020
IGA Liquor, Strathfieldsaye, VIC
1. Based on scan data from 573 stores
11 FY21 Half Year ResultsLiquor – EBIT
1H21 1H20 Change
EBIT increased $9.4m or 30.6% to $40.1m $m $m %
Contribution from strong sales growth
1
Total revenue (including charge-through) 2,039.1 1,784.2 14.3%
Costs continued to be well managed despite additional expenditure related
to COVID-19 EBIT 40.1 30.7 30.6%
EBIT margin increased to 2.0% reflecting the positive operating leverage from EBIT margin
2
2.0% 1.7% 30bps
higher sales volumes
1. Total revenue includes charge-through sales of $3.6m (1H20: $3.2m)
2. EBIT margin: EBIT / Total revenue (including charge-through)
12 FY21 Half Year ResultsLiquor - MFuture initiatives
Digital Store On- Private &
network premise Exclusive
label
Continued rollout of ‘Shop My Strong focus on further improving ‘On-premise’ customers at Developed and commenced
Local’ online offer – launched April network competitiveness (range, various stages of recovery from execution of growth plan to
2020 price, brand differentiation, store COVID-19 restrictions leverage acquisition of Kollaras
Continued integration of new POS quality) to retain customers gained Financial support provided to private label brand portfolio
program with conversion of through COVID-19 period impacted customers delivering Focus on driving growth through
majority of network expected by Continued investment in store strong loyalty increased quality, improved
end of FY21. Enables: refreshes and cool room upgrades Private and exclusive label offer retailer margins and value for
e-Commerce integration Retailer confidence reflected in extended to ‘on-premise’ customers
Loyalty program addition of 111 new stores in customers Manufacturing of Kollaras SKUs
Data digitalisation 1H21 now under ALM stewardship
Launched trial of Cellarbrations Working with suppliers to expand
branded e-Commerce site in
portfolio of exclusive brands
Victoria
13 13
FY20 Full Year Results
FY21 Half Year ResultsHardware – sales
Total sales (including charge-through) increased 20.6% to $1.3bn, with 1H21 1H20 Change
significant growth in DIY sales $m $m %
Excluding acquisitions1, total sales increased 16.2% Total revenue as per Statutory Accounts 759.3 599.9 26.6%
Strong DIY sales underpinned by: Charge-through sales 499.6 444.3 12.4%
Change in consumer behaviour related to COVID-19 Total revenue (including charge-through) 1,258.9 1,044.2 20.6%
Benefit from investment in MFuture initiatives
Strong performance from Sapphire stores
Loyalty membership up 13% to 1.15m
Significant growth in online sales (+104%)
Transactions up 26%, average basket size up 13%
Retail LfL sales2 increased 13.2% (DIY +35%, Trade +4%)
Higher margin DIY sales increased to ~40% of sales mix (1H20: ~36%)
Growth in Trade sales supported by Government stimulus and renovation
activity
Significant uplift in teamwork score through success of ‘shopper led range’
with HTH now >70%
Mitre 10 Versatile, WA
1. Acquisitions include Total Tools Holdings and in FY20 G.Gay & Co, Keith Timber and Wormersley’s
2. Based on scan data from 233 independent retail and corporate/JV stores (represents >50% of sales)
14 FY21 Half Year ResultsHardware – EBIT
1H21 1H20 Change
EBIT increased $25.6m or 65.8% to $64.5m, reflecting: $m $m %
Significant increase in sales volumes
Total revenue2 (including charge-through) 1,258.9 1,044.2 20.6%
Increased weighting of higher margin DIY in sales mix
Acquisitions1 contributed $8.5m to earnings (TTH Sept/Oct of $4.8m) EBIT 64.5 38.9 65.8%
Increased contribution from joint ventures / company-owned stores EBIT margin3 5.1% 3.7% 140bps
Costs well managed
Increase in IHG wholesale EBIT margin to 3.2% reflecting higher proportion
of DIY in sales mix (1H20: 2.9%)
Total IHG EBIT margin 5.1%
1. Acquisitions include Total Tools Holdings and in FY20 G.Gay & Co, Keith Timber and Wormersley’s TM&H Mitre 10 MOE, VIC
2. Total revenue includes charge-through sales of $499.6m (1H20: $444.3m)
3. EBIT margin: EBIT/Total revenue (including charge-through)
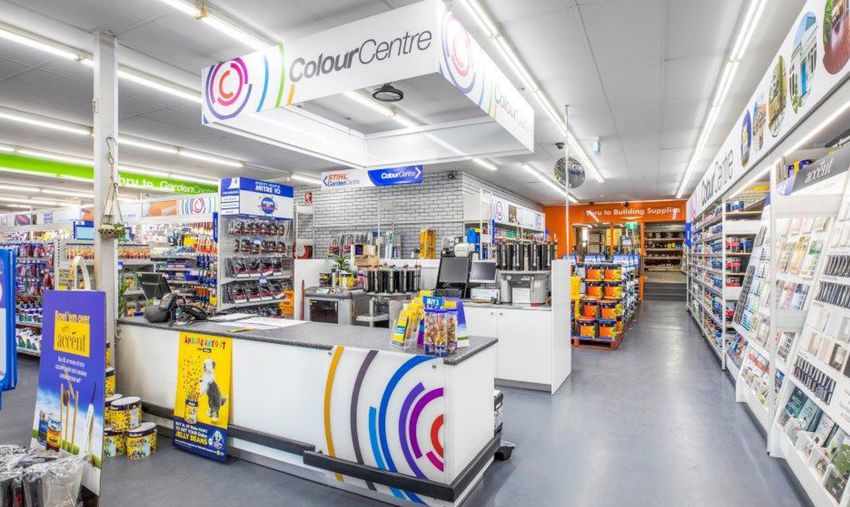
15 FY21 Half Year ResultsHardware - MFuture initiatives
Sapphire Build Grow Digital &
Program Trade retail Trade
network technology
Modernises store look, delivers Total Tools acquisition – largest Company-owned retail network Click & Deliver added to Click & Collect
greater range and space to professional tool retail network in core to ensuring a strong offer in VIC and TAS. Nation-wide rollout
growing consumer categories Australia independent model to be competed in 2H21
Expected to complete a further On track for 40 ‘Trade only’ stores Two acquisitions (three sites) in Loyalty program expanded to enable
40 stores in FY21 to bring total by 2022 with 20 completed to 1H21 (Brennan’s in NSW and customers to earn and redeem points at
Sapphire stores to 130 date Finlayson’s in QLD) any network store. Rollout in 2H21
Targeting ~200 stores completed Continued to progress ‘Whole of Retail network of 102 stores New Trade website launched
by end of 2022 House’ strategy with new supply Retail store network contributed Highlights strength and heritage in
Average retail sales uplift and install partners added in ~40% of total sales in 1H21 and Trade
following store upgrade >17% 1H21 represents ~15% of store network Provides platform for all Trade
Strategy in place for retailer Accelerating Trade technology technology
retention of customers gained rollout to add value for builder Delivers greater efficiencies for Trade
through COVID-19 and support ‘Whole of House’ customers
strategy Total SKUs available online increased to
~16,000 (FY20: ~14,000)
16 16
FY20 Full Year Results
FY21 Half Year ResultsNew distribution centre in SA
Opened new 68,000m2 purpose built DC at Gepps Cross in December 2020 despite COVID-19 related challenges
Replaces aged, range constrained and inefficient existing facility and unlocks potential for higher teamwork scores and greater
efficiencies for the retail network in South Australia
Facility accommodates dry grocery, perishables, freezer and liquor in one DC
Supplies over 200 independent supermarkets in SA & NT including Foodland and IGA brands
Awarded ‘5 star’ Green rating
Features 2,500 solar panels capable of powering chilled operations
Utilises new safety equipment such as ‘A safe’ barriers and ‘wheel lock’ docking systems to ensure segregation of pedestrians, assets and
MHE across the site
Long term lease of 15 years
Metcash capital investment of ~$15m – mainly racking, shelving and IT
17 FY21 Half Year ResultsFinancials
Brad Soller
Group Chief Financial Officer
18
18 FY20 Full Year ResultsProfit & Loss
1H21 1H20 Change
$m $m %
Sales revenue 7,059.7 6,289.8 12.2%
EBITDA 280.9 234.7 19.7%
Depreciation and amortisation (77.9) (79.0) 1.4%
EBIT 203.0 155.7 30.4%
Net finance costs (21.3) (27.0) 21.1%
Profit before tax and NCI 181.7 128.7 41.2%
Tax (51.7) (37.6) 37.5%
Non-controlling interests (0.4) (0.5) -
Underlying profit after tax 129.6 90.6 43.0%
MFuture restructure costs (post tax) (1.2) (4.8) -
Total Tools acquisition costs (post tax) (3.3) - -
Impairment of goodwill and other assets (post tax) - (237.4) -
Reported profit/(loss) after tax 125.1 (151.6) -
EPS based on underlying profit after tax 12.7c 10.0c 27.0%
ROFE1 30.4% 26.1% 430bps
1. ROFE based on underlying EBIT (calculated on a rolling 12 months basis from 1 November 2019 to 31 October 2020) and the average of opening and closing funds employed.
19 19
FY20 Full Year Results
FY21 Half Year ResultsCashflows
1H21 1H20
$m $m
Net cash from operating activities 314.9 88.8
Net cash used in investing activities (102.1) (29.8)
Capital expenditure (30.4) (30.5)
Acquisitions of businesses (101.1) (23.2)
Receipts from subleases 22.2 21.4
Proceeds from sale of assets/businesses and net loan movements 7.2 2.5
Dividends paid (66.5) (63.6)
Payments for lease liabilities (70.1) (50.9)
Proceeds from equity raising 13.5 -
Other financing activities (3.9) (4.3)
Reduction / (increase) in net debt 85.8 (59.8)
Cash realisation ratio (CRR) 1 151.8% 52.4%
1. Cash realisation ratio (CRR) = Cash flow from operations/underlying NPATDA (depreciation and amortisation not tax effected)
20 20
FY20 Full Year Results
FY21 Half Year ResultsBalance Sheet
31 October 2020 30 April 2020 31 October 2019
$m $m $m
Trade receivables and prepayments 1,660.9 1,559.0 1,526.2
Inventories 1,109.1 1,032.2 1,061.0
Trade payables and provisions (2,445.5) (2,181.9) (2,333.6)
Net working capital 324.5 409.3 253.6
Intangible assets 666.7 581.8 586.4
Property, plant and equipment 217.1 214.0 204.9
Equity accounted investments 76.9 77.6 78.4
Customer loans and assets held for sale 48.1 56.3 61.2
Capital investments 1,008.8 929.7 930.9
Total funds employed 1,333.3 1,339.0 1,184.5
Lease receivables 275.0 292.7 288.1
Right-of-use assets 471.0 485.4 517.2
Lease provisions (56.1) (58.1) (71.6)
Lease liabilities (856.9) (886.1) (904.5)
Lease balances (167.0) (166.1) (170.8)
Net cash/(debt) 172.5 86.7 (95.3)
Tax, put options and derivatives 30.3 112.0 110.4
Net Assets / Equity 1,369.1 1,371.6 1,028.8
21 21
FY20 Full Year Results
FY21 Half Year ResultsNet debt/cash
1H21 FY20
Debt Facility Maturity Profile
$m $m
400 Net debt
350
Gross debt - (188.4)
300
Cash and cash equivalents 172.5 275.1
250
Net cash 172.5 86.7
200
$m
150
Debt metrics and ratios
100
50
Weighted average maturity of debt facilities 2.0 years 1.8 years
1
0 Weighted average cost of debt 2.5% 2.8%
FY21 FY22 FY23 FY24 FY25 FY26 % Fixed debt - 68%
2
Working capital Syndicated facility Interest coverage 32.1x 25.9x
3
Gearing ratio NA NA
Net cash of $172.5m (FY20: $86.7m) Underlying EBITDAR coverage
4
4.1x 3.8x
5
Average net cash of $57m (FY20: Average net debt ~$345m) Gross debt coverage - 0.5x
Refinanced $225m of debt facilities due to mature August 2021. Maturity of new 1. Weighted average cost of debt over the period (excludes line fees)
2. Underlying EBITDA/Net Interest Expense (pre AASB16)
facilities: September 2024 ($125m) and September 2025 ($100m) 3. Net Debt/(Shareholders Equity + Net Debt)
4. Underlying EBITDAR/(Net Interest Expense + Net Rent Expense) (pre AASB16)
Cancelled $150m of syndicated debt facilities in November 2020 5. Gross Debt/Underlying EBITDA (pre AASB16)
Average tenor of debt facilities 2.0 years
Balanced debt maturity profile
22 FY21 Half Year ResultsTotal Tools
Acquisition of 70% stake in Total Tools Holdings (‘TTH’) completed 1 September 2020
Purchase price ~$57m based on normalised earnings excluding COVID-19 related uplift
1H21 includes two months trading from TTH
Sales of $18.6m and EBIT of $4.8m
Network at end of 1H21 comprised 84 independently owned stores and 2 company-owned stores
$40m debt facility will be utilised to acquire an ownership interest in select stores
Post the half year TTH acquired 4 independent stores with ownership interest of 60%
A further 8 independent stores expected to be acquired by end of CY20
Put and call options are in place to acquire remaining minority interest in both TTH and company-owned stores
Operational and merchandise synergies expected in 2H21
Mark Laidlaw, former Hardware CEO, appointed as Chair of TTH Board
Brad Soller, retiring Metcash Group CFO, to remain on TTH Board
Paul Dumbrell to continue as TTH CEO
Accounting
Metcash will consolidate 100% of TTH earnings, notwithstanding its 70% ownership. TTH will consolidate 100% of its majority-owned
independent stores
A put option liability of $68.9m has been recognised based on the expected purchase consideration to acquire the remaining 30% ownership,
exercisable from late 2023
The put option liability will be remeasured to fair value each half year
TTH sales revenue only includes franchise fees, sales of owned brand products and sales by corporate retail stores
23 FY21 Half Year ResultsDividend
FY21 interim dividend of 8.0 cents per share, fully franked (1H20: 6.0 cents)
Ex-dividend date: 22 December 2020
Record date: 23 December 2020
Payment date: 29 January 2021
Dividend payout ratio ~60% of underlying profit after tax for 1H21, in line with current policy
24 FY21 Half Year ResultsGroup outlook
25
25 FY20 Full Year ResultsOutlook
Group
Strong start to 2H21 with sales momentum continuing in all Pillars in the first five weeks of 2H21
Subject to an adverse change in government restrictions, trading is expected to benefit from more people travelling domestically over the
Christmas/New Year period and our retail network’s strong representation in regional/rural areas
2H21 will cycle the negative impact of bushfires in 2H20
2H21 however, includes the cycling of significantly higher sales volumes in the Food and Hardware pillars in March and April 2020
Food
Food sales in the first five weeks of 2H21 up 2.4% (+12.1% ex 7-Eleven impact1), with Supermarkets sales up 12.1% (+8.4% ex-tobacco)
2H21 will be negatively impacted by the previous supply agreement to 7-Eleven that concluded in August 2020
MFuture initiatives are expected to further improve the competitiveness of the retail network and assist in the retention of new and returning
customers gained through the COVID-19 period
Continued strong focus on costs to help offset the impact of inflation and other cost pressures, including those related to COVID Safe work
practices
1. The previous supply agreement with 7-Eleven concluded on 17 August 2020. Sales growth has been calculated by removing 7-Eleven sales from the prior period 1 November 2019 to 29 November 2019
26 FY21 Half Year ResultsOutlook
Liquor
Liquor sales in the first five weeks of 2H21 up 16.9% with continued elevated demand in the retail network more than offsetting the adverse impact
of COVID-19 restrictions on ‘on-premise’ customers. ‘On-premise’ customers have started to recover in States with easing restrictions
Sales to the IBA retail banner group in the first five weeks increased 22.6%
Focus on progressing the MFuture initiatives, particularly private label and online while continuing to support customers adversely impacted by
COVID-19 restrictions
Hardware
Hardware sales in the first five weeks up 25.3% (+19.3% ex-TTH) with sustained strong demand in DIY and Trade sales continuing to track positively
Continuing to focus on progressing the MFuture growth initiatives across Trade, DIY and digital and retaining customers gained through COVID-19
period
2H21 includes a full six months of Total Tools trading, including the 4 stores acquired and anticipated acquisition of a majority interest in a further
8 stores
COVID-19
There continues to be a high level of uncertainty as to the potential impact on our businesses of any changes to COVID-19 related restrictions
and resulting changes in consumer behaviour
27 FY21 Half Year ResultsAppendices
1 Financial history
2 Bannered store numbers
28
28 FY20 Full Year Results1. Financial history
1H21 1H20 1H191 1H181 1H171 1H161
Financial Performance
Sales revenue ($m) 7,059.7 6,289.8 6,189.2 6,054.8 5,743.7 5,698.5
EBIT ($m) 203.0 155.7 158.1 156.3 132.1 140.7
Net finance costs ($m) (21.3) (27.0) (14.5) (15.2) (16.9) (19.8)
Underlying profit after tax ($m) 129.6 90.6 100.3 99.1 82.8 86.9
Reported profit/(loss) after tax ($m) 125.1 (151.6) 95.8 93.0 74.9 122.0
Operating cash flows ($m) 314.9 88.8 120.3 161.4 130.6 3.1
2
Cash realisation ratio (%) 151.8% 52.4% 93.7% 127.3% 114.2% 2.6%
Financial Position
Shareholder’s equity ($m) 1,369.1 1,028.8 1,212.8 1,633.9 1,538.4 1,275.2
Net cash/(debt) ($m) 172.5 (95.3) (85.2) 14.0 (197.6) (435.3)
3
Gearing ratio (%) NA 8.5% 6.6% - 11.4% 25.4%
4
Return on funds employed (%) 30.4% 26.1% 24.9% 21.4% 17.0% 14.4%
Share Statistics
Fully paid ordinary shares (m) 1,022.4 909.3 909.3 975.6 975.6 928.4
Weighted average ordinary shares (m) 1,021.5 909.3 947.9 975.6 941.3 928.4
Underlying earnings per share (cents) 12.7 10.0 10.6 10.2 8.8 9.4
Reported earnings/(loss) per share (cents) 12.2 (16.7) 10.1 9.5 8.0 13.1
Dividends declared per share (cents) 8.0 6.0 6.5 6.0 – –
1. 1H16 to 1H19 financials are reported on a pre-AASB16 basis
2. Cash flows from operations / Underlying NPAT + Depreciation and Amortisation (depreciation and amortisation not tax effected)
3. Net Debt / (Shareholders’ Equity + Net Debt)
4. Underlying EBIT (calculated on a rolling 12 month basis from 1 November 2019 to 31 October 2020) / Average Funds employed
29 29
FY20 Full Year Results
FY21 Half Year Results2. Bannered store numbers
October April
2020 2020
Pillar
Supermarkets 1,612 1,623
Campbells 16 16
Liquor 2,790 2,679
Hardware 730 650
Total 5,148 4,968
Supermarkets Campbells Liquor Hardware Total
Store movement
Number of stores at April 2020 1,623 16 2,679 650 4,968
Stores opened / joined banner group during the period 30 - 319 90 439
Stores closed / left banner group during the period (41) - (208) (10) (259)
Number of stores at October 2020 1,612 16 2,790 730 5,148
30 30
FY20 Full Year Results
FY21 Half Year Results2. Bannered store numbers
October April
2020 2020
Supermarkets
Supa IGA 324 323
IGA 785 789
IGA-Xpress 221 225
Total IGA bannered stores 1,330 1,337
Friendly Grocer/Eziway 282 286
Total Supermarkets 1,612 1,623
Liquor
Cellarbrations 553 543
Bottle-O & Bottle-O Neighbourhood 248 232
IGA Liquor 474 471
Porters 27 26
Thirsty Camel (NSW/ACT, QLD, TAS, SA/NT) 152 141
Big Bargain 45 47
Other 1,291 1,219
Total Liquor 2,790 2,679
Hardware
Mitre 10 330 321
Home Timber & Hardware 153 168
True Value Hardware and Thrifty-Link 161 161
Total Tools 86 NA
Total Hardware 730 650
31 31
FY20 Full Year Results
FY21 Half Year ResultsDisclaimer
This presentation contains summary information about Metcash Limited (ABN 32 112 073 480) (Metcash) and its activities current as at the date of this presentation. The information in this
presentation is of general background and does not purport to be complete. It should be read in conjunction with Metcash’s other periodic and continuous disclosure announcements filed with
the Australian Securities Exchange, which are available at www.asx.com.au.
This presentation is for information purposes only and is not a prospectus or product disclosure statement, financial product or investment advice or a recommendation to acquire Metcash shares
or other securities. It has been prepared without taking into account the objectives, financial situation or needs of individuals. Before making an investment decision, prospective investors should
consider the appropriateness of the information having regard to their own objectives, financial situation and needs and seek legal and taxation advice appropriate to their jurisdiction. Metcash is
not licensed to provide financial product advice in respect of Metcash shares or other securities. Past performance is no guarantee of future performance.
No representation or warranty, expressed or implied, is made as to the fairness, accuracy, completeness or correctness of the information, opinions and conclusions contained in this presentation.
To the maximum extent permitted by law, none of Metcash and its related bodies corporate, or their respective directors, employees or agents, nor any other person accepts liability for any loss
arising from the use of this presentation or its contents or otherwise arising in connection with it, including, without limitation, any liability from fault or negligence on the part of Metcash, its
related bodies corporate, or any of their respective directors, employees or agents.
This presentation may contain forward-looking statements including statements regarding our intent, belief or current expectations with respect to Metcash’s business and operations, market
conditions, results of operations and financial condition, specific provisions and risk management practices. When used in this presentation, the words “likely”, “estimate”, “project”, “intend”,
“forecast”, “anticipate” ,”believe”, “expect”, “may”, “aim”, “should”, “potential” and similar expressions, as they relate to Metcash and its management, are intended to identify forward-looking
statements. Forward looking statements involve known and unknown risks, uncertainties and assumptions and other important factors that could cause the actual results, performance or
achievements of Metcash to be materially different from future results, performance or achievements expressed or implied by such statements. Readers are cautioned not to place undue reliance
on these forward-looking statements, which speak only as of the date thereof.
Contact details
Steve Ashe Merrin Hodge
Head of Corporate Affairs & Investor Relations Investor Relations Manager
Phone: +61 408 164 011 Phone: +61 429 235 104
10 Visit our website
E-mail: steve.ashe@metcash.com Email: merrin.hodge@metcash.com
www.metcash.com
32 32
FY20 Full Year Results
FY21 Half Year ResultsFood Liquor Hardware
You can also read