FULL YEAR RESULTS PRESENTATION 2018 - HotCopper
←
→
Page content transcription
If your browser does not render page correctly, please read the page content below
FULL YEAR RESULTS PRESENTATION 2018

VRL FY18 TELECONFERENCE DETAILS

    23 AUGUST 2018 2:00 PM AEST (NSW, VIC, TAS, ACT)
    CONFERENCE ID: 365120
    In order to pre-register for this conference and avoid a queue when calling, please follow the link below.
    You will be given a unique pin number to enter when you call which will bypass the operator
    and give you immediate access to the event.
    http://villageroadshow.com.au/investors/corporate-diary/teleconferences#/

    If unable to register, call one of the numbers below at the time of the conference
    and provide the conference ID 365120 to an operator:

    Australia Toll Free:     1800 908 299               Australia Alt. Toll Free:   1800 455 963
    Australia Local:         +61 2 9007 8048            Australia Alt. Local:       +61 7 3145 4005
    New Zealand Toll Free:   0800 452 795               Hong Kong Toll Free:        800 968 273                  Singapore Toll Free:      800 101 2702
    Auckland Local:          +64 9 929 3905             India Toll Free:            000 800 100 8070             South Africa Toll Free:   0800 984 013
    Canada/USA Toll Free:    1855 624 0077              Indonesia Toll Free:        007 803 321 8057             Switzerland Toll Free:    0800 802 498
    China Toll Free:         1080 0140 1776             Ireland Toll Free:          1800 948 607                 Taiwan Toll Free:         0080 112 7377
    France Toll Free:        0800 913 734               Japan Toll Free:            0066 3386 8000               UAE Toll Free:            8000 3570 2706
    Germany Toll Free:       0800 183 0918              Malaysia Toll Free:         1800 816 441                 UK Toll Free:             0800 051 1453

    In order to ask a question during the Live Question and Answer Session
    Press * then 1 on your telephone keypad to enter the Q&A queue
    Press * then 2 on your telephone keypad to withdraw your question

2                                                                         VRL FY18 Results
“External factors significantly impacted FY2018,
Improved performance expected for FY2019”
3 VRL FY18 ResultsFY18 HIGHLIGHTS
BUSINESS OPERATIONS ACTION ON COST
Theme Parks • Initiatives were implemented, delivering cost
savings of $8m on an annualised basis including
• Lower than expected attendances over the Easter school holidays,
operational cost savings and OneCo cost reduction
due to the Commonwealth Games on the Gold Coast
• Positive impact of new pricing strategy - Improved ticket yield in • Continuing with further identification of cost
June and July as consumers returned to higher priced annual and duplication and cost efficiencies
multi-day passes
Cinema Exhibition CAPITAL MANAGEMENT
• Softer trading due to underperformance of key titles in 1H FY18 Proactive steps taken to strengthen VRL’s balance sheet
partially offset by Blockbuster releases in Q4 FY18
• Various asset sales, including
• Plenty Valley opened in Melbourne’s north, showcasing all of
Village Cinema’s entertainment concepts • Sale of VRL’s 50% interest in its Singapore Exhibition
business
Film Distribution
• Sale and leaseback of freehold land at Oxenford
• Impacted by underperformance of certain titles and ongoing
decline of the physical DVD market as it transitions to a digital • Sale of Wet‘n’Wild Sydney
universe
• Entitlement offer supported by Village Roadshow
Marketing Solutions Corporation shareholders
• Strengthened its position by continuing to invest in its promotional
platforms, data analytics and connective capabilities
4 VRL FY18 ResultsSTRENGTHENED BALANCE SHEET
(164)
527
Net proceeds from the Entitlement Offer
(100)
75 *
(37)
and asset sales used to reduce group net
338
(50) debt by $276m.
251
Jun-17 Singapore Oxenford land FY18 Jun-18 Wet 'n' Wild Entitlement Pro-forma Jun-
Net Debt net proceeds net proceeds Movement in Net Debt Sydney net offer net 18
net debt proceeds proceeds Net Debt
Pro forma
Jun-17 Jun-18
Jun-18
Net Debt /
3.87x 3.72x 2.77x
EBITDA
Notes:
* The $75 million increase in net debt for FY18 (excluding net proceeds) mainly related to capital
expenditure of $84.9m, which included Topgolf amount of $19.2 million.
5 VRL FY18 Results“Our clear goals now are to sell tickets and drive
free cash flow while bringing to bear laser focus
on operating costs and capital expenditure.”
6 VRL FY18 ResultsFY19 OUTLOOK
New pricing strategy
• Recent results support confidence around pricing strategy and its contribution to earnings recovery in FY19
• Core ticket sale revenues expected to substantially increase in FY19 following removal of discount resellers from the market
THEME PARKS effective June 2018
Topgolf
• Full year earnings contribution commencing FY19
• Successfully opened June 2018 with strong attendance and outstanding guest feedback
• Full year earnings from new sites, including Plenty Valley
CINEMA • A number of blockbuster releases anticipated in FY19 including the new Avengers, Mamma Mia - Here We Go Again, Aladdin,
EXHIBITION Mary Poppins, Aquaman and others
• Launched a $15 all day, every day ticket offering to $Reward members
• Encouraged by the upcoming product line-up in what is a ‘hit’ driven business
FILM
• Ongoing initiatives to reduce piracy
DISTRIBUTION
• Diversification of revenue streams
• Continue to grow its existing customer base, extend its activity into new product sectors and leverage long term relationships
MARKETING with key clients to enter new countries
SOLUTIONS
• Expected to benefit from international expansion program – USA and Asia
• Ongoing OneCo initiatives to drive efficiency through removing duplication of various functional areas
COST REDUCTION
• Additional reduction in operational costs targeted across VRL’s divisions and corporate
7 VRL FY18 ResultsTHEME PARKS NEW PRICING STRATEGY
POSITIVE IMPACT OF THE NEW PRICING STRATEGY IS EXPECTED TO DRIVE AN EARNINGS RECOVERY IN FY19
• Strong indication that Gold Coast Theme Parks have Yield increase compared to pcp
returned to a positive trajectory in terms of ticket sale 60%
• July 2018 performed the strongest in ticket sales ($) on 35%
40%
record with season pass ticket sales up $6.0m on prior
comparative period (pcp)
20% 16%
• Further supported by the marketing thrust anchored by
Queensland’s favorite, Sally Pearson 0%
Jan-18 to Jun-18 Jul-18
• Between January to July, 2018, ticket yield improved
significantly compared to the prior comparative period Ticket sales ($) increase compared to pcp
following the introduction of the new pricing strategy 60% 56%
• Since discounted resellers were removed from the market
40%
from June 2018 - ticket yield increased by 35% compared
to pcp, driven by a shift towards higher margin annual and
multi-day passes 20%
8%
0%
Jan-18 to Jun-18 Jul-18
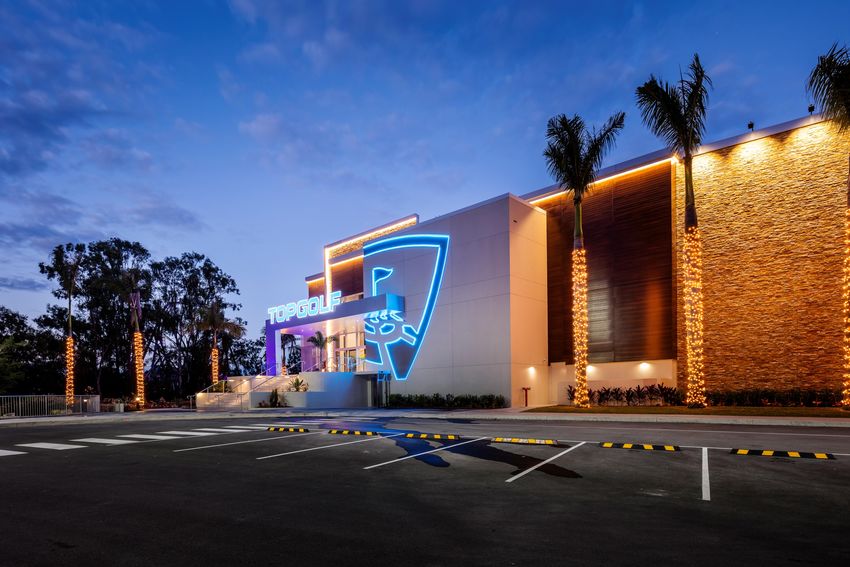
8 VRL FY18 ResultsTOPGOLF GOLD COAST
OPENED ON 15 JUNE 2018, WITH STRONG ATTENDANCE
AND OUTSTANDING GUEST FEEDBACK
NET PROMOTER SCORE OF 75%, AMONGST THE
HIGHEST SCORES INTERNATIONALLY
FOCUS ON IMPROVING F&B SPEND
INITIAL ACCEPTANCE OF THE CONCEPT IS VERY
PROMISING
VRL HAS EXCLUSIVE RIGHTS
FOR THE TOPGOLF CONCEPT IN AUSTRALIA
9 VRL FY18 ResultsCINEMA EXHIBITION – PREMIUM CONCEPTS AND FOCUS ON F&B
Village Cinemas’ diverse offering of exceptional experiences makes it the destination of choice
• Premium concepts appeal to niche market segments and drive
competitive advantage over other offerings in the market
• Complemented by exceptional food & beverage offerings
• Proven success in driving higher spend per person
$JUNIOR
• Australia’s first children’s cinema concept
• New locations added in FY18: Knox, Plenty Valley and Sunshine
GOLD CLASS AND $MAX HAVE DELIGHTED
• Concept has driven increased average ticket price, spend per
person and admissions
MOVIE-GOERS FOR YEARS, WHILE THE NEW
$JUNIOR CONCEPT HAS BEEN INCREDIBLY
POPULAR WITH FAMILIES!
10 VRL FY18 ResultsROADSHOW
• Attractive product line up in FY19 with key titles including
Fantastic Beast: Crimes of Grindelwald, Aquaman, Life Itself and
the much anticipated A Star Is Born
• TV production is building momentum with first production –
Romper Stomper launched toh critical acclaim on Stan during
the year with a second project American Gangster to screen on
Channel 7 in FY19
• Fight against piracy is showing results with 450 pirate sites
blocked in FY18 and a further 100 sought to be blocked in
September 2018 – resulting in a 42% reduction in piracy on a
year on year basis
• Cost reduction in the traditional business combined with
Roadshow develop new revenue generating opportunities
11 VRL FY18 ResultsMARKETING SOLUTIONS
• Continuing to leverage its long standing relationships
with multinational clients by entering into new
geographical regions Australia
• Evolving the sophistication of its key central
Asia
platforms and digital capabilities to remain at the
forefront of incentive technology solutions
USA
• Expanding its product portfolio to include new
industry sectors eg. mobile phones and FMCG Europe
• Exploring entering into new revenue generating
models
Expanded into Asia Entered the USA & broader European region
12 VRL FY18 ResultsCOST REDUCTION
2H FY18
Implemented annualised operating cost
• In FY18, initiatives were implemented which delivered cost savings of $8m, including OneCo
savings of $8m on an annualised basis including Identification of FY19 cost savings
operational cost savings and the OneCo cost reduction
program
1Q FY19
• There are further substantial cost saving initiatives Identification of further FY19 cost savings
budgeted to be executed in FY19 (with associated costs) Realise cost savings from FY18 actions
• Executive Directors have agreed to a 25% reduction in their
base remuneration and Non-Executive Directors have
2Q FY19
agreed to a 25% reduction in their fees as part of the
Benefits realised across majority of
OneCo initiative streams
• VRL will remain focused on cost control and judicious
capital expenditure spending with FY19 capital expenditure
3Q & 4Q FY19
budgeted to be significantly lower than in FY18 Benefits realised across all streams
(cost savings and revenue generating
opportunities)
FY20
Full year benefits of cost savings
realised
13 VRL FY18 ResultsVRL Group Financials 14 VRL FY18 Results
VRL GROUP – KEY EARNINGS METRICS

                                      Cinema                Theme                     Film              Marketing           Corporate
     Key Earnings                    Exhibition              Parks                Distribution          Solutions            & Other                Group
     Metrics ($m)                 FY18        FY17      FY18       FY17         FY18        FY17     FY18       FY17     FY18       FY17    FY18            FY17
     EBITDA                       58.1       76.6       38.3       55.9         13.8          21.2   8.3        9.8      (27.6)    (27.2)   90.9        136.3

     EBIT                         40.7       59.8       (8.3)       5.2         10.6          17.7   6.5        8.5      (29.3)    (28.2)   20.1            62.9

     PBT                          36.2       55.3       (24.4)     (8.8)         6.8          13.8   4.1        6.0      (31.7)    (33.5)   (9.2)           32.8

     NPAT                         24.2       40.5       (18.9)     (7.0)         4.6          10.0   1.9        3.1      (19.2)    (23.0)   (7.3)           23.6

     Notes:
     EBITDA is Earnings Before Interest, Tax, Depreciation and Amortisation, excluding Material Items and Discontinued Operations.
     EBIT is Earnings Before Interest and Tax, after Depreciation and Amortisation, excluding Material Items and Discontinued Operations.
     PBT is Profit Before Tax, excluding Material Items and Discontinued Operations, also referred to as "Operating Profit".
     Cinema Exhibition EBITDA in FY17 included $8.4m share of associate’s profit from Singapore.
     Refer page 18 for details in relation to Material Items.

15                                                                         VRL FY18 Results
VRL GROUP – CASHFLOW
Cinema Theme Film Marketing Corporate
Operating Cash Exhibition Parks Distribution Solutions & Other Group
FY18 FY17 FY18 FY17 FY18 FY17 FY18 FY17 FY18 FY17 FY18 FY17
Flow ($m)
EBITDA 58.1 76.6 38.3 55.9 13.8 21.2 8.3 9.8 (27.6) (27.2) 90.9 136.3
Movement in Working Capital (1) (2) (3) (0.9) (1.0) (8.4) 7.7 (17.4) 12.4 (9.5) 1.7 (4.4) (1.8) (40.6) 19.0
Belfast / Singapore and FilmNation Impact (4) (11.9) 13.6 - - - (3.2) - - - - (11.9) 10.4
Interest & Tax (5.1) (4.9) (16.1) (14.0) (3.9) (3.8) (0.6) (2.7) 8.7 (9.7) (17.0) (35.1)
Operating Cash Flow 40.2 84.3 13.8 49.6 (7.5) 26.6 (1.8) 8.8 (23.3) (38.7) 21.4 130.6
Capital Expenditure (23.2) (17.4) (54.7) (53.7) (1.1) (1.7) (2.3) (1.6) (3.6) (5.1) (84.9) (79.5)
Free Cash Flow 17.0 66.9 (40.9) (4.1) (8.6) 24.9 (4.1) 7.2 (26.9) (43.8) (63.5) 51.1
Notes:
(1) Movements in Working capital primarily relates to Film Distribution: reduction in creditors / accruals related to the timing of Film
Distribution Royalties.
(2) Theme Parks working capital was primarily negatively impacted due to lower annual pass sales in June 2018. These sales partially
recovered in July 2018.
(3) Film Distribution working capital movement was due to higher creditors in June 17 paid after year end – main creditors related to higher
performing films occurring towards the end of the FY17 year.
(4) Belfast rent settlement paid in FY18 / Singapore cash dividends received in excess of equity accounted profit in FY17 and FilmNation
equity accounting difference.
16 VRL FY18 ResultsVRL GROUP – DEBT
Total Debt Drawn Total Debt Drawn Total Debt Drawn
Facility Expiry Total Facility ($m) ($m) ($m) ($m)
On Balance Sheet Debt (Calendar year) 30 Jun 18 30 Jun 18 31 Dec 17 30 Jun 17
VRL Group Finance Facility 2019 375.0 375.0 374.0 480.0
2020 50.0 19.0 - 140.0
Other (1) Various 11.8 7.9 7.0 7.5
Total 436.8 401.9 381.0 627.5
Cash on Hand n/a (63.4) (75.7) (100.4)
Net Debt on Balance Sheet n/a 338.5 305.3 527.1
Debt & interest cover
30 June 2018 Net Debt / EBITDA EBITDA / Net Interest
VRL Group (2) 3.73x 3.10x
Notes:
1. Other includes remaining finance facilities and reduction from capitalised borrowing costs.
2. Sale and long-term leaseback of Oxenford land required to be treated as finance lease, with finance lease asset and finance lease liability of $101.5 million
recorded initially, and gain on sale of $73.7 million treated as unearned revenue initially. For covenant calculations, finance lease liability excluded, but
finance lease interest included.
17 VRL FY18 ResultsVRL GROUP – MATERIAL ITEMS
FY18 results include attributable profit from material items after tax of $7.5 million
KEY ITEMS
Material Items $m
Gain on disposal of investments / businesses
• Gain on disposal of investments and businesses totaling $156.9 million, Gain on disposal of investments / businesses 156.9
including gain on Singapore asset held for sale of $154.0 million Impairment / other non-cash adjustments (167.4)
Impairment of assets / other non-cash adjustments Restructuring costs (8.4)
• Total impairment of assets and other non-cash adjustments of $167.4 Pre-tax total (18.9)
million pre-tax, primarily including: Income tax benefit 22.0
• Impairment of assets at Wet’n’Wild Sydney of $24.7 million Non-controlling interests 4.4
Attributable profit after tax 7.5
• Impairment of goodwill relating to Gold Coast Theme Parks of $95
million, including $74 million in relation to the accounting impact of
sale and leaseback of land on the Gold Coast
• Impairment of assets at Wet’n’Wild Las Vegas of $8.5 million
• Impairment of goodwill relating to Film Distribution of $30 million
Restructuring costs
• Restructuring costs totaling $8.4 million (pre-tax )
Tax benefit
• Tax benefit from sale and leaseback of Gold Coast land of $24.1 million
18 VRL FY18 ResultsTheme Parks 19 VRL FY18 Results
THEME PARKS – KEY RESULTS

                                            Gold Coast                                  Wet'n'Wild          Wet'n'Wild             Asia
                                                                    Topgolf
     Key Results                           Theme Parks                                    Sydney             Las Vegas      Theme Parks           Theme Parks (total)
     ($m unless stated otherwise)         FY18     FY17      FY18         FY17        FY18      FY17      FY18      FY17   FY18     FY17            FY18     FY17
     Total Attendance ('000s)            4,582     4,960      25              -        463        484     307       282      -              -      5,377      5,726
     Total Income                        271.4     267.9      0.9             -       16.8       18.6     10.1     10.2    6.1            6.0      305.3      302.8
     Total Expenses                      (229.5)   (215.9)   (3.0)            -       (17.8)     (15.6)   (7.7)    (6.8)   (9.0)          (8.7)   (267.0)    (247.0)
     EBITDA                               41.9      52.0     (2.1)            -       (1.0)       3.1     2.4       3.5    (2.9)          (2.7)     38.3      55.9
     Depreciation & Amortisation         (40.1)    (41.8)    (0.1)            -       (5.1)      (7.5)    (1.3)    (1.3)   (0.1)          (0.1)    (46.6)     (50.7)
     Interest Expense (Net)              (12.4)    (10.2)    (0.2)            -       (2.5)      (2.5)    (1.1)    (1.3)     -              -      (16.1)     (14.1)
     PBT                                 (10.6)     0.2      (2.4)            -       (8.5)      (6.9)      -       0.7    (3.0)          (2.8)    (24.4)     (8.8)
     Non-controlling Interests              -         -        -              -         -          -        -      (0.3)     -              -        -        (0.3)
     PBT After Minority Interests        (10.6)     0.2      (2.4)            -       (8.5)      (6.9)      -       0.4    (3.0)          (2.8)    (24.4)     (9.2)
     Total Capital Expenditure (1)       (32.0)    (44.1)    (19.2)       (5.7)       (1.5)      (3.5)    (1.9)    (0.4)   (0.1)            -      (54.7)     (53.7)

     Notes:
     (1) Gold Coast FY18 Capital Expenditure includes investments in a number of rides, attractions and upgrades.

20                                                                            VRL FY18 Results
AUSTRALIAN THEME PARKS EBITDA – FY09 TO FY18
OVER THE 8 YEARS PRIOR TO THE DREAMWORLD TRAGEDY, VILLAGE’S AUSTRALIAN THEME PARKS AVERAGE EBITDA WAS $86M
100.0
90.0
Theme Parks results
80.0 have been adversely
impacted by the
70.0 Dreamworld tragedy
in the past 2 years
60.0
50.0
A$m
90.7 90.0 89.1 89.1
82.4 82.8 82.0 83.5
40.0
30.0
55.1
40.9
20.0
10.0
0.0
FY09 FY10 FY11 FY12 FY13 FY14 FY15 FY16 FY17 FY18
Theme Parks - Australia
21 VRL FY18 ResultsFY18 ATTENDANCE IMPACT
Key factors impacting FY18 Theme Parks attendance:
• Continued effect of the Dreamworld tragedy
• Lower than expected attendances over the Easter school holidays April 2018
(coincided with the Commonwealth Games)
• New pricing strategy
• Migration to the acquisition of one day passes following the introduction of
the new ticket offering in December 2017 having a direct impact on yield
and attendances
• Recovery in June and July 2018 with a return to the higher priced annual
season and multi-day passes as discount resellers were removed from the
market effective 30 June 2018
22 VRL FY18 ResultsTHEME PARKS HIGHLIGHTS
• Strong attendance at Movie World driven by Hypercoaster and
extended-hours events Heroes and Villains and Afterglow
• New attractions at Sea World have improved the guest experience and
increased length of stay, including:
• Polar Bear Cub, Mishka
• The Reef - Castaway Bay splash zone
• Nickelodeon product Paw Patrol
• Seal Guardians seal show
• Strong performance from Special Events
• Carnivale at Sea World outperformed expectations, drawing
crowds with its new Light Laser Show
• Fright Nights and White Christmas at Movie World delivered
record results
• Room bookings and conference centre at Sea World Resort continue to
outperform expectations
• Village Roadshow Studios continues its successful run with the
production of Aquaman and Dora the Explorer as well as the
Commonwealth Games
• Wet ‘n’ Wild Las Vegas withstood a challenging year to deliver $2.4m of
EBITDA in FY18 despite a shortened holiday season and a severe heat
wave during the peak operating season
23 VRL FY18 ResultsASIAN THEME PARKS – INVESTING IN THE FUTURE
TWO KEY PROJECTS WITH MANAGEMENT AGREEMENTS / NO VRL EQUITY INVESTMENT
A SELECT NUMBER OF MAJOR PROJECTS ARE IN ADVANCED DISCUSSION – FOCUS ON
CONSULTATION AND MANAGEMENT AGREEMENTS
MISSION HILLS – WET‘N’WILD LAI SUN – LIONSGATE ENTERTAINMENT WORLD
OPENED APRIL 2018 OPENING IN 2Q CY19
24 VRL FY18 ResultsTHEME PARKS – OUTLOOK
Recovery expected to gain momentum in FY19
• Continued yield improvement from the new pricing strategy
• Full year impact of Topgolf
• New marketing thrust anchored by Sally Pearson
• Prudent capital spend driven by guest feedback, including
lower cost attractions which enhance guest appeal
• New exciting low capital expenditure attractions to open in
FY19 include
• Next generation Scooby Doo Coaster at Movie World
• Heartland, a new show at Australian Outback Spectacular
incorporating advanced technology
• Shaun the Sheep experience at Paradise Country
• Continue to adopt an uncompromising approach on safety,
benchmarked on the highest global industry standards
25 VRL FY18 ResultsCinema Exhibition 26 VRL FY18 Results
CINEMA EXHIBITION – KEY RESULTS

                                                 FY18      FY17
     Key results ($m unless stated otherwise)
     Paid Admissions - Australia (m) (1)         24.9      26.1                       •   Cinema Exhibition experienced softer trading
     Sales Revenue                              283.7     296.0                           compared to the prior year, driven by the
                                                                                          underperformance of key titles partially offset by
     Other Income                                29.0      30.3
                                                                                          Blockbuster releases in 4Q FY18
     Total Expenses                             (254.7)   (258.2)
     EBITDA - Australia                          58.0      68.1
                                                                                      •   Softer admissions were partially offset by higher
     EBITDA - Singapore (Share of Associate's
                                                                                          spend per person
                                                   -       8.4
     Profit) (2)
                                                                                      •   Continued focus on premium cinema concepts
     EBITDA - Other (3)                          0.1       0.1
                                                                                          such as $Junior and 4DX, as well as enhanced
     EBITDA - Total                              58.1      76.6                           food and beverage offerings
     Depreciation & Amortisation                (17.4)    (16.8)
     Interest Expense (Net)                      (4.5)     (4.5)
     PBT                                         36.2      55.3
     Total Capital Expenditure                  (23.2)    (17.4)

     Notes:
     (1) Paid Admissions include Admissions to cinemas in which VRL has an economic interest, taking no account of ownership
       structure.
     (2) Sale of GV Singapore completed October 2017, with equity accounting ceased from June 2017
     (3) Other includes Intencity, Belfast (exited on 31 May 2018) and iPic Theaters (25% owned, share of associate’s results).

27                                                                    VRL FY18 Results
CINEMA EXHIBITION - NEW SITES
THREE NEW SITES OPENED IN FY18
• Whitford, SA (Event managed)
• Palmerston, NT (Event managed)
• Plenty Valley, VIC (Village managed)
PLENTY VALLEY
• Village Cinemas’ first new location in 10 years, opened March 2018
• Located in the key northern growth corridor of Melbourne
• Showcases all of Village Cinema’s premium concepts
28 VRL FY18 ResultsCINEMA EXHIBITION - OTHER
IPIC ENTERTAINMENT
• iPic Entertainment (“iPic”) listed on the NASDAQ in
February 2018, raising US$15m
• iPic will utilise the capital raised to continue its
development plans to reach critical mass
• VRL’s contingent liability relating to this business has
reduced from US$24m to US$6m
• VRL’s ownership of iPic following the IPO is c.25% -
NASDAQ market value of US$24m as at 17 August 2018,
carried at nil in VRL’s accounts due to the equity
accounting standards
iPic Fulton Market
SINGAPORE
• Sale of 50% of Golden Village Cinema completed in
October 2017, with equity accounting ceasing from
June 2017
29 VRL FY18 ResultsCINEMA EXHIBITION – OUTLOOK
STRONG SLATE OF RELEASES IN FY19 ANTICIPATED TO PERFORM IN LINE WITH FY18
30 VRL FY18 ResultsFilm Distribution 31 VRL FY18 Results
FILM DISTRIBUTION – KEY RESULTS

                                    FY18    FY17
     Key results ($m)
     Sales revenue                 304.5    359.3
                                                                        •   Film Distribution trading was impacted by
     Other Income                   0.4      0.2
                                                                            underperformance of key titles
     Share of Associate's Profit    1.1      3.2
                                                                        •   Ongoing decline of the physical market has
     Total Expenses                (292.2) (341.5)                          not been fully offset by growth in the digital
     EBITDA                         13.8    21.2                            market

     Depreciation & Amortisation    (3.2)   (3.6)                       •   Continue to drive value from emerging
     EBIT                           10.6    17.7
                                                                            markets including SVOD and Digital
                                                                            Transactional, with contracts with key
     Interest Expense (Net)         (3.9)   (3.8)                           partners Stan and Netflix
     PBT                            6.8     13.8

     Total Capital Expenditure      (1.1)   (1.7)

32                                                   VRL FY18 Results
FILM DISTRIBUTION HIGHLIGHTS
CORE DISTRIBUTION BUSINESS - STREAMLINED MODEL
• ‘Hit’ driven business
• Optimised business operations with continued focus on cost
reduction on physical distribution
• Well positioned to pursue strategies to grow digital revenues
TV PRODUCTION
• Roadshow Rough Diamond released Romper Stomper on Stan,
with a second season planned
• Blink TV is working towards the production of the first season of
Eurovision Asia
FILMNATION
• Life Itself sold to Amazon Studios for worldwide release
• TV production I Know This Much is True sold to HBO
AUSTRALIAN FILM PRODUCTION
• Portfolio of quality Australian film projects has been identified.
These projects are at different stages of development and will
form part of Roadshow’s future content slate
33 VRL FY18 ResultsFIGHT AGAINST PIRACY
• Real progress in the fight against piracy - 450 pirate sites blocked
in FY18 through new Australian legislation
• Further 100 pirate sites sought to be blocked in September 2018
• Research indicates that piracy is down 42% on a year on year basis
• Increase in public awareness of the dangers of engaging in piracy
with real exposure to viruses, malware and ransomware – the
pirates’ business model is scamming people
• Further piracy reduction is anticipated
34 VRL FY18 ResultsFILM DISTRIBUTION – OUTLOOK
A PROMISING SLATE OF UPCOMING THEATRICAL AND PRODUCTION TITLES
35 VRL FY18 ResultsMarketing Solutions 36 VRL FY18 Results
MARKETING SOLUTIONS – KEY RESULTS

     Key earnings metrics ($m)   FY18    FY17
                                                              • FY18 result driven by continued demand for Card
     EBITDA                       8.3     9.8
     EBIT                         6.5     8.5                   products and the growth in Digital reward content and
     PBT                          4.1     6.0                   recurring promotions with key clients
     Total capital expenditure   (2.3)   (1.6)
                                                              • Marketing Solutions have expanded into new markets
                                                                with Edge entering Asia (Singapore HQ) and OPIA
                                                                moving into the USA and broader European region

                                                              • Costs related to additional staff and IT including
                                                                overheads, associated with expansion into US and Asia

                                                              • Investment made in platform capabilities to deliver
                                                                highly scalable and increasingly integrated promotional
                                                                solutions and to support international expansion

37                                               VRL FY18 Results
MARKETING SOLUTIONS HIGHLIGHTS & OUTLOOK
• Transforming into a business built around innovative
incentive technologies and laying a strong foundation for
local and international growth
• Strong promotional pipeline for Edge Asia, with a new office
established in Singapore
• Opia will continue to grow its existing customer base in the
UK and Europe, and extend its geographical reach by
developing relationships with key multinational clients
• Expanding its product offerings and looking to extend its
activity into other sectors
• Recent investment made to support growth from both new
business development and client acquisition
38 VRL FY18 ResultsCorporate 39 VRL FY18 Results
CORPORATE AND OTHER – KEY RESULTS

                                   FY18     FY17
     Key results ($m)                                           • Continued review of IT infrastructure and
     EBITDA - Corporate            (22.2)   (21.5)                technology to support improved eCommerce
     EBITDA - Digital & IT         (5.4)    (5.7)                 capabilities, employee productivity and
                                                                  consolidation of data
     EBITDA - Corporate & Other    (27.6)   (27.2)
     Depreciation & Amortisation   (1.7)    (1.1)               • Cost savings anticipated in FY19 as OneCo
     Interest Expense (Net)        (2.4)    (5.2)                 initiatives are implemented
     PBT                           (31.7)   (33.5)
                                                                • Executive Directors have agreed to a 25%
     Total Capital Expenditure     (3.6)    (5.1)
                                                                  reduction in their base remuneration and Non-
                                                                  Executive Directors have agreed to a 25%
                                                                  reduction in their fees as part of the OneCo
                                                                  initiative, effective July 2018.

40                                                   VRL FY18 Results
DIVIDENDS
• VRL Board is committed to shareholder return, while maintaining the ability to invest in the business
• No FY18 dividend declared - prudent approach during a time of short term earnings decline
• Intention is to reinstate dividends as soon as it is deemed appropriate
41 VRL FY18 ResultsDISCLAIMER
Non – IFRS Financial Information
The VRL group results are prepared under Australian Accounting Standards, and also comply with
International Financial Reporting Standards (“IFRS”). This presentation includes certain non-IFRS measures
including EBITDA and operating profit excluding material items of income and expense and discontinued
operations. These measures are used internally by management to assess the performance of the business,
make decisions on the allocation of resources and assess operational performance. Non-IFRS measures have
not been subject to audit or review, however all items used to calculate these non-IFRS measures have been
derived from information used in the preparation of the audited or reviewed (as applicable) financial
statements.
Included in the ASX Appendix 4E (pages 14 & 15) is a Reconciliation of Results which provides further detail
on the Non-IFRS financial information contained in this presentation.
42 VRL FY18 ResultsYou can also read