Thermoelectric Array Sensors with Selective Combustion Catalysts for Breath Gas Monitoring - MDPI
←
→
Page content transcription
If your browser does not render page correctly, please read the page content below
sensors
Article
Thermoelectric Array Sensors with Selective
Combustion Catalysts for Breath Gas Monitoring
Woosuck Shin 1, *, Tomoyo Goto 2 ID , Daisuke Nagai 1 , Toshio Itoh 1 , Akihiro Tsuruta 1 ,
Takafumi Akamatsu 1 and Kazuo Sato 3
 1    National Institute of Advanced Industrial Science and Technology (AIST), Shimo-Shidami, Moriyama-ku,
      Nagoya 463-8560, Japan; d-nagai@aist.go.jp (D.N.); itoh-toshio@aist.go.jp (T.I.); a.tsuruta@aist.go.jp (A.T.);
      t-akamatsu@aist.go.jp (T.A)
 2    The Institute of Scientific and Industrial Research, Osaka University, Ibaraki 567-0047, Japan;
      goto@sanken.osaka-u.ac.jp
 3    Department of Mechanical Engineering, Aichi Institute of Technology, Toyota 470-0392, Japan;
      sato@aitech.ac.jp
 *    Correspondence: w.shin@aist.go.jp; Tel.: +81-52-736-7107

 Received: 29 March 2018; Accepted: 13 May 2018; Published: 16 May 2018

 Abstract: Inflammable breath gases such as H2 and CH4 are used as bio markers for monitoring
 the condition of the colon. However, their typical concentrations of below 100 ppm pose sensitivity
 and selectivity challenges to current gas sensing systems without the use of chromatography.
 We fabricated a compact, gas-selective thermoelectric array sensor (TAS) that uses micro-machined
 sensor devices with three different combustion catalysts to detect gases such as H2 , CO, and CH4 in
 breath. Using Pt/Pt-W thin-film micro-heater meanders, Pd/Al2 O3 , Pt,Pd,Au/Co3 O4 , and Pt/Al2 O3
 catalysts were heated to 320, 200, and 125 ◦ C, respectively, and the gas sensing performances of
 the TAS for each gas and for a model breath gas mixture of 100 ppm H2 , 25 ppm CO, 50 ppm CH4 ,
 and 199 ppm CO2 in air were investigated. Owing to its high catalyst temperature, the Pd/Al2 O3
 catalyst burned all three gases, while the Pt,Pd,Au/Co3 O4 burned CO and H2 and the Pt/Al2 O3
 burned H2 selectively. To calibrate the gas concentration of the mixture gas without the use of a
 gas separation tool, linear discriminant analysis was applied to measure the sensing performance of
 TAS. To enhance the gas selectivity against H2 , a double catalyst structure was integrated into the
 TAS sensor.

 Keywords: thermoelectric device; array sensor;                     H2 ;   CO; CH4 ;       combustion catalyst;
 micro-electromechanical systems (MEMS)

1. Introduction
     Human breath is a highly complex mixture of more than 100 types of gases, including NO, CO2 ,
CO, NH4 , CH4 , H2 , and various volatile organic components (VOCs), many of which can provide
useful information in the monitoring of the human health condition [1]. H2 and CH4 are generated
in the human body by the fermentative reaction of bacteria, enabling the evaluation of the digestive
and absorptive functions in the intestine based on measurements of these gases in exhaled breath [2].
CO is exhaled by smokers and has been reported as a marker gas for various diseases [1,3].
     The techniques developed for the detection and measurement of breath gases can be generally
categorized into two major groups: (1) conventional analyzers that use gas chromatography (GC)
coupled with mass spectroscopy (MS) or flame ionized detection (FID) [4], recently developed ion
mobility spectrometry (IMS) [5] and proton-transfer-reaction (PTR) [6] technologies, and rather simple
systems comprising GCs coupled to metal oxide (MOX) sensors; and (2) e-Nose systems, which are

Sensors 2018, 18, 1579; doi:10.3390/s18051579                                        www.mdpi.com/journal/sensors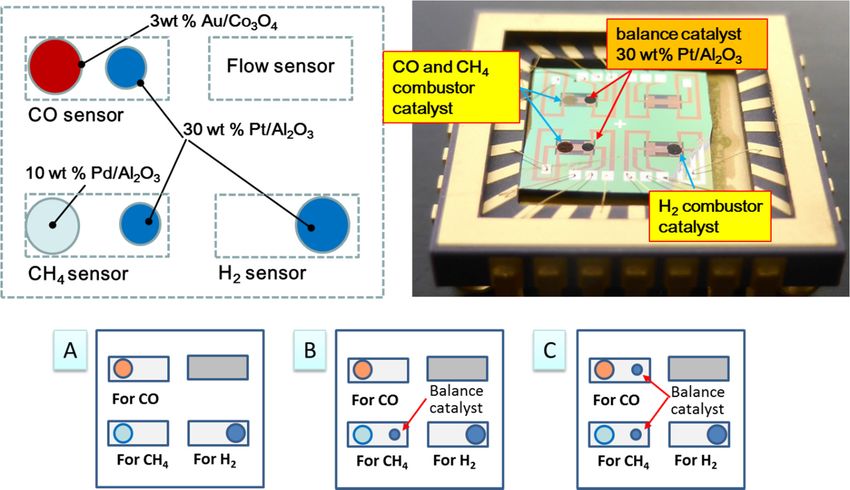
Sensors 2018, 18, 1579                                                                               2 of 10

commonly constructed as single [7] or array sensors [8]. Although the development of e-Nose systems
has been steady over the past few decades, multi-gas sensors for breath gas detection have yet to
emerge. Two major stumbling blocks have been the ability to detect specific gases selectively using a
single sensing element and the ability to detect gas precisely in humid conditions.
     Low-cost devices for breath analysis without the use of gas chromatography require the use
of highly selective and sensitive sensors. Previous studies reported the development of various
gas sensors, including semiconducting MOX sensor arrays [9] and micro-hotplate-based gas sensor
arrays [10,11]. For the specific analysis of CO and CH4 gas mixtures, a micromachined gas sensor
based on a catalytic thick film/SnO2 thin-film bilayer and a thin-film heater has been developed [12].
Recently, a thermoelectric gas sensor (TGS) based on a synergetic combination of catalytic combustion
and thermoelectric conversion has been developed for the detection of H2 [13]. Using TGS-based
techniques, a gas-flow-type prototype for the selective monitoring of H2 in breath gas has been
developed and tested [14] and an integrated multi-TGS sensor comprising three thermoelectric array
devices with ceramic catalysts for the combustion of CH4 , CO, and H2 has been developed and its
performance in detecting these gases at 5000 ppm has been preliminarily tested [15]. Although the
detection of the CO and CH4 ppm levels was not easy in these studies, the authors have subsequently
succeeded in measuring both gases down to 1 ppm [16–18]. However, measuring the ppm levels of
gas using a single micro-chip-type device remains challenging, with many technical, drift, and process
problems remaining, as the extreme fragility of the sensor membranes leads to a low process yield in
developing multi-sensor chips with four clean membranes.
     In this study, we improved the sensitivity of a thermoelectric array gas sensor (TAS) by applying
the working principle of a TGS with different combustion catalysts for the simultaneous detection
of CO, H2, and CH4 without gas separation to low-concentration gases at several ppm levels.
We investigated the performance of this sensor in an environment of simulated breath gases including
water and CO2 . Our results suggest that the proposed improved TAS is a promising candidate for
application as a simple, low-cost breath gas analyzer.

2. Experimental

2.1. Integration of Catalyst Combustor onto Array Sensor
      Figure 1 shows the catalyst deposition process and a photo of the proposed TAS device,
which comprises a 6 mm × 6 mm chip containing four thermoelectric device sensors. The sensors
are fabricated in a p-type B-doped SiGe pattern and a Pt/Pt-W multilayer micro-heater meander
pattern and incorporate combustion catalysts integrated onto a Si3 N4 -SiO2 multilayer membrane
on a double-side polished Si substrate. The B-doped SiGe thin film is prepared using a helicon
sputtering method (i-sputter, ULVAC, Inc., Kanagawa, Japan). The thin micro-heater meander films
are multi-layer sputter depositions of a 10-nm-thick Ta adhesion layer, a 200-nm-thick Pt layer, and a
10-nm-thick Pt-W layer, and are patterned using a lift-off process. The reverse side of the Si substrate
is etched out using an aqueous KOH solution to prepare the membrane structure. Details on the
processing and patterning of the SiGe thin film were previously reported in [11].
      Pt/Al2 O3 , Pt,Pd,Au/Co3 O4 , and Pd/Al2 O3 combustion catalysts with metal contents of 30, 3,
and 10 wt %, respectively, are used for the detection of H2 , CO, and CH4 , respectively. The Pt/Al2 O3
and Pd/Al2 O3 catalysts are prepared by mixing an aqueous solution dispersed with a colloid of
noble metal particles (Tanaka Kikinzoku Kogyo K.K.; mercaptosuccinic acid, with metal content
4 wt % and average particle diameter 3 nm) and a commercial alumina powder (Taimei Chemicals
Co., Ltd., Tokyo, Japan; average particle diameter 100 nm). The Pt,Pd,Au/Co3 O4 catalyst is prepared
by mixing an aqueous solution dispersed with the above colloid, as well as a colloid of Au metal
particles (Tanaka Kikinzoku Kogyo K.K.; mercaptosuccinic acid, Au content 2 wt %, average particle
diameter 3 nm) and a commercial cobalt oxide (Co3 O4 ) powder (Aldrich; average particle diameter
20–30 nm). The mixture solution is stirred at a temperature of 100, 90, and 70 ◦ C, respectively, until the
Sensors 2018, 18, 1579 3 of 10
water evaporates and the solid residue is baked again in air at 300 ◦ C for 2 h to obtain powder
catalysts,
Sensors which
2018, 18, are mixed
x FOR with an organic vehicle (a mixture of terpineol and ethyl cellulose) 3toof 10
PEER REVIEW
form ceramic pastes. The pastes are integrated onto the thin membrane of the TAS using an air
Engineering
dispenser (Musashi Inc.), and the TAS
Engineering Inc., is then Japan),
Tokyo, baked in
andairthe
atTAS
300 is°Cthen
for baked
2 h. The size
in air at of ◦ C catalyst
300the for 2 h. is
The constrained to a diameter
size of the catalyst of 0.4tomm,
is constrained or about
a diameter of 61% of the
0.4 mm, diameter
or about 61%of
of athe
single sensor
diameter of a[13]. After
single
package
sensor dicing,
[13]. After the catalysts
package dicing, are
the deposited onto
catalysts are the TASonto
deposited devicetheand
TASwire-bonded onto a ceramic
device and wire-bonded
ontopackage
a ceramic comprising 28 electrode
package comprising 28 pads (Kyocera
electrode Co., Kyoto,
pads (Kyocera Co.,Japan,
Kyoto,Ceramic PackagesPackages
Japan, Ceramic for MEMS
Sensors).
for MEMS Sensors).
Figure
Figure 1. Catalyst
1. Catalyst combustors
combustors deposited
deposited onto
onto Pt/Al2 2O
Pt/Al O33,, Pd/Al
Pd/Al2O
2O3, and Au/Co
3 , and 3O4 array
Au/Co sensor
3 O4 array devices
sensor
for the gas detection of H 2, CH4 , and CO, respectively.
devices for the gas detection of H2 , CH4 , and CO, respectively.
2.2. Sensor
2.2. Sensor Response
Response Test Test
The The gas response
gas response performance
performance of thewas
of the device device was investigated
investigated using a gas-flow-type
using a gas-flow-type test chamber.test
The chamber.
voltage signalThe from
voltage
the signal
TAS was from the TAS
recorded by was recorded
alternately by alternately
flowing a dry targetflowing a dryand
gas mixture target
drygas
mixture and dry air into the test chamber at a flow rate of 200 mL/min. Performance
air into the test chamber at a flow rate of 200 mL/min. Performance testing of the TAS was carried out testing of the
TAS was carried out using two types of gas mixture: (1) single gas mixtures
using two types of gas mixture: (1) single gas mixtures of H2 , CO, or CH4 in air; and (2) multiple gas of H 2 , CO, or CH 4 in air;
and (2)
mixtures of Hmultiple gas mixtures of H2 + CO + CH4 in air. The single gases were mixed at 0–100 ppm,
2 + CO + CH4 in air. The single gases were mixed at 0–100 ppm, while the multiple gases
were mixed in the ratio H2gases
while the multiple were mixed
:100/CO:25/CH in the ratio H2:100/CO:25/CH4:50/CO2:199 (ppm). The
4 :50/CO2 :199 (ppm). The composition ratio of the test gas
composition ratio of the test gas
is determined to simulate the maximum concentrationis determined toofsimulate the maximum
three inflammable gasesconcentration
in breath, andofthe three
inflammable
reference gas of thegases
COin breath, and the reference gas of the CO2 level is fitted to the H2 concentration.
2 level is fitted to the H2 concentration. Details on the gas concentrations in
Details on the gas concentrations
breath has been reported previously [2], in breath
whichhas been
is one reportedtimes
hundred previously [2], which
lower than is one hundred
the concentration
times lower than the
found in the human colon [19]. concentration found in the human colon [19].
To measure
To measure the combustion-induced
the gas gas combustion-induced catalyst
catalyst temperature
temperature change,
change, the the surface
surface temperature
temperature
of the catalyst was monitored using an IR camera that had
of the catalyst was monitored using an IR camera that had previously been calibrated using previously been calibrated using
thermocouples. In contrast to our previous experiments, it was difficult
thermocouples. In contrast to our previous experiments, it was difficult to read temperature change to read temperature change
usingusing
the IRthecamera,
IR camera,
whichwhich reflected
reflected the differences
the differences in concentrations:
in concentrations: in the
in the previous
previous experiments,
experiments,
concentrations of hydrogen gas in air as high as 1.0% were measured, leading
concentrations of hydrogen gas in air as high as 1.0% were measured, leading to catalyst temperature to catalyst temperature
increases of 40 °C; by contrast, the current experiments involved
increases of 40 ◦ C; by contrast, the current experiments involved temperature changes as temperature changes as low
lowas as
0.005
0.005°C◦ Cfor
forhydrogen
hydrogen concentrations
concentrations ofof1 ppm.
1 ppm.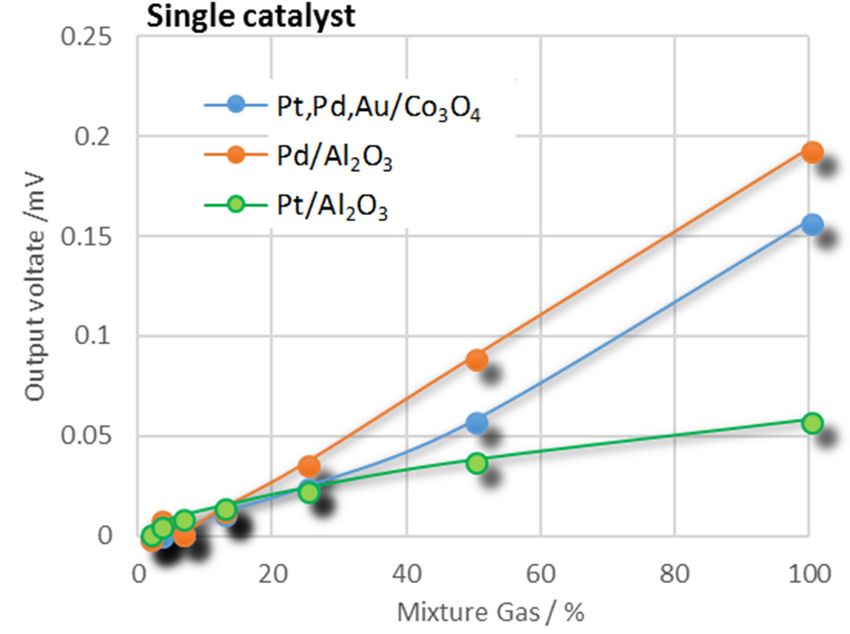
Sensors 2018, 18, 1579 4 of 10
Sensors 2018, 18, x FOR PEER REVIEW 4 of 10
3. Results and Discussion
O33,,Pt,Pd,Au/Co
3.1. Combustion Performance of Pt/Al22O Pt,Pd,Au/Co33OO4,4 and
, andPd/Al
Pd/Al2O
2O 3 Catalysts
3 Catalysts
The combustion
combustion performance
performanceofofthe thePt/Al
Pt/Al2 O
2O33,, Pt,Pd,Au/Co
Pt,Pd,Au/Co3O44,, and Pd/Al
Pd/Al22OO33catalysts
catalysts can
can be
estimated based
based on
on the
the voltage
voltagesignal
signalofofthe
theTAS
TAS(∆V),
(ΔV),which
whichisislinearly proportional
linearly to to
proportional thethe
increase in
increase
the temperature (∆T) as a result of the gas combustion on the catalyst:
in the temperature (ΔT) as a result of the gas combustion on the catalyst:
ΔV=
∆V αΔT
α∆T
Where α is the Seebeck coefficient of a thermoelectric film of boron-doped Si0.8Ge0.2.
where α is the Seebeck coefficient of a thermoelectric film of boron-doped Si0.8 Ge0.2 .
Table 1 lists the voltage signals, ΔV, produced by the respective TAS catalysts for three
Table 1 lists the voltage signals, ∆V, produced by the respective TAS catalysts for three inflammable
inflammable single gases at concentrations of 100 ppm. The sensor operational temperatures—that
single gases at concentrations of 100 ppm. The sensor operational temperatures—that is, the catalyst
is, the catalyst temperatures at which the best performances were produced in our previous
temperatures at which the best performances were produced in our previous study [16]—are increased
study[16]—are increased to 150 °C for H2 and decreased to 200 and 320 °C, respectively, for CO and
to 150 ◦ C for H2 and decreased to 200 and 320 ◦ C, respectively, for CO and CH4 . Figure S1 in the
CH4. Figure S1 in the Supplementary Material shows the typical response curves (in terms of ΔV with
Supplementary Material shows the typical response curves (in terms of ∆V with respect to time) of the
respect to time) of the Pd/Al2O3-catalyst TAS at various gas concentrations of CH4 in air with the air
Pd/Al2 O3 -catalyst TAS at various gas concentrations of CH4 in air with the air flow switched to the
flow switched to the gas mixture flow at an elapsed time of 100 s and then switched back to air at 200
gas mixture flow at an elapsed time of 100 s and then switched back to air at 200 s.
s.
Table 1. Combustion performance of sensors with different catalyst materials separately exposed to
Table 1. Combustion performance of sensors with different catalyst materials separately exposed to
single inflammable gases H2 , CH4 , and CO at air concentrations of 100 ppm. The sensors were heated
single inflammable
separately gases H2, CH4, and CO at air concentrations of 100 ppm. The sensors were heated
to avoid interference.
separately to avoid interference.
Catalyst
Catalyst ∆Vfor
ΔV forSingle
Single Gas
Gas at
at 100
100ppm
ppm(mV)
(mV)
Catalyst Material
Catalyst Material
Temp. (◦ C)
Temp. (°C) H
H22 CH
CH44 CO
CO
Pt/Al2 O
Pt/Al 2O
33 125
125 0.036
0.036 0.001
0.001 0.016
0.016
Pt,Pd,Au/Co
Pt,Pd,Au/Co 3O3O
44 200
200 0.056
0.056 0.001
0.001 0.053
0.053
Pd/Al2 O3 320 0.085 0.146 0.088
Pd/Al2O3 320 0.085 0.146 0.088
Figure 2 2shows
shows the detection
the detection performances
performances of 2the
of the Pt/Al Pt/Al2 O3 , 3OPt,Pd,Au/Co
O3, Pt,Pd,Au/Co 4, and Pd/Al3 O34-,
2O
and Pd/Al
catalyst 2 O3for
TASs -catalyst TASs
a H2:100 for a H2 :100
ppm/CO:25 ppm/CO:25
ppm/CH ppm/CH
4:50 ppm/CO :50 ppm/CO
2:199 4ppm 2 :199atppm
gas mixture gas
various
mixture at various
concentrations concentrations in air.
in air.
Figure
Figure 2.2. Gas
Gasresponses
responsesoror calibration
calibration curves
curves of three
of three TAS TAS catalyst
catalyst sensors
sensors for mixture
for mixture gas withgas with
relative
relative component concentrations
of H2 100of H2 100
COppm, COCH25 ppm, CH4 50 ppm, and CO2 199 ppm in air.
component concentrations ppm, 25 ppm, 4 50 ppm, and CO2 199 ppm in air. The x-axis
The x-axis represents the concentration of the mixture gas
represents the concentration of the mixture gas diluted by air. diluted by air.
From Table 1, the Pt/Al2O3 catalyst TAS had a combustion performance of ΔV = 0.036 mV for 100
ppm H2 at a catalyst temperature of 125 °C. At this temperature, CO was also burned by this catalystSensors 2018, 18, 1579 5 of 10
From Table 1, the Pt/Al2 O3 catalyst TAS had a combustion performance of ∆V = 0.036 mV for
100 ppm H2 at a catalyst temperature of 125 ◦ C. At this temperature, CO was also burned by this
catalyst with a ∆V of 0.016 mV for 100 ppm CO. However, the catalyst did not burn CH4 . From Figure 2,
it is seen that the Pt/Al2 O3 catalyst burned the CO + H2 + CH4 gas mixture more effectively than it
burned any of the gases separately. At concentrations above approximately 50%, the gas mixture ∆V
exceeded the sum of the values (0.05 mV) of the individual gases at 125 ◦ C, with the ∆V value for
the 25 ppm CO in the gas mixture approximately corresponding to that achieved by the 100 ppm CO
single gas.
In our previous studies of Pt/Al2 O3 catalysts on micro devices, we found that CO adsorption on
the catalyst surface prohibited the combustion of H2 at lower temperatures [18], making it necessary
to increase the catalyst temperature to burn out the adsorbed CO to activate the catalyst surface.
This enhanced combustion of CO could be explained in terms of activation with coexisting H2 ,
and these results were used to obtain operating temperatures of 320, 200, and 125 ◦ C, respectively,
for Pd/Al2 O3 , Pt,Pd,Au/Co3 O4 , and Pt/Al2 O3 -catalyst TAS devices. The Pt,Pd,Au/Co3 O4 -catalyst
TAS produced a ∆V of 0.53 mV in burning 100 ppm CO at a catalyst temperature of 200 ◦ C and
0.56 mV in burning 100 ppm H2 , but could not burn CH4 . The ∆V = 0.158 mV obtained by burning the
H2 + CO + CH4 gas mixture in air at 200 ◦ C was greater than the sum of the ∆V values (0.0825 mV)
obtained by burning the single gases separately at the same temperature.
The Pd/Al2 O3 catalyst burned all three gases at a catalyst temperature of 320 ◦ C, producing nearly
identical values of ∆V for H2 and CO, but a value approximately twice that for CH4 . At catalyst
temperatures above 350 ◦ C, the combustion of CH4 by the catalyst increased to even higher values
relative to that with CO. The CH4 selectivity, SCO/CH4 = ∆V CO /∆V CH4 , at a catalyst temperature of
360 ◦ C, was 0.5. At a catalyst temperature of 320 ◦ C, the TAS sensor was able to detect CO and CH4
down to a 1-ppm concentration level. However, several technical problems were encountered: the base
line of the sensor voltage signal was unstable and drifted, and the linearity of V with respect to gas
concentration became worse.
3.2. Double Catalyst to Enhance TAS Gas Selectivity
As demonstrated in Table 1 and Figure 2, linear discriminant analysis (LDA) could be applied
in assessing combustion performance. However, the gas selectivity of TAS is low, particularly for
CO and CH4 , and we therefore attempted to control the selectivity of these gases using a “double
catalyst structure” [8,19] to adjust the balance of the combustion heats of the catalysts deposited onto
the thermoelectric film in the micro-TGS devices to obtain further improvements in TAS selectivity.
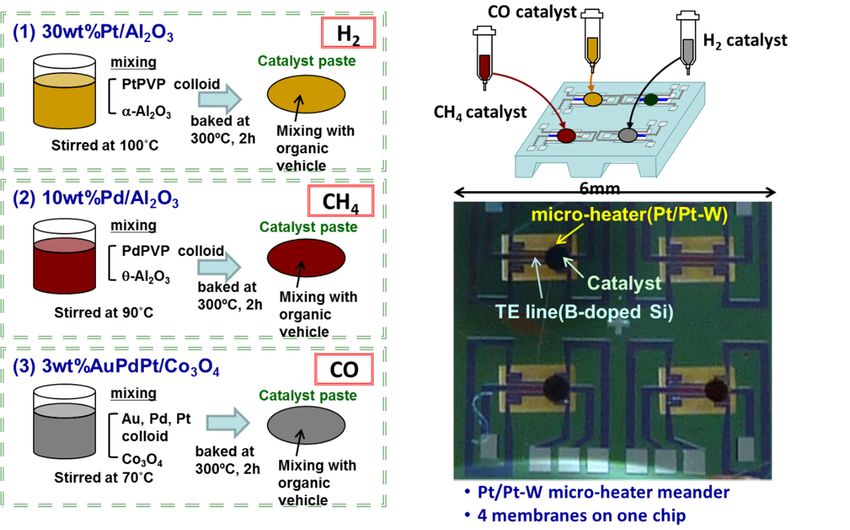
As shown in Figure 3, single and double 30 wt % Pt/α-Al2 O3 catalysts were deposited onto the
cold ends of separate thermoelectric patterns to produce two new TAS types (B and C, respectively,
with type-A indicating the original TAS configuration). Here, the hot side indicates the location of the
combustion catalyst, while the counter or cold side refers to the position of the additional catalyst on
the membrane.
As an example of the effects of the double catalyst process, the deposition of the Pt,Pd,Au/Co3 O4
catalyst (at point A) should allow for the oxidization of both H2 and CO. Depositing Pt/α-Al2 O3 ,
which is a combustion catalyst for H2 [13], onto the other side of membrane (point B) should reduce
the temperature difference between points A and B owing to the combustion heat of the Pt/α-Al2 O3 .
As a result, introducing a mixture of H2 and CO into this calorimetric-TGS device will inhibit the
sensor response of the Pt,Pd,Au/Co3 O4 catalyst to H2 .
The response ∆V values of A-, B-, and C-type TASs were measured for single and mixture gases.
Because of the CO absorption on the Pt/Al2 O3 catalyst, the driving temperature of the Pt/Al2 O3
catalyst was increased to 150 ◦ C to enable burning the CO. Figure 4 shows the responses of the three
TAS types for a H2 100 ppm, CO 25 ppm, CH4 50 ppm, and CO2 199 ppm gas mixture in air, which can
be used for calibration curves. The responses for single and mixture gases are listed in Table 2.of the gas composition equation can then be calculated under a simple assumption that the mixed
gas ΔV is the sum of the single gas response signals. As the immunity of TGS to water vapor has been
validated many times [13,14] and demonstrated in the hospital [20], the effect of water vapor can be
ignored. The results for the three TAS types for different mixture gas compositions are listed in Table
3. The
Sensors validity
2018, 18, 1579of the proposed method is validated by the closeness of these coefficients to6 the
of 10
original mixture gas compositions.
Figure 3. Additive deposition of 30 wt % Pt/α-Al2O3 catalyst, which combusts H2 gas to enhance gas
Figure 3. Additive deposition of 30 wt % Pt/α-Al2 O3 catalyst, which combusts H2 gas to enhance gas
selectivity. (A) Schematic of C-type TAS; (B) Following package dicing, catalysts are deposited onto
selectivity. (A) Schematic of C-type TAS; (B) Following package dicing, catalysts are deposited onto the
the TAS device and wire-bonded onto a ceramic package; (C) Positioning of additive 30 wt % Pt/α-
TAS device and wire-bonded onto a ceramic package; (C) Positioning of additive 30 wt % Pt/α-Al2 O3
Al2O3 catalyst for type-B and -C TASs.
catalyst for type-B and -C TASs.
Table 2. Combustion performance of TASs without/with double catalyst structure (A/B and C,
respectively) and different catalyst materials for single inflammable gases H2 , CH4 , and CO at
200 ppm/air and for gas mixtures.
Single Catalyst Type A
Single Gas 100 ppm Mix Gas (%)
Catalyst
H2 CH4 CO 25 50 100
Pt/Al2 O3 0.0386 0.0034 0.0256 0.016 0.036 0.055
Pd/Al2 O3 0.142 0.164 0.082 0.18 0.229 0.33
Pt,Pd,Au/Co3 O4 0.0307 0.12 0.083 0.025 0.078 0.158
One Double Catalyst Type B
Single Gas 100 ppm Mix Gas (%)
Catalyst
H2 CH4 CO 25 50 100
Pt/Al2 O3 0.230 0.000 0.033 0.025 0.078 0.158
Double 0.125 0.176 0.027 0.086 0.136 0.226
Pt,Pd,Au/Co3 O4 0.045 0.003 0.055 0.016 0.036 0.055
Two Double Catalyst Type C
Single Gas 100 ppm Mix Gas (%)
Catalyst
H2 CH4 CO 25 50 100
Pt/Al2 O3 0.150 −0.030 −0.030 0.023 0.0668 0.134
Double 0.092 0.146 −0.003 0.108 0.149 0.229
Double 0.110 0.120 0.260 0.0232 0.0485 0.152Sensors 2018, 18, 1579 7 of 10
Sensors 2018, 18, x FOR PEER REVIEW 7 of 10
Figure 4. Gas responses or calibration curves of TASs of types (a–c) for a mixture gas with relative
Figure 4. Gas responses or calibration curves of TASs of types (a–c) for a mixture gas with relative
component concentrations of H2 100 ppm, CO 25 ppm, CH4 50 ppm, and CO2 199 ppm in air. The x-
component concentrations of H2 100 ppm, CO 25 ppm, CH4 50 ppm, and CO2 199 ppm in air. The x-axis
axis represents the concentration of the air-diluted mixture gas.
represents the concentration of the air-diluted mixture gas.
Table 2. Combustion performance of TASs without/with double catalyst structure (A/B and C,
Figure 4a shows
respectively) andthe mixture-gas
different catalystresponse
materials for
for the type-A
single TAS, which
inflammable gases asH2noted above,
, CH4, and COhas the same
at 200
structure as theand
ppm/air TAS fordiscussed
gas mixtures.in the preceding sections. Unsurprisingly, the reaction is very similar to
that shown in Figure 2, although the ∆V values produced by the methane and CO sensors are higher;
Single Catalyst Type A
this difference can be attributed to the catalyst size difference between the respective devices, with the
Single Gas 100 ppm Mix Gas(%)
larger ∆V representingCatalyst
a response to a larger signal.
H2 CH4 CO 25 50 100
Figure 4b shows the response of the type-B TAS, which has a double catalyst in its CH4 sensor,
Pt/Al2O3 0.0386 0.0034 0.0256 0.016 0.036 0.055
to the gas mixture. Although the response is essentially the same as that of the type-A TAS, the methane
Pd/Al2O3 0.142 0.164 0.082 0.18 0.229 0.33
sensor in the former has a lower
Pt,Pd,Au/Co 3O4
∆V0.0307
than the sensor
0.12 in0.083the former.
0.025This0.078
reduced ∆V can be attributed
0.158
to the combustion One of H2Double
and COCatalyst
gas on the
TypePt/Al
B 2 O3 catalyst on the type-B methane catalyst. As seen
in Figure 4c, this double catalyst effect Single Gas more
becomes 100 ppmprominentMix in the CO sensor of the type-C TAS
Gas(%)
with double catalysts Catalyst
of Pt,Pd,Au/CoH O
3 24 and Pt/Al
CH4 2 CO O 3 . While the
25 ∆V 50 the 100
for mixture gas of the CO
catalyst of the type-APt/Al TAS2O is3equal to the sum
0.230 0.000 ∆V values
of the0.033 0.025of each
0.078single gas, the mixture gas
0.158
response of the type-CDouble catalyst is close0.125to that for
0.176 25 ppm
0.027 CO in
0.086air, i.e.,
0.136 0.226 is CO selective.
the catalyst
The CH4 sensor ofPt,Pd,Au/Co
the type-C 3TAS O4 produces
0.045 similar response
0.003 0.055 levels, demonstrating
0.016 0.036 0.055 the effect of the
double catalyst. Two Double Catalyst Type C
While all of the methane sensor Single responsesGasincrease
100 ppmlinearlyMix gas concentration (R2 > 0.998),
withGas(%)
the linearities of the Catalyst
CO (R2 > 0.995)H2and H 2 sensors
CH4
2
CO(R >0.956)25 are50lower100 and the increases in
their ∆V values decline in the
Pt/Al2O3 lower ppm ranges. Based on this
0.150 −0.030 −0.030 0.023 0.0668 0.134linear performance of the sensors,
LDA analysis was applied to
Double the sensing
0.092performance factors
0.146 −0.003 0.108 shown in Table 2 and
0.149 0.229 Figure 4 to evaluate
and distinguish the composition
Double of the mixture
0.110 gas. 0.260 0.0232 0.0485 0.152
0.120
The method for using multivariate analysis and calibration models built individually for each type
of sensor based on the previously identified single-gas responses is illustrated in Figure 5, where SnSensors 2018, 18, 1579 8 of 10
represents the parameters extracted from the response signals of the respective sensors (n = 1, 2, 3) and
a, b, c are coefficients indicating the respective gas components. The sensor responses are normalized
to that for a 100-ppm single gas in air—for example, S1 = a1 x + b1 y + c1 z. The coefficients of the
gas composition equation can then be calculated under a simple assumption that the mixed gas ∆V
is the sum of the single gas response signals. As the immunity of TGS to water vapor has been
validated many times [13,14] and demonstrated in the hospital [20], the effect of water vapor can be
ignored. The results for the three TAS types for different mixture gas compositions are listed in Table 3.
The validity of the proposed method is validated by the closeness of these coefficients to the original
mixture
Sensorsgas compositions.
2018, 18, x FOR PEER REVIEW 8 of 10
Figure 5. Schematic of the linear analysis method used in this work.
Figure 5. Schematic of the linear analysis method used in this work.
Table 3. Gas concentration for three TAS types by mixture gas composition.
Table 3. Gas concentration for three TAS types by mixture gas composition.
Type A Type B Type C Mixture Gas Composition
H2 conc. (x)
Type A121 62 B
Type 108Type C 100 ppm
Mixture Gas Composition
CH
H2 conc. 4 conc. (y)121
(x) 86 77
62 89 108 50 ppm100 ppm
CH4 conc.
CO(y)2 conc. (z) 86 21 77
46 −4 89 25 ppm 50 ppm
CO2 conc. (z) 21 46 −4 25 ppm
Using data on the linear relation of V to gas concentration, calibration can be applied to adjust
the gas concentration,
Using data for example,
on the linear relation offrom V to86gas
to concentration,
50 ppm CH4 for the type-Acan
calibration TAS. This canto
be applied provide
adjust the
simple gas composition estimates if the sensor response is stable throughout
gas concentration, for example, from 86 to 50 ppm CH4 for the type-A TAS. This can provide the calibration process
simple
gas and in actual use.
composition The effect
estimates of H
if the 2 combustion as a result of the double catalyst effect can be further
sensor response is stable throughout the calibration process and in
used to modify the responses of the types-B and -C TASs, as shown in Figure 5. However, the linear
actual use. The effect of H2 combustion as a result of the double catalyst effect can be further used to
equation analysis returns a negative CO gas composition for the type-C TAS, making it difficult to
modify the responses of the types-B and -C TASs, as shown in Figure 5. However, the linear equation
adjust the gas composition in this case, and reflecting the need of further modification and
analysis returns a negative CO gas composition for the type-C TAS, making it difficult to adjust the
improvement of the double catalyst method for the Pt,Pd,Au/Co3O4 and Pt/α-Al2O3 CO sensor. The
gas type-B
composition in this relatively
TAS estimates case, andlow reflecting the need of
H2 concentrations, further
which modification
results in relativelyand
highimprovement
CH4 and CO of
the double catalyst method for the Pt,Pd,Au/Co
responses. These results suggest that the type-A TAS O and Pt/α-Al O CO sensor. The
3 4is most suitable2for3discriminating separate type-B
gasTAS
estimates relatively
compositions low
using H2 concentrations,
linear analysis, while the which
doubleresults in relatively
catalyst types-B and high
-C CH
TASs4 and CO further
require responses.
These results suggest
modification thatof,
in terms thefortype-A
example,TAScatalyst
is mostsize
suitable for discriminating
or temperature, separate
even though bothgas compositions
sensors have
using linear analysis,
enhanced selectivitywhile theHdouble
against 2. catalyst types-B and -C TASs require further modification in
terms of,We
for are currently
example, developing
catalyst size oratemperature,
breath detection
evensystem
thoughbased
bothonsensors
the usehave
of a TAS structure
enhanced for
selectivity
which
against H2 .the linear modeling results of this study will be potentially useful in calibrating the sensors in
operating mode. As the sensor response changes as a result of altered installation packages or gas
flow, the linear calibration method demonstrated in this study can be used to explore, test, and
calibrate the performance of new array sensor packages with respect to specific operating modes.
However, such calibration challenges can also be overcome by combining sensors into an array (e.g.,
E-nose) in which differences in selectivity are exploited through statistical analysis. Further work
needs to be carried out, the calibration for the accuracy of the gas concentration with the estimationSensors 2018, 18, 1579 9 of 10
We are currently developing a breath detection system based on the use of a TAS structure for
which the linear modeling results of this study will be potentially useful in calibrating the sensors in
operating mode. As the sensor response changes as a result of altered installation packages or gas flow,
the linear calibration method demonstrated in this study can be used to explore, test, and calibrate
the performance of new array sensor packages with respect to specific operating modes. However,
such calibration challenges can also be overcome by combining sensors into an array (e.g., E-nose) in
which differences in selectivity are exploited through statistical analysis. Further work needs to be
carried out, the calibration for the accuracy of the gas concentration with the estimation error analysis
is necessary, and the cross-validation with human breath, including the interference of gas mixtures of
very low concentration analytes, should be tested carefully, for instance, acetone, which is of several
ppm in breath gas of diabetes.
4. Conclusions
TASs based on Pd/Al2 O3 , Pt,Pd,Au/Co3 O4 , and Pt/Al2 O3 combustion catalysts were developed
and assessed in terms of selective breath gas detection performance for the inflammable gases
H2 , CO, and CH4 at a variety of concentrations. Sensors of each catalyst type were fabricated as
micro-machined membranes and heated using Pt/Pt-W thin film heaters to 320 ◦ C (Pd/Al2 O3 ), 200 ◦ C
(Pt,Pd,Au/Co3 O4 ), and 125 ◦ C (Pt/Al2 O3 ), with the gas concentrations detected via the thermoelectric
conversion of combustion heat to a Seebeck voltage in linear proportion to the gas concentration.
The TAS responses for the single composition gases were evaluated separately and the responses
for mixture gases were tested to confirm that the sensors could detect the concentrations of the three
gases selectively and linearly. To enhance the limited gas selectivity against H2, a double catalyst
structure was integrated into the sensor membrane, which was shown to be effective in enhancing the
sensor performance and enabling a more favorable sensor design.
Based on this linearization of combined measurement results, it is possible to estimate the
concentrations of individual gases using a TAS, which could facilitate the simpler screening of lung
cancer patients and monitoring of breath gas concentrations. In future research, we will seek to
improve the sensitivity of the proposed thermoelectric multi gas sensor to gases at concentrations
at the several ppm level and to investigate the performance of this enhanced sensor in measuring
simulated real-environment gases such as water and CO2 . We believe that the sensor developed in this
study represents a promising candidate for use in a simple, low-cost breath gas analyzer.
Supplementary Materials: The following are available online at http://www.mdpi.com/1424-8220/18/5/1579/
s1, Figure S1: Gas response curves of the TAS with Pd/Al2 O3 catalysts for the various concentration of CH4 in air.
Author Contributions: W.S. designed the device and fabrication process, and wrote the paper; T.G., D.N., A.T.,
and T.A. processed the catalyst, thermoelectric device, and sensor devices, and performed the gas response
experiments; T.I. conceived of and designed the data analysis; performed the gas response experiments;
K.S. designed the device operating condition; All authors discussed the results and the implications of
this manuscript.
Acknowledgments: We are grateful to AIST Laboratory members, Michi Yamaguchi, Atsuko Hotta, and Takaomi
Nakashima for their technical support in the preparation of the devices and sensor tests used in this study,
and Maiko Nishibori of Kyushu University Japan for her comments on this study. This work has been supported
in part by the “Development Project for Extremely-Early Diagnostics Technologies for Human Diseases” of
Aichi Prefecture, Japan.
Conflicts of Interest: The authors declare no conflict of interest.
References
1. Philips, M.; Herrera, J.; Krishnan, S.; Zain, M.; Greenberg, J.; Cataneo, R.N. Variation in volatile organic
compounds in the breath of normal humans. J. Chromatogr. 1999, 729, 75–88. [CrossRef]
2. Shin, W. Medical applications of breath hydrogen measurements. Anal. Bioanal. Chem. 2014, 406, 3931–3939.
[CrossRef] [PubMed]Sensors 2018, 18, 1579 10 of 10
3. Ohira, S.; Toda, K. Micro gas analyzers for environmental and medical applications. Anal. Chim. Acta 2008,
619, 143–156. [CrossRef] [PubMed]
4. Cao, W.; Duan, Y. Current status of methods and techniques for breath analysis. Crit. Rev. Anal. Chem. 2007,
37, 3–13. [CrossRef]
5. Baumbach, J.I.; Eiceman, G.A. Ion Mobility Spectrometry: Arriving On Site and Moving Beyond a Low
Profile. Appl. Spectrosc. 1999, 53, 338A–355A. [CrossRef] [PubMed]
6. Herbig, J.; Amann, A. Proton Transfer Reaction-Mass Spectrometry Applications in Medical Research.
J. Breath Res. 2009, 3, 020201–020202. [CrossRef] [PubMed]
7. Fleischer, M.; Simon, E.; Rumpel, E.; Ulmer, H.; Harbeck, M.; Wandel, M.; Fietzek, C.; Weimar, U.; Meixner, H.
Detection of volatile compounds correlated to human diseases through breath analysis with chemical sensors.
Sens. Actuators B Chem. 2002, 83, 245–249. [CrossRef]
8. Peng, G.; Tisch, U.; Adams, O.; Hakim, M.; Shehada, N.; Broza, Y.Y.; Billan, S.; Abdah-Bortnyak, R.; Kuten, A.;
Haick, H. Diagnosing lung cancer in exhaled breath using gold nanoparticles. Nat. Nanotechnol. 2009, 4,
669–673. [CrossRef] [PubMed]
9. Tomchenko, A.A.; Harmer, G.P.; Marquis, B.T.; Allen, J.W. Semiconducting metal oxide sensor array for the
selective detection of combustion gases. Sens. Actuators B Chem. 2003, 93, 126–134. [CrossRef]
10. Hong, H.-K.; Shin, H.W.; Park, H.S.; Yun, D.H.; Kwon, C.H.; Lee, K.; Kim, S.-T.; Moriizumi, T.
Gas identification using micro gas sensor array and neural-network pattern recognition. Sens. Actuators
B Chem. 1996, 33, 68–71. [CrossRef]
11. Mitzner, K.D.; Sternhagen, J.; Galipeau, D.W. Development of a micromachined hazardous gas sensor array.
Sens. Actuators B Chem. 2003, 93, 92–99. [CrossRef]
12. Yaowu, M.; Okawa, Y.; Tajima, M.; Nakai, T.; Yoshitake, N.; Natsukawa, K. Micro-machined gas sensor array
based on metal film micro-heater. Sens. Actuators B Chem. 2001, 79, 175–181.
13. Nishibori, M.; Shin, W.; Houlet, L.F.; Tajima, K.; Izu, N.; Itoh, T.; Murayama, N.; Matsubara, I. New structural
design of micro-thermoelectric sensor for wide range hydrogen detection. J. Ceram. Soc. Jpn. 2006, 114,
853–856. [CrossRef]
14. Shin, W.; Nishibori, M.; Izu, N.; Itoh, T.; Matsubara, I.; Nose, K.; Shimouchi, A. Monitoring Breath Hydrogen
using Thermoelectric Sensor. Sens. Lett. 2011, 9, 684–687. [CrossRef]
15. Nishibori, M.; Shin, W.; Izu, N.; Itoh, T.; Matsubara, I. Fabrication of micro-multi-gas sensor for the detection
of hydrogen, carbon monoxide and methane in breath. Sens. Lett. 2011, 9, 773–777. [CrossRef]
16. Nagai, D.; Nakashima, T.; Nishibori, M.; Itoh, T.; Izu, N.; Shin, W. Thermoelectric gas sensor with CO
combustion catalyst for ppm level carbon monoxide Detection. Sens. Actuators B Chem. 2013, 182, 789–794.
[CrossRef]
17. Nagai, D.; Nishibori, M.; Itoh, T.; Kawabe, T.; Sato, K.; Shin, W. Ppm level methane detection using
micro-thermoelectric gas sensors with Pd/Al2 O3 combustion catalyst films. Sens. Actuators B Chem. 2015,
206, 488–494. [CrossRef]
18. Goto, T.; Itoh, T.; Akamatsu, T.; Sekino, T.; Shin, W. Relationship between the CO sensing performance of
micro-thermoelectric gas sensors and characteristics of PtPd/Co3 O4 and PtPd/SnO2 catalysts. Sens. Actuators
B Chem. 2017, 243, 847–955. [CrossRef]
19. Campbell, J.L.; Brkljača, R.; Taylor, K.M.; Burgell, R.E.; Yao, C.K.; Ward, S.A.; McSweeney, C.S.; Muir, J.G.;
Gibson, P.R. A human pilot trial of ingestible electronic capsules capable of sensing different gases in the gut.
Nat. Electron. 2018, 1, 79–87.
20. Sakai, D.; Hirooka, Y.; Kawashima, H.; Ohno, E.; Ishikawa, T.; Suhara, H.; Takeyama, T.; Koya, T.; Tanaka, H.;
Iida, T.; et al. Increase in breath hydrogen concentration was correlated with the main pancreatic duct
stenosis. J. Breath Res. 2018, 12, 36004. [CrossRef] [PubMed]
© 2018 by the authors. Licensee MDPI, Basel, Switzerland. This article is an open access
article distributed under the terms and conditions of the Creative Commons Attribution
(CC BY) license (http://creativecommons.org/licenses/by/4.0/).You can also read