COVID-19 DISPARITIES IN MOBILITY RESPONSES TO - Squarespace
←
→
Page content transcription
If your browser does not render page correctly, please read the page content below
D ISPARITIES IN M OBILITY R ESPONSES TO
                                     COVID-19

                                      Joshua Coven∗
                                       Arpit Gupta†

                                       May 15, 2020

                       Click here for the latest version of the paper

                                           Abstract

  We investigate the role of demographic differences in mobility in explaining dispar-
  ities in COVID-19 outcomes in New York City. We find: 1) New York City residents
  in richer neighborhoods are substantially more likely to flee the city, 2) Low-income,
  black, and Hispanic neighborhoods exhibit more work activity during the day, and
  3) these neighborhoods also exhibit less sheltering in place activity during non-work
  hours. Measured disparities in COVID-19 cases are attenuated after accounting for
  these mobility responses. Our results point to important inequities in access to shel-
  tering options during pandemics within cities.

∗ NYU   Stern School of Business, jcoven@stern.nyu.edu
† NYU   Stern School of Business, arpit.gupta@stern.nyu.edu (Corresponding Author)

                                               1
I   I NTRODUCTION

COVID-19 has disproportionally and negatively impacted underprivileged populations.
As we document in Figure I, and has been commonly remarked upon in popular press,
this pandemic has particularly affected low-income individuals, African-Americans, and
Hispanics, with African-Americans suffering as much as 32% of COVID-19 deaths de-
spite making up 13% of the population.1 While this disproportionate disease burden may
reflect long-standing disparities in health outcomes in these communities, it may also
reflect novel patterns of mobility and exposure with respect to this new infection.

   This paper uses mobile phone Global Positioning System (GPS) data to examine the
mobility responses of neighborhoods in New York City affected by COVID-19. We show
three key findings regarding differential mobility responses across neighborhoods. First,
richer and younger neighborhoods see far greater increases in the propensity of indi-
viduals to leave the city, starting around March 14, 2020. These individual moves are
well-proxied by networks of Facebook friends in the areas they move to, suggesting that
richer and younger New York City residents are able to shelter in second homes and with
friends and family away from the epicenter of the outbreak. Second, we find differential
patterns of sheltering in place during the pandemic in low-income, black, and Hispanic
neighborhoods. This is the case during normal work hours, when it is plausible that
members of these populations are likely to be frontline workers, while other populations
are more easily able to work remotely. The same is true during non-work hours, when
adherence to shelter in place orders may depend on the frequency of visits to retail es-
tablishments instead of ordering food and groceries delivery services, or when essential
workers might be required to work longer hours.

   These findings complement other well-established health disparities which may im-
pact the severity of COVID-19 for different populations, such as in Wong, Shapiro, Boscardin,
  1 See  https://www.nytimes.com/2020/04/07/us/coronavirus-race.html    and   https://www.
apmresearchlab.org/covid/deaths-by-race.

                                            2
and Ettner (2002) and Trivedi, Zaslavsky, Schneider, and Ayanian (2005). We do not
argue that mobility patterns are the sole contributing factor to disparities in COVID-19
outcomes, but instead that patterns of mobility may leave more vulnerable populations
uniquely exposed to this pandemic.
This work contrasts with existing popular press and literature, which has emphasized
the role of population density in isolation as a risk factor for COVID-19. Angel, Blei,
Lamson-Hall, and Tamayo (2020) for instance highlights the role of density in explaining
cross-city patterns of exposure to COVID-19 infection. Our work emphasizes the role of
different mobility patterns within the city. The wealthy may have access to different pro-
tective measures against the same baseline levels of population density. The flexibility to
work remotely allows individuals to limit outdoor physical presence and more readily
leave the city to shelter with friends and family, second homes provide protective insur-
ance against continued presence in the city, and access to additional delivery options may
improve adherence to stay-in-place orders.
Our work is most closely related to Almagro and Orane-Hutchinson (2020) which
links demographic exposure in New York City to COVID-19 case loads. This work pro-
vides more direct evidence on physical presence channels linking occupational type and
COVID-19 outcomes, incorporates behavioral responses outside of work hours, and adds
evidence on extensive margin responses of leaving the city. Our work is also closely
linked to a rapidly growing literature using mobile phone geolocation data to assess the
spread of COVID-19. Most closely related is work by Chiou and Tucker (2020), which
finds shelter-in-place effects vary by income. This paper differs by considering the role
of leaving the city, connecting mobility with actual COVID exposure, and incorporating
analysis of other demographic groups. Other work (Allcott, Boxell, Conway, Gentzkow,
Thaler, and Yang, 2020; Barrios and Hochberg, 2020; Engle, Stromme, and Zhou, 2020;
Painter and Qiu, 2020; Andersen, 2020) has looked at political partisanship and COVID-
19 responses. Prior work, such as Athey, Ferguson, Gentzkow, and Schmidt (2019), Chen,
3Haggag, Pope, and Rohla (2019), and Chen and Rohla (2018), has used mobile phone
geolocation data to examine segregation, racial disparities in voting waiting times, and
partisanship.
II D ATA AND S PECIFICATION
II.A Data
Mobile location data was sourced from VenPath—a holistic global provider of compliant
smartphone data. We obtain unique data on smart phone GPS signals. Our data provider
aggregates information from approximately 120 million smart phone users across the
United States. GPS data were combined across applications for a given user to produce
pings corresponding to time stamp-location pairs. Ping data include both background
pings (location data provided while the application is running in the background) and
foreground pings (activated while users are actively using the application). Our sample
period covers the period February 1–April 1, 2020.
We connect this data with ZIP-level COVID-19 infection data for New York City,2 IRS
SOI Tax Statistics Data to provide ZIP-level income,3 and Census ACS data to obtain de-
mographics. We also use county-level Facebook data as discussed in Bailey, Cao, Kuchler,
Stroebel, and Wong (2018) and applied in reference to COVID-19 in Kuchler, Russel, and
Stroebel (2020).
II.B Specification
To isolate the mobility behavior of New York City residents, we employ multiple screens
to filter out commuters and visitors, and then assign New York City residents a “home
2 Available
at https://github.com/nychealth/coronavirus-data
3 Available at https://www.irs.gov/statistics/soi-tax-stats-individual-income-tax-
statistics-zip-code-data-soi
4tract:” the Census tract they spend the most time in during night hours. The first filter
separates those who spend the night in New York City from those who commute into
New York City. We select from the anonymous users those who have the majority of their
pings between 6pm and 8am in New York City on at least 3 different days in February,
as opposed to any non-New York City county in the US. The second screen enforces a
minimum required data density, and keeps only those with at least 3 pings on at least 5
days in the data in New York City during night hours, and the same requirements during
work hours. The data are joined to Census tracts from New York City Open Data to
identify the “home tract” for each user. For each of these users, we find their modal tract
during night hours, if it has at least 2 pings. We assign them a home tract if they have a
tract that is their modal tract on at least 5 nights of data, resulting in our population of
372,787 unique users for our base analysis.
II.C Leaving the City
II.C.1 Where New York City Residents Go
For identified New York City residents in our sample, we find their modal county each
night of the data in March. For each county, we count the number of unique users in the
last week of March who were not there in the first week of March, as the number of New
York City residents moving to that county. We link this to Facebook’s social connectedness
data at the county level to connect these moves against pre-existing social networks. We
define social connections, as in Kuchler, Russel, and Stroebel (2020), between counties i
and j as:
FB Connectionsij
SocialConnectednessij = (1)
FB Usersi × FB Users j
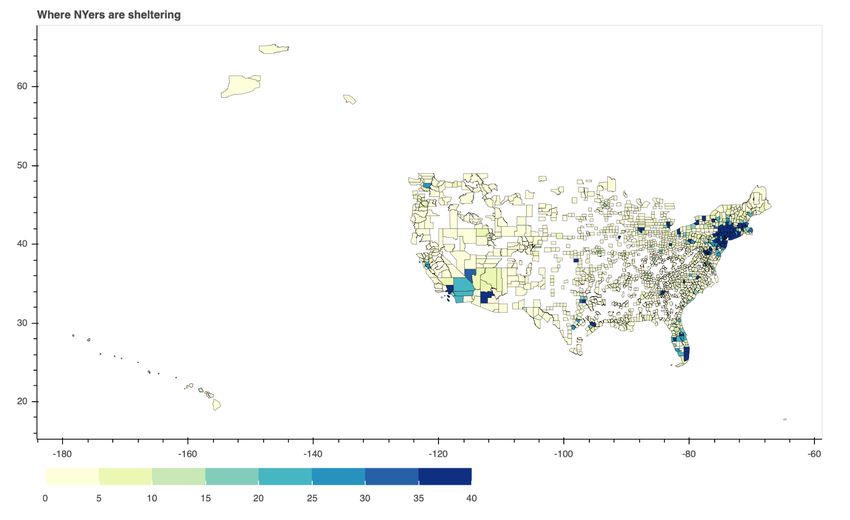
5II.C.2 Who Leaves New York City
For each user in our sample population of New York City residents, we identify a modal
county in the US each night of data. We aggregate based on the home tracts of our sam-
ple population. For each home tract on each day, we observe the fraction of the tract’s
residents who spend the night in a New York City county. We examine the fraction that
has left the city at the tract level with respect to income, race, education, and age (from
the Census ACS data). We look at the difference in this fraction at the start of March and
the end of March to see the fraction of residents leaving.4
II.D Adherence to Shelter-in-Place
We examine the population at the home tract-level and then aggregate to the home ZIP-
level. We flag each ping for each user if it occurs within their home tract. For each home
tract each hour, we take the average of this flag to get the fraction of pings by residents
of that tract that occur within the tract. This is our “activity” measure. If it is 0, then all
pings by people who have homes in that tract are outside of the tract for that hour. If it is
1, then everyone who lives in that tract is at home.
We exclude tract-hours that do not have 10 unique users pinging. We also exclude
tracts with population (from the Census) less than 1000. We exclude entirely tracts that in-
tersect with highways, bridges, and tunnels, because the pings in those tracts are heavily
influenced by commuters (geographic data of the bridges, highways, and tunnels comes
from New York City Open Data). We also trim the tracts that have the top 5%-ile of
data/population because some tracts have much more data than others, and appear to
be contaminated by commuters as well. Tracts with median income of 0 are excluded as
well. These tracts are aggregated to the ZIP-level. ZIPs with less than 60,000 people are
excluded from the analysis. We show time of day response across the last period of our
sample, from March 23–April 1.
4 For this reason, we can observe negative moves from a particular tract.
6II.E Impact on Mortality
To examine the impact of mobility on mortality, we link our ZIP-level activity and fraction
leaving New York City variables to ZIP-level COVID-19 case data, as of April 15, 2020.
III R ESULTS
III.A Leaving the City
In Figure II, we show responses of individuals in leaving New York City by tract. We ob-
serve stark patterns in the response of individuals along this extensive margin: residents
of Manhattan are substantially more likely to leave the city after the crisis, as are other
wealthy parts of the city in Brooklyn. By contrast, residents in Queens—the epicenter of
the COVID-19 pandemic in New York City—Brooklyn, and the Bronx are overwhelm-
ingly more likely to stay in the city.
We confirm the role of income as a factor in explaining moves away from the city
in Figure III, which shows a heatmap of responses by tract and date. Each observation
reflects the fraction of individuals who have left that tract away from New York City,
as of each day in our sample. Panel A of this figure shows the responses for all tracts,
while Panel B shows the responses in tracts with median household incomes in excess of
$100k. We find a large breakpoint in our sample in March 14, as reflected in the sharp
changes in colors beginning on that date in a number of tracts, corresponding to a sharp
rise in the increase of former New York City inhabitants leaving the city. This break comes
just before Mayor Bill Di Blasio ordered schools, restaurants, bars, cafes, entertainment
venues, and gyms in the city closed on March 16.5
These shifts in leaving the city, however, are concentrated in the higher-income Census
tracts, suggesting that richer New York City residents were disproportionately able to
5 See https://www1.nyc.gov/assets/home/downloads/pdf/executive-orders/2020/eeo-100.pdf.
7take advantage of the option to flee the city and escape physical COVID-19 exposure in
the city. These results are confirmed in Figure IV, which shows that the propensity to
leave the city is strongly increasing in local income, and decreasing in the fraction of the
tract that is African-American and under 30. These results are large in magnitude and
statistically significant—moving from a tract at the bottom quartile of income to the top
quartile raises the fraction of New York City residents who leave by about 3 percent, or
about the same as the unconditional average of the number of New York City residents
who leave.
Consistent with the idea that departing New York City residents are sheltering with
friends, family, or in second homes, Figure V finds a strong link between the locations
that New York City residents leave to and their pre-existing social connections. Panel A
of this Figure plots the number of out-of-town New York City residents sheltering across
American Counties. Panel B of this Figure shows a binscatter plot of the log of social
connections between New York City and the county that residents exit to, against the
number of New York City residents who exit to that county, as a fraction of the county’s
residents. The strong relationship suggests that New York City residents with the ability
to leave generally went to areas where they had pre-existing social networks, and could
take refuge with friends and family. This finding also potentially helps to explain the re-
sult in Kuchler, Russel, and Stroebel (2020), that greater social connections with Westch-
ester (another pandemic hub) helps to predict subsequent COVID-19 deaths. A plausible
transmission mechanism is the refugee behavior of New York City residents into these
socially connected regions, which has been frequently cited by local officials as a possi-
ble transmission mechanism of the disease.6 This relationship is robust to controls for
physical distance between New York and other counties, pointing to social connections
specifically as a key driver of exit destination choices.
6 For instance, the Governor of Rhode Island mandated a 14-day quarantine for New York City res-
idents entering the state, punishable with a fine or arrest, see https://www.nytimes.com/2020/03/28/
us/coronavirus-rhode-island-checkpoint.html. Preliminary results suggest that counties with greater
New York evacuees do have more COVID-19 cases.
8III.B Adherence to Shelter-in-Place
We also examine the mobility responses of residents who stay, and also find strong dif-
ferences in responses across demographic groups. In Figure VI, we show a heatmap of
mobility responses by hour of day across tracts ordered by different demographic groups,
over the last portion of our sample from March 23–April 1. We calculate the average num-
ber of residents whose ping data indicates that their physical activity resides in their home
tract, instead of another portion of the city. This measure is intended quantify the amount
of sheltering at home taking place at the tract-level.7
Panel A shows mobility responses ordered by tract-income. A darker green color
indicates that individuals, in that tract and hour of day, were more likely to stay in their
home tract, instead of being observed in a different tract in the city. We find darker green
colors in the bottom of the plot across times of day, corresponding to the higher-income
tracts. These results suggest that richer areas were able to shelter more effectively—both
during normal work hours, as well as in after work hours. We find evidence that areas
that are more black shelter less (Panel B), as well as areas that are more Hispanic in Panel
A of Figure VII, and areas that are less educated in Panel B of Figure VII.
We examine sheltering responses during daytime hours in Figure VIII, and find that
lower-income, Hispanic, and African-American areas show more out-of-tract activity dur-
ing these ties. These results are consistent with Almagro and Orane-Hutchinson (2020),
suggesting that since minority and lower-income workers are more likely to be front-line
employees, they are more likely to be working out of the home during those hours. How-
ever, we also find that individuals are more likely to be out of tract during nighttime
hours as well, in Figure IX. These results suggest that these populations are less likely to
adhere to strict shelter-in-place measures. We speculate that this may be due to the need
7 We use the home tract, rather than the precise building, to incorporate possible measurement error
in ping locations. As a result, we may misclassify short trips outside the home, but within the tract, as
representing stay at home behavior.
9for more frequent retail visits, for instance, while delivery options for groceries and food
may be more common in more affluent areas. An alternative possibility is that these pop-
ulations may be forced to work additional hours as essential personnel. Future work will
explore the nature of these responses.
Overall, our findings indicate that more vulnerable populations exhibit greater mobil-
ity patterns out of the home, increasing their likelihood of exposure to COVID-19.
III.C Impact on Mortality
In Figure X, we return to our motivating Figure I on COVID-19 exposure by different
demographic groups.8 We now compare the impact of different tracts on cases, after
controlling for two mobility indicators: the number of individuals leaving the city, as
well as the mobility of individuals in the city. We plot the residuals from a regression of
caseload per capita on those two mobility regressions (adding back the constant). Panels
A and B suggest a much more flat relationship—suggesting that differential exposure
through mobility may explain much of the apparent relationship between demographic
variables and COVID-19 exposure. In additional regressions, available upon request, we
find that the magnitude and statistical significance of demographic factors disappears
after inclusion of local mobility factors.
We caution that it is unlikely that mobility, alone, explains the full nature of COVID-
19 sensitivity. In particular, the severity of the disease for different demographic groups
may be very different, reflecting other health disparities in comorbidities such as dia-
betes. We continue to find a more positive relationship in Panel C, examining Hispanic
areas, suggesting that these populations may have additional mobility risk factors other
than the ones examined here. While these results are not fully conclusive, these correla-
tions provide important suggestive evidence that mobility factors may drive a portion of
8 While the number of cases per capita may reflect testing bias, in Appendix Figure XI we examine the
fraction of test results which come back positive. We find even higher positive test results as a fraction
in lower-income, higher African-American, and higher Hispanic areas. These results may suggest that, if
anything, vulnerable population cases are undercounted.
10the relationship between COVID-19 caseload and demographic factors, to be pursued in
future research.
IV C ONCLUSION
Even in a dense urban hotspot for coronavirus, we find important spatial inequities in
mobility that have consequences for racial and income disparities. Richer New York City
residents are able to take advantage of the insurance provided by social capital and the
availability of housing outside of the city to leave the epicenter of the pandemic. We
document a substantial increase in out-of-town exits in higher-income parts of New York
City, destined for areas with high social connections to New York CIty. Among residents
who stay, we also find disparities in movement both during typical work hours as well
as in the night-time. Lower-income areas, regions with higher Hispanic and black popu-
lations exhibit greater out-of-tract mobility during both work hours as well as during the
nighttime. These mobility patterns are consistent with lower-income and minority pop-
ulations being more likely to occupy frontline occupation roles and make more frequent
retail visits, potentially increasing their exposure to COVID-19. Controlling for these mo-
bility patterns greatly lowers the apparent contribution of these demographic factors on
COVID-19 caseload.
R EFERENCES
Allcott, H., L. Boxell, J. C. Conway, M. Gentzkow, M. Thaler, and D. Y. Yang, 2020, “Polar-
ization and Public Health: Partisan Differences in Social Distancing during the Coron-
avirus Pandemic,” Working Paper 26946, National Bureau of Economic Research.
Almagro, M., and A. Orane-Hutchinson, 2020, “The differential impact of COVID-19
across demographic groups: Evidence from NYC,” Working Paper.
11Andersen, M. S., 2020, “Early evidence on social distancing in response to Covid-19 in the
United States,” Working Paper.
Angel, S., A. M. Blei, P. Lamson-Hall, and M. M. S. Tamayo, 2020, “The Coronavirus and
Cities: Explaining Variations in the Onset of Infection and in the Number of Reported
Cases and Deaths in U.S. Metropolitan Areas as of 27 March 2020,” Working Paper.
Athey, S., B. Ferguson, M. Gentzkow, and T. Schmidt, 2019, “Experienced Segregation,”
Working paper.
Bailey, M., R. Cao, T. Kuchler, J. Stroebel, and A. Wong, 2018, “Social connectedness:
Measurement, determinants, and effects,” Journal of Economic Perspectives, 32(3), 259–
80.
Barrios, J. M., and Y. V. Hochberg, 2020, “Risk Perception Through the Lens of Politics in
the Time of the COVID-19 Pandemic,” Working Paper.
Chen, M. K., K. Haggag, D. G. Pope, and R. Rohla, 2019, “Racial Disparities in Voting
Wait Times: Evidence from Smartphone Data,” Working Paper 26487, National Bureau
of Economic Research.
Chen, M. K., and R. Rohla, 2018, “The effect of partisanship and political advertising on
close family ties,” Science, 360(6392), 1020–1024.
Chiou, L., and C. Tucker, 2020, “Social Distancing, Internet Access and Inequality,” Work-
ing Paper 26982, National Bureau of Economic Research.
Engle, S., J. Stromme, and A. Zhou, 2020, “Staying at Home: Mobility Effects of COVID-
19,” Working Paper.
Kuchler, T., D. Russel, and J. Stroebel, 2020, “The Geographic Spread of COVID-19 Cor-
relates with Structure of Social Networks as Measured by Facebook,” Working Paper
26990, National Bureau of Economic Research.
12Painter, M. O., and T. Qiu, 2020, “Political Beliefs affect Compliance with COVID-19 Social
Distancing Orders,” Working Paper.
Trivedi, A. N., A. M. Zaslavsky, E. C. Schneider, and J. Z. Ayanian, 2005, “Trends in the
quality of care and racial disparities in Medicare managed care,” New England Journal
of Medicine, 353(7), 692–700.
Wong, M. D., M. F. Shapiro, W. J. Boscardin, and S. L. Ettner, 2002, “Contribution of major
diseases to disparities in mortality,” New England Journal of Medicine, 347(20), 1585–1592.
13FIGURE I: COVID-19 Cases in NYC by Demographics
Panel A: COVID-19 Cases by ZIP Income
Positive cases per capita by income
0.025
Positive cases per capita
0.020
0.015
0.010
0.005
3.5 4.0 4.5 5.0 5.5 6.0 6.5
Log(income per tax return)
Panel B: COVID-19 Cases by ZIP by Fraction African-American
Positive cases per capita by % black
0.025
Positive cases per capita
0.020
0.015
0.010
0.005
0.0 0.2 0.4 0.6 0.8
Fraction of zipcode that is black
Panel C: COVID-19 Cases by ZIP by Fraction Hispanic
Positive cases per capita by % hispanic
0.025
Positive cases per capita
0.020
0.015
0.010
0.005 14
0.0 0.2 0.4 0.6
Fraction of zipcode that is hispanicFIGURE II: Propensity to Leave NYC by Tract
15FIGURE III: Propensity to Leave NYC by ZIP Income
Panel A: Heatmap of Tract Propensity to Leave NYC by Date
9001 % of residents in NYC by median household income
22455
0.90
Fraction of Residents Who Spend the Night in NYC
27846
Tracts sorted by median household income
33182
36875
0.75
40779
44266
48911
0.60
52580
57222
62604
0.45
69089
79526
92891
0.30
232768
Feb 29
Mar 02
Mar 04
Mar 06
Mar 08
Mar 10
Mar 12
Mar 14
Mar 16
Mar 18
Mar 20
Mar 22
Mar 24
Mar 26
Mar 29
Date
Panel B: Heatmap of Tract Propensity to Leave NYC by Date, $100k > tracts
100110 % of residents in NYC by median household income
100842
102356 0.90
Fraction of Residents Who Spend the Night in NYC
Tracts sorted by median household income
103792
106176
0.75
108917
110750
113846
0.60
117474
121250
126491
0.45
131250
144167
160833
0.30
232768
Feb 29
Mar 02
Mar 04
Mar 06
Mar 08
Mar 10
Mar 12
Mar 14
Mar 16
Mar 18
Mar 20
Mar 22
Mar 24
Mar 26
Mar 29
Date
16FIGURE IV: Fraction Change in Out of Town Visits by Demographics
Panel A: Change in Out of Town Visits by ZIP Income
Panel B: Change in Out of Town Visits by Fraction African-American
Panel C: Change in Out of Town Visits by Fraction Under 30
Notes: Panel A shows the average income of ZIPs against the17 fraction of people in each ZIP who test positive for COVID-19.
Panel B repeats the exercise for the fraction who are black, and Panel C for the fraction that is under 30. COVID-19 case data are
drawn from https://github.com/nychealth/coronavirus-data, income data is drawn from the IRS SOI Tax Statistics at https:
//www.irs.gov/statistics/soi-tax-stats-individual-income-tax-statistics-zip-code-data-soi, and demographic data
are drawn from the ACS.FIGURE V: Propensity to Leave NYC by ZIP Income
Panel A: Counties with Presence of Individuals Departed from NYC
Panel B: County NYC Residents against Social Connections with NYC
New Yorkers Traveling to Counties by Social Connectedness
0.00025
Number of NYer's Going to County Per Capita
0.00020
0.00015
0.00010
0.00005
0.00000 4 5 6 7 8
Log(Social Connectedness)
18FIGURE VI: Time of Day Activity by Demographics—Income and Fraction African-
American
Panel A: Time of Day Mobility by ZIP Income
27.58 Activity in each ZIP by income per tax return
29.44
31.27 0.90
33.23
Zipcodes sorted by income per tax return
36.63
Fraction of Pings in Home Tract
0.84
42.15
43.34
44.46 0.78
44.94
48.52
0.72
53.97
63.38
67.12 0.66
96.86
304.99
0.0
1.0
3.0
4.0
6.0
8.0
9.0
11.0
13.0
14.0
16.0
18.0
19.0
21.0
23.0
Hour
Panel B: Time of Day Mobility by Fraction African-American
0.89 Activity in each ZIP by % black
0.85
0.76 0.90
0.65
0.49
Fraction of Pings in Home Tract
0.84
Zipcodes sorted by % black
0.44
0.42
0.28 0.78
0.25
0.08
0.72
0.06
0.04
0.03 0.66
0.02
0.01
0.0
1.0
3.0
4.0
6.0
8.0
9.0
11.0
13.0
14.0
16.0
18.0
19.0
21.0
23.0
Hour
19FIGURE VII: Time of Day Activity—Hispanic and Education Share
Panel A: Time of Day by Fraction HIspanic
0.83 Activity in each ZIP by % hispanic
0.76
0.59 0.90
0.48
0.45
Fraction of Pings in Home Tract
Zipcodes sorted by % hispanic
0.84
0.42
0.35
0.33 0.78
0.21
0.16
0.72
0.13
0.11
0.1 0.66
0.09
0.06
0.0
1.0
3.0
4.0
6.0
8.0
9.0
11.0
13.0
14.0
16.0
18.0
19.0
21.0
23.0
Hour
Panel B: Time of Day by Fraction less than College Educated
0.48 Activity in each ZIP by % with no college education
0.47
0.41 0.90
Zipcodes sorted by % with no college education
0.39
0.38
Fraction of Pings in Home Tract
0.84
0.37
0.36
0.34 0.78
0.33
0.31
0.72
0.3
0.27
0.25 0.66
0.19
0.09
0.0
1.0
3.0
4.0
6.0
8.0
9.0
11.0
13.0
14.0
16.0
18.0
19.0
21.0
23.0
Hour
20FIGURE VIII: COVID-19 Cases in NYC by Demographics
Panel A: COVID-19 Cases by ZIP Income
Change in Activity By Tract (Working Hours)
0.2
0.1
0.0
change in activity 0.1
0.2
0.3
0.4
0.5
0.6
9.0 9.5 10.0 10.5 11.0 11.5 12.0 12.5
log(median household income)
Panel B: COVID-19 Cases by ZIP Fraction Black
Change in Activity By Tract (Working Hours)
0.2
0.1
0.0
change in activity
0.1
0.2
0.3
0.4
0.5
0.6
0.0 0.2 0.4 0.6 0.8 1.0
% black
Panel C: COVID-19 Cases by ZIP Fraction Hispanic
Change in Activity By Tract (Working Hours)
0.2
0.1
0.0
change in activity
0.1
0.2
0.3
0.4
0.5
21
0.6
0.0 0.2 0.4 0.6 0.8
% hispanicFIGURE IX: COVID-19 Cases in NYC by Demographics
Panel A: COVID-19 Cases by ZIP Income
Change in Activity By Tract (Non-Working Hours)
0.2
0.0
change in activity
0.2
0.4
0.6
9 10 11 12
log(median household income)
Panel B: COVID-19 Cases by ZIP Fraction Black
Change in Activity By Tract (Non-Working Hours)
0.2
0.0
change in activity
0.2
0.4
0.6
0.0 0.2 0.4 0.6 0.8 1.0
% black
Panel C: COVID-19 Cases by ZIP Fraction Hispanic
Change in Activity By Tract (Non-Working Hours)
0.2
0.0
change in activity
0.2
0.4
0.6 22
0.0 0.2 0.4 0.6 0.8
% hispanicFIGURE X: Residual Effect of ZIP after Controlling for Mobility
Panel A: Residualized COVID-19 Cases by ZIP Income
Cases Per Capita Residuals
0.004
0.002
residual cases per capita
0.000
0.002
0.004
0.006
0.008
0.010
0.012
3.5 4.0 4.5 5.0 5.5
log(median household income)
Panel B: Residualized COVID-19 Cases by ZIP Fraction African-American
Cases Per Capita Residuals
0.004
0.002
residual cases per capita
0.000
0.002
0.004
0.006
0.008
0.010
0.012
0.0 0.2 0.4 0.6 0.8
% black
Panel C: Residualized COVID-19 Cases by ZIP Fraction Hispanic
Cases Per Capita Residuals
0.004
0.002
residual cases per capita
0.000
0.002
0.004
0.006
0.008
0.010
23
0.012
0.1 0.2 0.3 0.4 0.5 0.6 0.7
% hispanicA A PPENDIX
24FIGURE XI: Fraction of COVID-19 Test Results Positive by Demographics
Panel A: Fraction of COVID-19 Test Results Positive, by ZIP Income
Fraction of cases that are positive by income
0.8
0.7
Positive cases per capita
0.6
0.5
0.4
0.3
3.5 4.0 4.5 5.0 5.5 6.0 6.5
Log(income per tax return)
Panel B: Fraction of COVID-19 Test Results Positive, Black
Fraction of cases that are positive by % black
0.8
0.7
Positive cases per capita
0.6
0.5
0.4
0.3
0.0 0.2 0.4 0.6 0.8
Fraction of zipcode that is black
Panel C: Fraction of COVID-19 Test Results Positive, Hispanic
Fraction of cases that are positive by % hispanic
0.8
0.7
Positive cases per capita
0.6
0.5
0.4
0.3
25
0.0 0.2 0.4 0.6
Fraction of zipcode that is hispanicYou can also read