Fuzzy C-Means And Classification-Regression Based Super Resolution for Low Resolution images
←
→
Page content transcription
If your browser does not render page correctly, please read the page content below
IRACST – International Journal of Advanced Computing, Engineering and Application (IJACEA), ISSN: 2319-281X,
                                                                                                            Vol. 2, No. 5, October 2013

                 Fuzzy C-Means And
           Classification-Regression Based
     Super Resolution for Low Resolution images

         Neena Susan Varghese                       A.Neela madheswari                        Suchismita sahoo
    Computer Science Department,            Computer Science Department              Computer Science Department,
  KMEA Engineering college Aluva            KMEA Engineering college Aluva           KMEA Engineering college Aluva
neenasusan90@gmail.com                                                          suchismita.sh@gmail.com

                                                                     helpful for a doctor to make a correct diagnosis. It may be
Abstract— Image super-resolution (SR) reconstruction is the          easy to distinguish an object from similar ones using HR
process of generating an image at a higher spatial resolution by     satellite images, and the performance of pattern recognition in
using one or more low-resolution (LR) inputs from a scene. By        computer vision can be improved if an HR image is provided
super-resolving an LR image, more robust performance can be
achieved in many applications such as computer vision, medical
                                                                     [1].
imaging, video surveillance, and entertainment. Neighbour-
embedding-based (NE) algorithm is an effective method for                The image super-resolution problem arises in a number of
image super-resolution (SR) where the Histograms of oriented         real-world applications. A common application occurs when
gradients (HoG) features of the patched image are extracted in a     we want to increase the resolution of an image while enlarging
raster-scan order from the up scaled version of the LR input by      it using digital imaging software (such as AdobePhotoshop).
using the bicubic (BI) interpolation. Then perform k-means           To shorten the response time of browsing such web pages,
clustering on HoG features to partition the training data set into   images are often shown in low-resolution forms (as the so-
a set of subsets. A sparse neighbor selection (SpNS) algorithm is    called “thumbnail images”). An enlarged, higher resolution
applied to search the neighbors by incorporating the Robust-SL0
algorithm and the K-NN criterion. We developed a sparse
                                                                     image is only shown if the user clicks on the corresponding
neighbor selection (SpNS) algorithm to search the neighbors by       thumbnail. However, this approach still requires the high-
incorporating the Robust-SL0 algorithm and the classification-       resolution image to be stored on the web server and
regression based super-resolution criterion. Also here we            downloaded to the user’s client machine on demand. To save
partition the whole training data into a set of subsets by           storage space and communication bandwidth (hence download
clustering the histograms of oriented gradients (HoG). Here          time), it would be desirable if the low-resolution image is
instead of k-means clustering we are using fuzzy c-means             downloaded and then enlarged on the user’s machine. Yet
clustering for effective clustering. SpNE is applied to synthesize   another application arises in the restoration of old, historic
the HR image patch of the LR input, in which searching               photographs, sometimes known as image inpainting. Besides
neighbors and estimating weights are simultaneously conducted.
After constructing all the HR patches, the total-variation-based
                                                                     reverting deteriorations in the photographs, it is sometimes
(TV) deblurring and the iterative back-projection (IBP)              beneficial to also enlarge them with increased resolution for
algorithm are sequentially performed to obtain the final HR          display purposes [3].
outcome.
                                                                           Sparse neighbor selection (SpNS) algorithm to
                                                                     simultaneously search neighbors and estimate weights by
Keywords—Histograms of oriented gradients (HoG), neighbor
embedding (NE), Sparse representation, K-NN classifier,
                                                                     incorporating the Robust-SL0 algorithm [4], [5] and the k/K-
regression tree based classifier, k-means clusters,c-Means           NN criterion [6] is already implemented, where whole training
clusters, super-resolution(SR).                                      data set is partitioned into a set of subsets by clustering HoG
                                                                     [7], i.e., a powerful descriptor of local geometry
                                                                     representation. Through clustering, a group of medium-scale
                       I.INTRODUCTION                                subsets are constructed, which can effectively reduce
                                                                     computational time while preserving SR quality. Here we are
    In most electronic imaging applications, images with high
                                                                     implementing both K-NN classifier and classification
resolution (HR) are desired and often required. HR means that
                                                                     regression based super resolution trained by k-means clusters
pixel density within an image is high, and therefore an HR
                                                                     and fuzzy c-Means clusters respectively to partition the whole
image can offer more details that may be critical in various
                                                                     training data into a set of subsets.
applications. For example, HR medical images are very

                                                                                                                                   67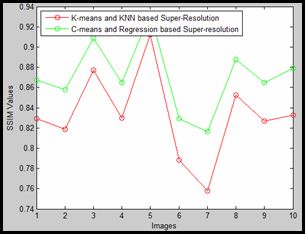
IRACST – International Journal of Advanced Computing, Engineering and Application (IJACEA), ISSN: 2319-281X,
                                                                                                           Vol. 2, No. 5, October 2013

       The reconstruction framework of the proposed method         [12], pattern recognition [13], and compressed sensing [14].
takes place in the following stages: 1) Both the HoG and the       The objective of signal sparse representation is to represent a
first and second-order gradient features are extracted in a        signal as a sparse linear combination with respect to an over
raster-scan order from the upscaled version of the LR input by     complete dictionary. Suppose that the matrix X Є            is an
using the bi-cubic (BI) interpolation 2) subset selection that     over complete dictionary, in which each column vector is a -
the HoG feature of each LR input matches the centroids of          dimensional atom. The number of columns in the matrix X is
clusters is performed to find a medium-scale subset close to       far greater than the number of rows, i.e.,N > d ,which ensures
the LR input for synthesis process. Both K-NN classifier and
classification regression based super resolution trained by k-     that the dictionary is over complete. Given a signal , X Є
means clusters and fuzzy c-Means clusters [8] respectively         its sparse representation can be seen as finding a sparse vector
using here to partition the whole training data into a set of      W =                                 by solving the following
subsets. 3) SpNE is applied to synthesize the HR image patch       optimization problem (1):
of the LR input, in which searching neighbors and estimating
weights are simultaneously conducted; and 4) after
constructing all the HR patches and obtaining the initial HR                   (1)
image, the total-variation-based (TV) deblurring [9] and the
iterative back-projection (IBP) algorithm [10] are sequentially          where            denotes the -norm, which counts the
performed to obtain the final HR outcome.                          number of nonzero elements in a vector. Theoretically, the
                                                                   solution of equation (1) cannot directly be achieved due to the
Here we are comparing K-NN classifier trained by k-means           combinatorial search required. Moreover, since any small
clustering and classification regression based super resolution    amount of noise completely changes the           -norm of the
trained by c-means clustering. The major difference between        solution, this method is prone to errors in noisy settings.
classification regression based super resolution and K-NN          Therefore, alternative approaches have been proposed to
classifier is regression tree is a decision tree based technique   pursue sparse solutions. Under a mild constraint, solving
but KNN works on distance based technique. As regression
tree is decision tree based, the number of comparisons made        subject to                          can approximate the
on the gallery images will be limited but in K-NN the number
                                                                   solution of (1) by LASSO -norm regularization [15], the
of comparisons made on the gallery image cannot be limited.
                                                                   feature sign search algorithm [16], BP algorithm. These
Also fuzzy C-means deals with fuzzy based approach
                                                                   algorithms are typically associated with prohibitive
governed by membership values and objective function but K-
means is governed by random centroid values. Through c-            computational complexity. Considering that             is a
means clustering, a group of medium-scale subsets can be           discontinuous function of, Mohimani et al. [17] proposed to
constructed, which can effectively reduce computational time       solve the minimum solution of -norm by maximizing a
while preserving SR quality and SR quality is improved as its      family of continuous functions as
neighbourhood patch calculation is accurate and stable. This
system is proposed mainly to minimize reconstruction error
while searching the required k- candidates also to establish
optimal subsets. The system will maximize the computational
speed and minimize the computational cost.                         where              can use the Gaussian family of functions to
      This paper is organized as follows: Section II presents
the related work. Section III presents the proposed algorithm      represent, i.e.,         =         satisfying
Section IV describes the system model, section V gives the
experimental results and the section VI concludes the paper.

                 II. RELATED WORK
                                                                            Consequently, the         minimum of               can
      In this section, we will briefly review the robust-SL0       approximate the maximum of              by iteratively decaying
algorithm for sparse which is important to our work.               with gradient descent.
     A.Robust-SL0 for Sparse Representation                              III. PROPOSED ALGORITHM
      In recent years, deriving relevant sparse solutions of              The proposed system develops a sparse neighbor
underdetermined inverse problems has become one of the             selection (SpNS) algorithm to search the neighbors by
most spot lighted research topics in the signal processing         incorporating the Robust-SL0 algorithm[4] and the
community and has successfully been applied in a wide              classification-regression based super-resolution criterion. We
variety of signal processing tasks, e.g., image recovery [11],     partition the whole training data into a set of subsets by

                                                                                                                                  68
IRACST – International Journal of Advanced Computing, Engineering and Application (IJACEA), ISSN: 2319-281X,
Vol. 2, No. 5, October 2013
clustering (Fuzzy C-means Clustering) the histograms of weighted vote on the discrete direction and accumulate these
oriented gradients (HoG), where the previous systems used k- votes into a set of orientation bins within the 3X3 local spatial
NN classifier and k-means clustering instead of the regions called “cells”. Finally, the number of pixels falling
classification-regression based super-resolution criterion and into the same bin is calculated for edge orientation histograms.
fuzzy c-means clustering By linking the edge orientation histograms of each cell in an
LR image patch of size 6X6 and by normalizing the patch to
The system proposes an improved NE-based algorithm the unit -norm, a 144-dimensional HoG feature is
for image SR reconstruction. Here the whole input image is constructed.
decomposed into patches. Then HoG features are extracted
from the up scaled version of the LR input by using the B. Clustering On Hog Using K-Means And C-Means
bicubic(BI) interpolation and perform both k-means clustering Clustering
and c-means clustering on HoG features to partition the
training data set into a set of subsets. At last a sparse In the previous subsection, it is suggested that HoG can
neighbour selection (SpNS) algorithm is applied to search the characterize the local geometry structure of LR image patches
neighbours by incorporating the Robust-SL0 algorithm[4] well.With HoG, we can segment the image patch pairs in the
and the K-NN criterion. For better result we also training data set into a set of subsets. Each subset shares a
implemented classification-regression based super-resolution similar geometric structure. Specifically, all training samples
criterion. comprise a union of such clusters as follows:
A. Patch Separation and Feature Extraction
In order to represent a variety of image patterns,
example- learning-based SR methods often collect a large
number of samples for learning. However, a very large
training data set would lead to a computationally intensive
load. To mitigate the problem, an alternative approach is to where and denote the matrices of the training data set
search the k-NN of a given sample within a subset close to the
input. To achieve the objective, we can use low-level but and by stacking the features of LR and HR
efficient features to characterize the local structure of image image patches in column form C and represents the number
patches and perform clustering on them. In this regard, we use of clusters. Correspondingly, and denote the data
HoG [7], a rather good geometric descriptor that uses the matrices consisting of the features of LR and HR image
distribution of local intensity gradients or edge directions. We
patches in the ith cluster, respectively. In addition, stands
choose HoG rather than other low-level features, such as pixel
intensities, gradient information or a combination of both, for the index set of or . To accomplish clustering,
because pixel intensities exhibit their variance to intensity we make use of a version of the standard K-means clustering
difference between image patches, whereas gradient features algorithm and C-means clustering algorithm.
are sensitive to noise. By contrast, the HoG feature does not
have either problem. The k-means clustering [18] follows a simple
To extract the HoG, a gradient detection operator is first and easy way to classify a given data set through a certain
conducted on the input image in the horizontal and vertical number of clusters (assume k clusters) fixed apriori. It is
directions. Once achieved, the gradients of each pixel can be explained in Algorithm1. The main idea is to define k centers,
one for each cluster. These centers should be placed in a
represented by a vector, where and better way because of different location causes
denote the horizontal and vertical derivatives of the ith pixel different result. So, the better choice is to place them as much
point, respectively. For the gradient direction that falls into the as possible far away from each other. The next step is to take
range of –π/2 –π/2 in the radian form, we can transform it into each point belonging to a given data set and associate it to the
via nearest center. When no point is pending, the first step is
completed and an early group age is done. At this point we
need to re-calculate k new centroids of the clusters resulting
. from the previous step. After we have these k new centroids, a
new binding has to be done between the same data set
Then the discrete directions should be determined. We points and the nearest new center. A loop has been generated.
specify the orientation bins evenly spaced over at As a result of this loop we may notice that the k centers
change their location step by step until no more changes are
intervals of and round the continuous angle of each pixel
done or in other words centers do not move any more [2].
to a discrete value, i.e., downward or upward. We then take a
69IRACST – International Journal of Advanced Computing, Engineering and Application (IJACEA), ISSN: 2319-281X,
Vol. 2, No. 5, October 2013
Finally, this algorithm aims at minimizing an objective
function know as squared error function given by:
where, ‘||xi - vj||’ is the Euclidean distance between xi
and vj.
‘ci’ is the number of data points in ith cluster. where, 'n' is the number of data points.
‘c’ is the number of cluster centers. 'vj' represents the jth cluster center
'm' is the fuzziness index m € [1, ∞]
'c' represents the number of cluster center
Algorithm1 : K-means clustering algorithm 'µij' represents the membership of ith data to jth cluster center.
'dij' represents the Euclidean distance between ith data and jth
Let X = {x1,x2,x3,……..,xn} be the set of data points and cluster center
V = {v1,v2,…….,vc} be the set of centers.
Main objective of fuzzy c-means algorithm is to minimize the
1) Randomly select ‘c’ cluster centers. objective function which is as follows:
2) Calculate the distance between each data point and
cluster centers.
3) Assign the data point to the cluster center whose
distance from the cluster center is minimum of all the
cluster centers.
4) Recalculate the new cluster center using:
where, '||xi – vj||' is the Euclidean distance between ith data
and jth cluster center
Algorithm2: C-means clustering algorithm
Let X = {x1, x2, x3 ..., xn} be the set of data points and V =
{v1, v2, v3 ..., vc} be the set of centers.
where, ‘ci’ represents the number of data points in ith
cluster. 1) Randomly select ‘c’ cluster centers.
2) Calculate the fuzzy membership 'µij' using:
5) Recalculate the distance between each data point and
new obtained cluster centers.
6) If no data point was reassigned then stop, otherwise
repeat from step (3).
The main disadvantages of k-means clustering includes
they are unable to handle noisy data and the algorithm fails for 3) Compute the fuzzy centers 'vj' using:
non-linear data set. Also randomly choosing of the cluster
center cannot lead us to the fruitful result.
The C-means clustering algorithm[20] works by
assigning membership to each data point corresponding to 4) Repeat step (2) and step (3) until the minimum 'J' value is
each cluster center on the basis of distance between the cluster achieved or ||U(k+1) - U(k)|| < β.
center and the data point. It is explained using Algorithm 2. where,
More the data is near to the cluster center more is its
membership towards the particular cluster center. Clearly, ‘k’ is the iteration step.
summation of membership of each data point should be equal ‘β’ is the termination criterion between [0, 1].
to one. After the end of each iteration, membership and cluster ‘U = (µij)n*c’ is the fuzzy membership matrix.
centers are updated according to the formula. ‘J’ is the objective function.
70IRACST – International Journal of Advanced Computing, Engineering and Application (IJACEA), ISSN: 2319-281X,
Vol. 2, No. 5, October 2013
Fuzzy c-means algorithm [20] gives best result for be the iterative times, then the minimum -
overlapped data set and comparatively better then k-means
algorithm. Unlike k-means where data point must exclusively norm solution can be obtained from the pseudoinverse
belong to one cluster center here data point is assigned of X, i.e.,
membership to each cluster center as a result of which data
point may belong to more than one cluster center.
With the constraint condition, we reset
C. Sparse Neighborhood Selection
the jth element in the solution to zero if
The sparse neighbor embedding regression based and keep the rest unchanged. The derivation of
algorithm is explained in Algorithm3. In Section II-B, we give
with respect to is formulated as
a brief review of the Robust-SL0 algorithm, which can be
used for general sparse representation over an over complete
dictionary. Note that the k/K neighborhood selection differs
from the original NE-based algorithm in that there exists an
extra constraint term, i.e., . To solve this,
we can divide the whole index set of into two index sets S
Subsequently, updated via
and , i.e.,
Where is a positive constant that specifies the
We set when and solve
iteration step. Sequentially, is projected onto the
feasible set by
s.t
By using the following equation
After T times iterations have finished, we choose the
indexes of the top k nonzero elements of as the desired
neighbors for linear embedding.
Where is a characteristic function that Algorithm3 : Sparse Neighbor embedding using Regression
selects the weights associated with subset S. To be more based classifier
specific, produces a new vector in which the
indexes corresponding to remain unchanged and sets rest to 1) The input image is partitioned into a sequence of s x
s image patches with two pixels overlapped in raster-
zero. Correspondingly, generates a new scan order and generate the test data set
vector in which the indexes corresponding to remain
unchanged and sets rest to zero.We can divide the
optimization problem .
2) HoG features are extracted from the up scaled
version of the LR input and the corresponding HoG
into two parts as
feature set is
3) The HoG centroid set obtained by
K-means clustering
4) The training data set and
where is a constant taking 0 .We can use a gradient
descent algorithm to obtain the solution vector by 5) For each in , perform the following steps
decaying with a factor of at each iteration. Let iteratively:
71IRACST – International Journal of Advanced Computing, Engineering and Application (IJACEA), ISSN: 2319-281X,
Vol. 2, No. 5, October 2013
(a) Compute the mean values of the jth test Embedding which uses k-means clustering for clustering and
image patch. K-NN classifier for the classification of data. Some standard
images are taken and applied both techniques ,then the mean
(b) Choose the closest subsets and
square error (MSE), Pixel to noise ratio(PSNR), structural
according to
similarity graph(SSIM), feature similarity graph(FISM),
modified structural similarity graph(MSSIM) of the images
are obtained. Here the same images are taken for the
(c) Find the K-NN of by using the Euclidean evaluation of both super resolving techniques. The output of
distance metric within and construct Sparse Neighbour Embedding using k-means clustering and
K-Nn criterion and Adaptive Sparse Neighbour Embedding on
its neighbor set
Classification-Regression based Super-Resolution using FCM
and regression based super resolution are given in the
(d) Given a test sample , calculate figures2(a) and (b) respectively.
according to (11)–(14) with T times iterations.
(e) Select the top k nonzero elements of as the
neighbor set
(f) Normalize whose indexes belong to
according to .
(g) Synthesize corresponding to according
to
Fig. 1: input image
.
(h) Sum up the mean values and to generate
the HR image patch and attach it to .
To obtain a local optimal solution of SR, we employ the
TV-based regularization for image deblurring [19] and use the
IBP algorithm [10] to further enhance the deblurring result by
imposing the global reconstruction constraint that the HR
image should meet the LR input via the degradation process.
III. SYSTEM MODEL
Fig. 2(a): K-Means And K-NN Based Super Resolution (b) FCM And
Here the standard image databases available from [12] are Regression Tree Based Super Resolution
used as samples. For experimental evaluation, MatLab 2008 is
used. Additionally the test images are also taken for
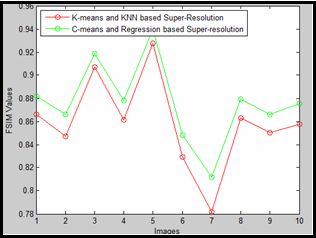
evaluation purpose. The parameters considered for evaluation Table 1 shows the results of K-NN and k-means clustering
are: peak signal-to-noise ratio (PSNR), structural similarity based super resolution and fuzzy c-means and regression tree
(SSIM), Mean square error(MSE) and feature similarity based super resolution. The readings clearly indicate that the
(FSIM) regression tree and fuzzy c-means clustering based method
gives better results for image super resolving when the MSE
and PSNR values are considered as important parameters. It
IV. EXPERIMENTAL RESULTS is the same case for different resolution images. Also it is
clear that the MSE will be decreases while using the proposed
Here we are implementing both K-NN classifier and method and the PSNR will be increased which indicates that
classification regression based super resolution trained by k- the proposed method is much better than the existing method.
means clusters and fuzzy c-Means clusters respectively. The Figure 4 shows the structure similarity and Figure 3 shows the
experimental results show that the fuzzy c-means and along feature similarity graphs of both methods which shows that
with classification regression based super resolution is much the proposed method have much better structure and feature
better than Image Super-Resolution with Sparse Neighbour similarities when compared to the original image.
72IRACST – International Journal of Advanced Computing, Engineering and Application (IJACEA), ISSN: 2319-281X,
Vol. 2, No. 5, October 2013
partition the training data set into a set of subsets, here we are
TABLE 1-Result Of K-Means And K-NN Based Super Resolution And
employing k-means clustering and fuzzy c-means clustering
FCM And Regression Tree Based Super Resolution for the comparison purpose. Second, to surmount the
drawback of the k-NN criterion with Euclidean distance
metric, we develop a novel neighbor selection scheme by
k-menas and knn based c-means and regression
super resolution tree based super
Imag resolution
e
(99x9 Mean Peak Mean Pixel to
9) square signal to square noise
error(MSE) noise ratio error(MSE) ratio
(PSNR) (PSNR)
1 120.80 27.31 88.58 28.65
2 198.85 25.14 148.405 26.41
3 50.34 31.11 38.91 32.229
4 119.18 27.36 106.66 27.85
5 19.87 35.14 15.92 36.10
Image (16x160)
1 121.68 27.27 89.69 28.60
2 201.65 25.084 150.07 26.36
Fig 3- feature similarity graph 3 51.21 31.03 39.32 32.18
4 119.18 27.36 106.66 27.85
5 19.87 35.14 15.92 36.109
introducing a variation of the Robust-SL0 algorithm and
regression tree based super resolution. The experimental
results proves the Adaptive Sparse Neighbor Embedding on
Classification Regression based super-resolution scheme gives
better result when compared to Classification-Regression
Based Super-Resolution for lower resolution image.
ACKNOWLEDGMENTS
The authors would like to acknowledge the contributions
of A. Neela madheswari, Suchismita sahoo.
REFERENCES
[1] S. PARK, M. PARK, AND M. KANG, “SUPER-
RESOLUTION IMAGE RECONSTRUCTION:A TECHNICAL
Fig 4- The structure similarity OVERVIEW,” IEEE SIGNAL PROCESS. MAG., VOL. 20,
NO. 3, PP. 21–36, MAY 2003.
[2] Xinbo Gao, Kaibing Zhang, Dacheng Tao, Xuelong
V.CONCLUSION Li,“Image Super-Resolution With Sparse Neighbor
Embedding” IEEE TRANSACTIONS ON IMAGE
In this paper, we have presented an improved NE-based PROCESSING, VOL. 21, NO. 7, JULY 2012.
algorithm for image SR reconstruction by combining the [3] H. Chang, D.-Y. Yeung, and Y. Xiong, “Super-
sparse neighbor search and subset selection based on HoG resolution through neighbor embedding,” in Proc.
clustering which uses fuzzy c-means clustering and regression IEEE Conf. Comput. Vis. Pattern Recog., Jul. 2004,
tree based classifier. To accelerate the speed of SR pp. 275–282
reconstruction, we first employ clustering on HoG features to
73IRACST – International Journal of Advanced Computing, Engineering and Application (IJACEA), ISSN: 2319-281X,
Vol. 2, No. 5, October 2013
[4] H. Mohimani, M. Babaie-Zadeh, and C. Jutten, “A iteration,” J. Sci. Comput., vol. 37, no. 3, pp. 367–
fast approach for overcomplete sparse decomposition 382, Dec. 2008.
based on smoothed L0 norm,” IEEE Trans. Signal [20] Zhaojie Ju n, HonghaiLiu,” Fuzzy Gaussian Mixture
Process., vol. 57, no. 1, pp. 289–301, Jan. 2009. Models”,Intelligent Systems and Biomedical
[5] A. Eftekhari, M. Babaie-Zadeh, C. Jutten, and H. Robotics Group, School of CreativeTechnologies,
Abrishami Moghaddam, “Robust-SL0 for stable University of Portsmouth, PO12DJ, UK, 19
sparse representation in noisy settings,” in Proc. September 2011.
IEEE Int. Conf. Acoust., Speech, Signal Process.,
Apr. 2009, pp. 3433–3436. AUTHORS PROFILE
[6] A. Eftekhari, H. A.Moghaddam, andM. Babaie-
Zadeh, “ –nearest neighborhood criterion for Neena susan varghese received the B.tech.
improving locally linear embedding,” in Proc. CGIV, degree in computer science from KMEA Engineering
2009, pp. 392–397. college MG University,Ernakulam, and doing the
[7] N. Dalal and B. Triggs, “Histograms of oriented M.Tech degree in computer science from KMEA
gradients for humanvdetection,” in Proc. IEEE Conf. Engineering College,Ernakulam, in 2011 and 2013,
Comput. Vis. Pattern Recognit, Jun.v2005, pp. 886– respectively. Her research interests include image
893 processing, multimedia data compression, and signal
[8] Fathi Gasir, Zuhair Bandar, Keeley Crockett” quantization, and she has published a paper in image
Elgasir: An algorithm for creating Fuzzy Regression processing fields.
Trees”vol 12,pp 234-245,may 2009
[9] P. Getreuer, “Variational imaging methods for
denoising, deconvolution, inpainting, and .
segmentation,”2009.
[Online].Available:http://www.math.ucla.edu/~getre
uer/tvreg.html.
[10] M. Irani and S. Peleg, “Improving resolution by
image registration,” CVGIP: Graph. Models Image
Process., vol. 53, no. 3, pp. 231–239May 1991.
[11] J. Yang, J. Wright, T. Huang, and Y. Ma, “Image
super-resolution via sparse representation,” IEEE.
Trans. Image Process., vol. 19, no. 11, pp. 2861–
2873, Nov. 2010
[12] W. Dong,X. Li, L. Zhang, andG. Shi, “Sparsity-
based image denoising via dictionary learning and
structural clustering,” in Proc. IEEE Conf. Comput.
Vis. Pattern Recognit., Jun. 2011, pp. 457–464.
[13] J. Wright, A. Y. Yang, A. Ganesh, S. S. Sastry, and
Y. Ma, “Robust face recognition via sparse
representation,” IEEE Trans. Pattern Anal. Mach.
Intell., vol. 31, no. 2, pp. 210–227, Feb. 2009.
[14] R. G. Baraniuk, “Compressive sensing,” IEEE Signal
Process. Mag., vol. 24, no. 4, pp. 118–124, Jul. 2007.
[15] R. Tibshirani, “Regression shrinkage and selection
via the lasso,” J. R. Stat. Soc. Ser. B, vol. 58, no. 1,
pp. 267–288, 1996.
[16] H. Lee, A. Battle, R. Raina, and A. Y. Ng, “Efficient
sparse coding algorithms,” Adv. Neural Inf. Process.
Syst., vol. 19, pp. 801–808, 2007.
[17] R. G. Baraniuk, “Compressive sensing,” IEEE Signal
Process. Mag.,vol. 24, no. 4, pp. 118–124, Jul. 2007.
[18] Lloyd, “Least squares quantization in PCM,” IEEE
Trans. Inf.Theory, vol. IT-28, no. 2, pp. 129–137,
Mar. 1982.
[19] A. Marquina and S. J. Osher, “Image super-
resolution by TV-regularization and Bregman
74You can also read