Optimization of Log-Periodic TV Reception Antenna with UHF Mobile Communications Band Rejection - MDPI
←
→
Page content transcription
If your browser does not render page correctly, please read the page content below
electronics
Article
Optimization of Log-Periodic TV Reception Antenna
with UHF Mobile Communications Band Rejection
Keyur K. Mistry 1 , Pavlos I. Lazaridis 2, * , Zaharias D. Zaharis 3 , Ioannis P. Chochliouros 4 ,
Tian Hong Loh 5 , Ioannis P. Gravas 3 and David Cheadle 5
 1    Oxford Space Systems, Harwell OX11 0RL, UK; keyur.mistry@oxford.space
 2    Department of Engineering and Technology, University of Huddersfield, Huddersfield HD1 3DH, UK
 3    Department of Electrical and Computer Engineering, Aristotle University of Thessaloniki,
      54124 Thessaloniki, Greece; zaharis@auth.gr (Z.D.Z.); igravas@auth.gr (I.P.G.)
 4    Hellenic Telecommunications Organization S.A. Member of the Deutsche Telekom Group of Companies,
      15122 Athens, Greece; ichochliouros@oteresearch.gr
 5    5G and Future Communications Technology Group, National Physical Laboratory, Teddington TW11 0LW,
      UK; tian.loh@npl.co.uk (T.H.L.); david.cheadle@npl.co.uk (D.C.)
 *    Correspondence: p.lazaridis@hud.ac.uk

 Received: 19 October 2020; Accepted: 31 October 2020; Published: 3 November 2020

 Abstract: The coexistence of TV broadcasting and mobile services causes interference that leads to
 poor quality-of-service for TV consumers. Solutions usually found in the market involve external
 band-stop filters along with TV reception log-periodic and Yagi-Uda antennas. This paper presents
 a log-periodic antenna design without additional filtering that serves as a lower cost alternative to
 avoid interference from mobile services into the UHF TV. The proposed antenna operates in the
 UHF TV band (470–790 MHz-passband) and rejects the 800 MHz and 900 MHz bands (stopband)
 of 4G/LTE-800 and GSM900 services, respectively. Matching to 50 Ohms is very satisfactory in the
 passband with values of S11 below −12 dB. Furthermore, the antenna is highly directive with a
 realized gain of approximately 8 dBi and a front-to-back ratio greater than 20 dB.

 Keywords: CST simulations; GSM900 band rejection; log-periodic dipole antennas; 4G rejection

1. Introduction
      The adoption of digital modulation and advanced video compression techniques for terrestrial TV
broadcasting, replacing analog broadcasting, resulted in considerable improvements in the efficiency
of frequency spectrum utilization, making it possible to broadcast several TV programs in multiplex in
a single 8 MHz TV channel. This transition set a part of the TV spectrum free for utilization for other
applications, and thus, the wireless communications industry saw this transition as an opportunity to
use the released frequency spectrum for mobile communication services. In turn, that led to European
Member States being urged by the European Parliament to make sure that the frequency spectrum is
efficiently utilized [1]. The European Commission (EC) investigated the allocation of the 790–862 MHz
frequency band (the so-called 800 MHz band and part of the former UHF TV band) to Long Term
Evolution (LTE-800) wireless services as a “digital dividend”, thus redistributing the benefits of digital
TV migration [2]. The EC decision described in [3] suggests a harmonized plan that was adopted
by European states (ITU Region 1) for LTE network deployment in the 800 MHz band. This band is
particularly important for the mobile communications industry because of its relatively low building
material penetration radio losses and the fact that most of the time mobile phones are used indoors.
According to this plan, the spectrum of 790–862 MHz involves the use of chunks of 30 MHz uplink
and 30 MHz downlink transmissions in the FDD (Frequency Division Duplex). Moreover, the uplink

Electronics 2020, 9, 1830; doi:10.3390/electronics9111830                  www.mdpi.com/journal/electronics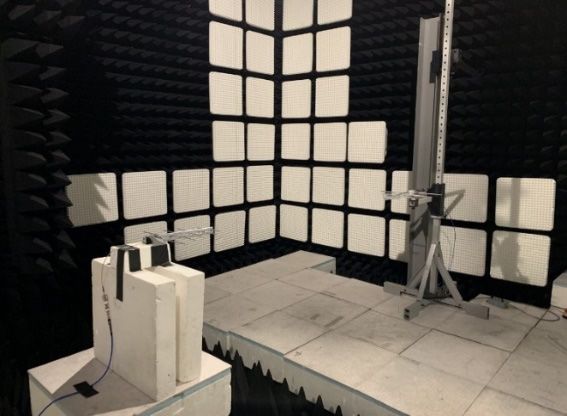
Electronics 2020, 9, x FOR PEER REVIEW                                                                 2 of 12
Electronics 2020, 9, 1830                                                                              2 of 12
11 MHz-wide frequency gap. On the other hand, DTT (Digital Terrestrial Television) is allocated the
470 MHz to 790 MHz band and that just leaves a 1 MHz-wide frequency gap between DTT
spectrum is separated from the downlink spectrum using an 11 MHz-wide frequency gap. On the
broadcasting and LTE-800 mobile communications. A useful study performed in [4] investigates the
other hand, DTT (Digital Terrestrial Television) is allocated the 470 MHz to 790 MHz band and that just
effects of interference on the degradation of the QoS (quality-of-service) in the TV broadcasting band
leaves a 1 MHz-wide frequency gap between DTT broadcasting and LTE-800 mobile communications.
due to its vicinity with the LTE-800 band. Following the clearance of the 800 MHz band, the
A useful study performed in [4] investigates the effects of interference on the degradation of the QoS
requirement of allocating the 700 MHz band (694–790 MHz) was stated in a worldwide resolution
(quality-of-service) in the TV broadcasting band due to its vicinity with the LTE-800 band. Following the
[5], which was later approved in the 2012 World Radiocommunication Conference (WRC-12) of
clearance of the 800 MHz band, the requirement of allocating the 700 MHz band (694–790 MHz) was
ITU-R [6]. Thereafter, the 2015 World Radiocommunication Conference (WRC-15) [7] of ITU-R states
stated in a worldwide resolution [5], which was later approved in the 2012 World Radiocommunication
the provisions used to deploy the 700 MHz band in ITU Region 1. Another significant study is
Conference (WRC-12) of ITU-R [6]. Thereafter, the 2015 World Radiocommunication Conference
presented in [8] and investigates the interference effects due to coexistence of the DTT broadcasting
(WRC-15) [7] of ITU-R states the provisions used to deploy the 700 MHz band in ITU Region 1.
service and LTE service in both the 700 MHz and 800 MHz bands.
Another significant study is presented in [8] and investigates the interference effects due to coexistence
      This paper is an extended version of a paper submitted to the IEEE NEMO-2019 conference [9].
of the DTT broadcasting service and LTE service in both the 700 MHz and 800 MHz bands.
Moreover, the proposed antenna in this paper has been further optimized to achieve higher and
      This paper is an extended version of a paper submitted to the IEEE NEMO-2019 conference [9].
flatter realized gain (RG) along with a higher FBR (front-to-back ratio) throughout the DTT reception
Moreover, the proposed antenna in this paper has been further optimized to achieve higher and flatter
passband.
realized gain (RG) along with a higher FBR (front-to-back ratio) throughout the DTT reception passband.
2. Conventional LPDA Geometry
2. Conventional LPDA Geometry
     LPDAs (Log Periodic Dipole Arrays) or simply log-periodic antennas are frequently used for
     LPDAs (Log Periodic Dipole Arrays) or simply log-periodic antennas are frequently used for
TV reception since the 1960s because of their excellent wideband properties and high directivity
TV reception since the 1960s because of their excellent wideband properties and high directivity
despite the fact that their peak gain is generally lower than that of similar size Yagi-Uda antennas
despite the fact that their peak gain is generally lower than that of similar size Yagi-Uda antennas [10].
[10]. Furthermore, LPDAs provide flat gain throughout their operating band and are thus
Furthermore, LPDAs provide flat gain throughout their operating band and are thus considered as
considered as the best solution for applications where broadband behavior and gain flatness are
the best solution for applications where broadband behavior and gain flatness are important [11,12].
important [11,12]. Compared to Yagi-Uda antennas, which are generally narrowband, LPDAs
Compared to Yagi-Uda antennas, which are generally narrowband, LPDAs provide better gain flatness
provide better gain flatness but a relatively lower RG. The performance of these antennas differs also
but a relatively lower RG. The performance of these antennas differs also because of their different
because of their different feeding pattern [13]. Conventional LPDAs are usually designed using
feeding pattern [13]. Conventional LPDAs are usually designed using calculation guidelines proposed
calculation guidelines proposed by Carrel in [14]. The basic LPDA geometry is shown in Figure 1.
by Carrel in [14]. The basic LPDA geometry is shown in Figure 1.

         Figure 1. Geometry of a conventional LPDA (Log Periodic Dipole Array) proposed by Carrel.
         Figure 1. Geometry of a conventional LPDA (Log Periodic Dipole Array) proposed by Carrel.
       A conventional LPDA is constructed using two booms arranged parallel to each other and
       A conventional
separated   by air usingLPDA    is constructed
                           insulating            using
                                       or metallic      two booms
                                                     fasteners  at thearranged
                                                                       rear end,parallel
                                                                                  as welltoaseach  other end,
                                                                                              the front  and
separated   by  air using insulating  or  metallic fasteners at the rear end, as well as  the front
and sometimes in the middle of the antenna (see Figure 3). The two booms are forming a two-line     end, and
sometimes intransmission
air-dielectric    the middle of   thewhich
                              line,   antenna   (see
                                            feeds  theFigure 3).dipoles.
                                                       antenna    The twoThebooms
                                                                               rear are
                                                                                    endforming
                                                                                         fastener aistwo-line
                                                                                                      usually
air-dielectric transmission line, which feeds the antenna dipoles. The rear end fastener is usually
metallic and acts also as a short-circuit stub. The spacing between the two conducting booms along with
metallic and acts also as a short-circuit stub. The spacing between the two conducting booms along
their cross-section size and shape controls the transmission line characteristic impedance, and therefore,
with their cross-section size and shape controls the transmission line characteristic impedance, and
it is important for matching of the antenna to a feeder cable [15]. In most cases, the antenna is matched
therefore, it is important for matching of the antenna to a feeder cable [15]. In most cases, the antenna
to a feeding cable impedance of 50 Ohms in general or 75 Ohms for TV reception. The dipoles are fixed
is matched to a feeding cable impedance of 50 Ohms in general or 75 Ohms for TV reception. The
to the booms in such a way that the length of the dipoles decreases as we move from the rear end of the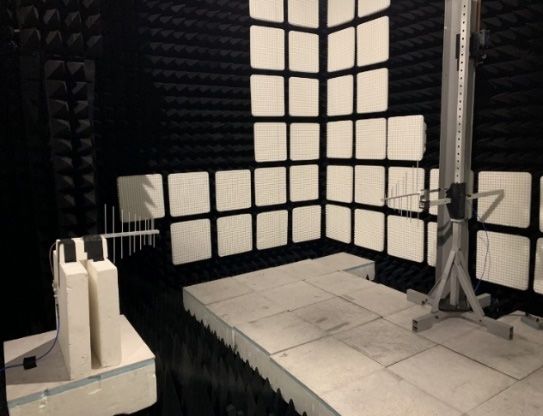
Electronics 2020, 9, 1830                                                                             3 of 12

antenna toward the front end. In addition, half-dipoles are alternatively connected to the upper and
lower booms, and two half-dipoles together form a complete dipole. The phase inversion between the
feeds of the two consecutive dipoles is achieved because of the dipoles being arranged in a criss-cross
fashion. This phase inversion ensures that the antenna always radiates as an end-fire dipole antenna
array [16]. Contrary to Yagi-Uda antennas, where there is only one dipole that is active and all the
other dipoles are passive, all the dipoles in an LPDA are fed by the conducting booms transmission
line, and therefore all the dipoles are active. Depending on dipole length and thickness, each dipole of
the LPDA resonates around a specific frequency. Antenna gain and/or bandwidth significantly increase
with the total number of dipoles used [17]. The feeding is provided at the front end of the booms (left
end of the booms in Figure 3) using a coaxial cable that is usually passing though one of the booms
that are hollow.
      Carrel [14] introduced design equations for the calculation of the dimensions in the case of the
conventional LPDA geometry. The apex angle is the half angle in which all the dipoles are confined,
and it is mathematically expressed as

                                                            1−τ

                                            α = tan−1            .                                       (1)
                                                             4σ

     In the above expression, the parameter τ is called the “scaling factor” and is the ratio of the lengths
or diameters of two consecutive dipoles as shown by the following expression:

                                                 Ln + 1   dn+1
                                            τ=          =                                                (2)
                                                  Ln       dn

where Ln and dn are, respectively, the length and the diameter of the nth dipole. In addition,
the parameter σ shown in (1) is called the “spacing factor” and is defined as:
                                                       sn
                                                 σ=                                                      (3)
                                                      2Ln

where sn is the spacing between the nth dipole and its consecutive (n + 1)th dipole. The overall physical
dimensions of the antenna significantly depend on the above two factors (τ and σ). Sometimes, a fixed
diameter is used for the dipoles in order to simplify the antenna design and reduce costs.

3. Proposed LPDA Geometry
      The proposed LPDA geometry can be used to mitigate the interference caused by the LTE-800 and
GSM-900 mobile communications band transmissions to the TV broadcasting service band. This solution
is actually a UHF TV reception log-periodic antenna composed, in this example, of 10 dipoles that can
act as a filter and reject frequencies in the 800 MHz and 900 MHz bands. One of the already existing
solutions that is most widely used to mitigate interference is the use of a conventional TV reception
antenna along with an external bandstop filter that rejects the undesired 800 MHz and 900 MHz bands.
However, not enough research work has been performed on TV reception antennas without using
external bandstop filters. In [18], an LPDA is proposed that is optimized by a variant of the PSO
(Particle Swarm Optimization) method, i.e., by PSOvm (PSO with velocity mutation). This antenna
design is capable of rejecting signals, which reside in the 800 MHz band and are directed toward
the antenna axis; however, relatively low VSWR values in the 800 MHz band still raise a concern of
receiving interference signals from other directions. In the above-mentioned LPDA design, the first
dipole is longer in length compared to its adjacent dipoles (i.e., 2nd and 3rd dipole) and therefore acts
as reflector for signals that reside in the 800 MHz band.
      An early effort was made in [19] to design an LPDA that rejects the 800 MHz band without using
any external filters and avoids LTE-800 signals from every direction of arrival. As a starting point,
Carrel’s design procedure [14] was used to calculate the antenna dimensions. Then, the shorter dipole
lengths and the distances between these dipoles were optimized using the TRF optimization algorithm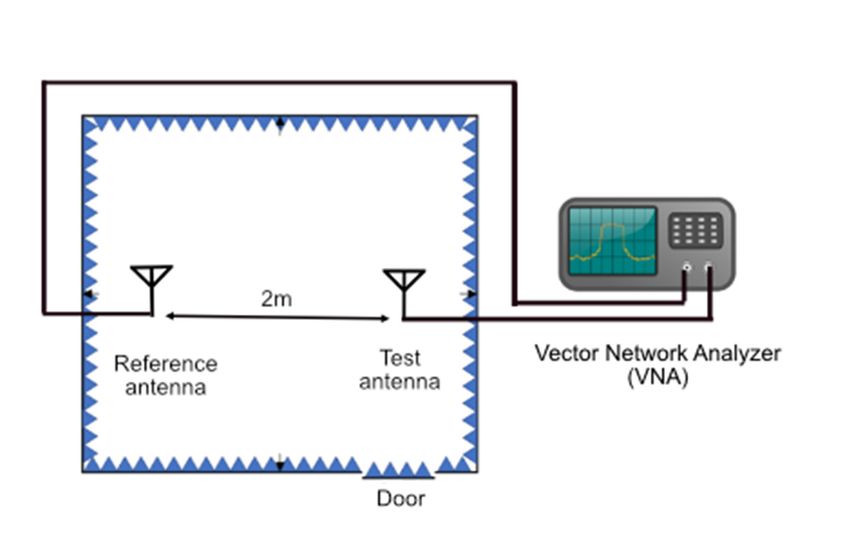
Electronics 2020, 9, 1830                                                                                     4 of 12

in CST (Trusted Region Framework) in order to obtain rejection in the 800 MHz band. This type of
optimization achieves LTE-800 rejection by finding appropriate values for the lengths of some (two or
three) of the shorter dipoles and for the distances between them.
     Extending the LPDA design presented in [19], an improved version of this LPDA [9,20] is proposed
in this paper. Instead of optimizing the whole antenna geometry, which would lead to an increased
computational burden and doubtful convergence, this design is the result of optimizing the lengths of
the front three dipoles only as well as the distances between these dipoles. The rest of the antenna
is identical to the conventional design. In comparison to the conventional LPDA design (Carrel’s
model) and the LPDA design given in [19], the antenna presented in this paper achieves lower values
of S11 (i.e., better matching) as well as higher and flatter RG and FBR throughout the passband, and it
concurrently provides better rejection of the LTE-800 and GSM-900 services. The TRF algorithm,
which is available in the CST environment, is employed to optimize the antenna according to the
goals listed in Table 1. The antenna optimization could also have been carried out using several other
algorithms, such as IWO (Invasive Weed Optimization) in [21–24], PSO in [25,26], and PSOvm in [27].

                                   Table 1. Optimization specifications and goals.

                 Parameter                  Goal             Frequency (MHz)                Weight
                    S11                  10 dBi           470–790 (Passband)                1.0
            Front-to-back ratio           >14 dB            470–790 (Passband)                 0.2
                    S11                   >−1 dB            810–960 (Stopband)                 5.0
              Realized gain              >−10 dBi           810–960 (Stopband)                 1.0

     The reason that only the front three dipoles take part in the optimization is due to the fact that the
front dipoles determine the behavior of an LPDA at higher frequencies. So, the lengths of the first three
dipoles, i.e., L1 , L2 and L3 , and their distances, i.e., s0 , s1 , s2 , and s3 , are the only parameters considered
for optimization. The optimization settings for the TRF algorithm are taking into consideration that
the optimal values of these parameters cannot deviate more than 30% from the respective values of
a conventional LPDA design. Therefore, by multiplying the parameter values of this conventional
design by 0.7 (30% less) or by 1.3 (30% more), we find the parameter boundaries, which are listed in
Table 2. These boundaries are used to restrict the search area of every parameter and thus help the
optimization algorithm converge faster.

                       Table 2. Lower and upper boundaries of the parameters to be optimized.

          Parameter            Initial Values from [18]       Lower Boundary               Upper Boundary
               L1                        138                      96.6 mm                      179.4 mm
               L2                       111.8                     78.26 mm                    145.34 mm
               L3                       126.2                     88.34 mm                    164.06 mm
               s0                         28                       19.6 mm                     36.4 mm
               s1                        15.3                     10.7 mm                      19.9 mm
               s2                        18.6                     13.0 mm                      24.2 mm
               s3                         22                       15.4 mm                     28.6 mm

      Table 1 shows the optimization goals that were used to optimize the LPDA parameters that
are specified in Table 2. This LPDA optimization resulted in a design, where the first four dipoles
are arranged in an unusal pattern compared to the conventional LPDA design. The arrangement of
first four dipoles were such that the 1st (front) dipole is longer than the 2nd dipole. Furthermore,
the length of 2nd dipole is longer than the 3rd dipole, and the length of 4th dipole is longer than the
3rd dipole. The optimized antenna design follows the conventional LPDA design rule after the 4th
dipole, whereafter, the lengths of dipole keep increasing until the last (rear) dipole.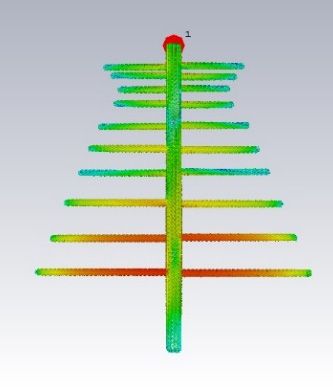
Electronics 2020, 9, x FOR PEER REVIEW 6 of 12
Electronics 2020, 9, x FOR PEER REVIEW 6 of 12
Electronics 2020, 9, 1830 gap 10 11.7 5 5 of 12
Stubgaplength 10
79 11.7
45 455
Stub length 79 45 45
The physicalStub thickness
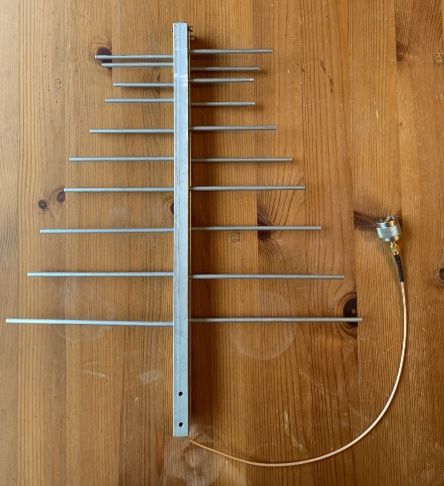
dimensions of the optimized35 LPDA design 35 are 356 mm35× 302.6 mm × 35 mm
Stub thickness 35 35 35
(length × width × thickness). In order to mantain the seperation gap between the two booms,
4. LPDA Simulations and Measurements
a cuboidal fastener is embodied at the rear end of the antenna, which also provides an advantage of
4. LPDA Simulations and Measurements
acting as a short-circuit
Maxwell’s equations stub.
areAdditionally,
often solved this usingfastener
FDTDis(Finite-difference
used to mechanically attach thevariants
time-domain) antenna in to
any Maxwell’s
external equations
support. The are
physicaloften solved
dimensions using
of FDTD
this (Finite-difference
cuboidal
various electromagnetic simulation software packages. CST is one of the many electromagnetic fastener are time-domain)
45 mm × 15 mm variants
× 35 mm in
various×electromagnetic
(length
simulation width × thickness).
software packagessimulation software
that utilizes FDTDpackages. CST isThis
for simulations. one software
of the many offerselectromagnetic
a user-friendly
simulation
Figure
interface that software
2 presents
allows the packages
theuser
top to that
view
modelutilizes
of the FDTD
conventional
fully for simulations.
parametric LPDA ThisasIt
design
CAD models. software
well
has aaswideoffers
the a user-friendly
optimized
range LPDA
of solvers
interface
design.
that canThe that allows
side view
be used the user to
of the LPDAsuch
for simulations modeldesign fully parametric
is shown
as time domain CAD
in Figure models.
3. The
solvers, It has
dimensions
frequency a wide
domain range
of the of solvers
conventional
solvers, and an
that can
LPDA
integral be used
design,
solver. for simulations
theHowever,
antenna design insuch
[19], as
any electromagnetic andtime domain
the proposed
simulation solvers,
antenna frequency
design
requires anare domain
shown in
accurate solvers,
Table 3.and
meshing an
It also
of the
integral
shows
model. the solver.
Another However,ofany
list ofadvantage
parameters CSTelectromagnetic
used for designing
is that thesimulation
it provides CAD
a fast,model requires an accurate
of themeshing
automatic antenna, where
with meshing
mesh of the
Ln refinement
is length of
model.
the Another
nth dipole,
capabilities that advantage
sn adapt
is distance of CST of
between
the quality isthe
that nth
meshing (n + 1)th
it provides
anddepending a fast, automatic
dipole,
on thes0model meshing
is the distance
and useswith mesh the
between
Perfect refinement
start of
Boundary
capabilities
the boom andthat
Approximations adapt
the(PBA) the
[28].quality
first dipole, L-boom
For thisofpaper,
ismeshing
lengththeofdepending
the boom,
Finite on the model
W-boom
Integration is width
Technique andof(FIT)
uses
the Perfect
boom,
included Boundary
H-boom
in CST is
Approximations
height of the boom, (PBA)
and [28].
gap isFor
the this paper,
distance the
between Finite
the Integration
two
was used to simulate the proposed antenna design. The model was hexahedrally meshed using parallel Technique
booms. The (FIT) included
cuboidal in
fastener CST
for
wasantenna
the usedmesh
4,668,482 to
wassimulate
designed
cells, andthe proposed
using
the antenna
the dimensions
simulations were design.
specified
performedThe model
for Stub_length,
with −50 was hexahedrally
dBStub_width,
accuracy. Open andmeshed using
Stub_height
boundary
4,668,482
in Table 3. mesh
conditions An
with acells,
LPDA and
can
reflectionbethe simulations
matched
level were performed
to the desired
of approximately 10−4 werewith
impedance −50
by varying
used dBthe
to model accuracy.
seperation Open
this antenna gapinboundary
between
CST. A
conditions
the
discrete 50 Ω with
two conducting porta that
reflection
booms.
connectslevel
The theof center
initialapproximately
model that was
points of10 −4 were used to model this antenna in CST. A
designed
both the boomsusingatCarrel’s
front enddesign
of theequation
antenna hadis
adiscrete
matching
used 50 Ω
to provide port
thethat
impedance connects
of 75 ohms,
excitation. The the center the
where
antenna points
was booms of both
simulatedwereinthe
10 booms
themm at front
apart.
frequency endfrom
However,
range of the
in450antenna
caseMHz of thetois
usedMHz
proposed
1000 to provide
optimized
with 10 theMHzexcitation.
LPDA, The antenna
the separation
resolution, because gap was simulated
between
the in
ofthe
the booms
frequency frequency
was
interest reduced
involvesrange
from
UHFfrom
10TV,
mm450 toMHz
5 mm
LTE-800, to
1000
in order
and MHz
GSM-900 with
to match 10
bands. MHz
the The
antenna resolution,
to 50 chamber
anechoic because
ohms impedance. the frequency
Thereafter,
at the National of interest
the proposed
Physical involves
Laboratory UHF
antenna
(NPL),was TV, LTE-800,
UK fabricated
was used
and
to testGSM-900
using alluminium
and measure bands. The
components
the anechoic
fabricated at thechamber
LPDAUniversity at the
design. of National
HuddersfieldPhysical Laboratory (NPL),
Manufacturing UK was
laboratory. Figureused 4
to test and measure the fabricated LPDA design.
shows the fabricated model that follows the exact dimensions of the CST-optimized LPDA design.
Figure 2. CAD (Computer-Aided Design) model of Carrel’s conventional model (left) and the
Figure2.2.CAD
Figure
proposed CAD
LPDA
(Computer-Aided
(Computer-Aided
(right)
Design) model of Carrel’s conventional model (left) and the proposed
Design)
shown as a top view. model of Carrel’s conventional model (left) and the
LPDA (right) shown as a top view.
proposed LPDA (right) shown as a top view.
Figure 3.
Figure Side-view of
3. Side-view of the
the CAD
CAD model
model of
of the
the proposed
proposed LPDA
LPDA design.
design.
Figure 3. Side-view of the CAD model of the proposed LPDA design.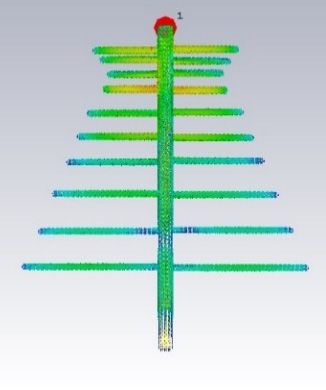
Electronics 2020, 9, 1830 6 of 12
Table 3. Conventional and proposed LPDA dimensions.
Parameter Carrel’s Design Proposed Design in [19] Proposed Design
Variable name Value (mm) Value (mm) Value (mm)
L1 98 138 145.4
L2 110 111.8 128.4
L3 124 126.2 112
L4 140 121.4 121.4
L5 160 157.2 157.2
L6 180 180.2 180.2
L7 206 203.6 203.6
L8 232 235.4 235.4
L9 264 267 267
L10 298 302.6 302.6
L-boom 356 356 356
H-boom 15 15 15
W-boom 15 15 15
Dipole diameter 4 4 4
Stub width 15 15 15
s0 30 28 24.1
s1 16 15.3 11.4
s2 18 18.6 14.9
s3 20 22 17.9
s4 22 25.3 25.3
s5 26 27.3 27.3
s6 28 27 27
s7 34 36.3 36.3
s8 37 40.4 40.4
s9 42 40.6 40.6
gap 10 11.7 5
Stub length 79 45 45
Stub thickness 35 35 35
Electronics 2020, 9, x FOR PEER REVIEW 7 of 12
Figure 4. Fabricated
Fabricated LPDA built using the optimized LPDA dimensions.
4. LPDA
The Simulations
surface currentanddensity
Measurements
of the optimized antenna was simulated in order to obtain the
current distribution at four specific
Maxwell’s equations are often solved frequencyusingpoints:
FDTD (a)(Finite-difference
470 MHz, (b) 630time-domain)
MHz, (c) 790 variants
MHz, and in
(d) 960 MHz as shown in Figure 5. The four frequency points were specifically
various electromagnetic simulation software packages. CST is one of the many electromagnetic selected such that
three of thesoftware
simulation frequency points that
packages lie in the passband
utilizes FDTD for(470–790 MHz),
simulations. Thisand a frequency
software offers point is in the
a user-friendly
stopband/rejection band (810–960 MHz) of the antenna. The surface current density
interface that allows the user to model fully parametric CAD models. It has a wide range of solvers presented in
Figure
that can5 validates thesimulations
be used for fact that each dipole
such resonates
as time domainat asolvers,
specificfrequency
frequency.domain
Figure 5a suggests
solvers, andthat
an
the longest
integral dipole
solver. of the antenna
However, has the highest
any electromagnetic surface requires
simulation current density, as the
an accurate longestofdipole
meshing will
the model.
resonateadvantage
Another at the lowest
of CSTfrequency of bandwidth.
is that it provides However,
a fast, automatic Figurewith
meshing 5b shows a shift in capabilities
mesh refinement maximum
surface current
that adapt density
the quality ofto the 7thdepending
meshing dipole at 630 on MHz, which
the model andis uses
approximately the center
Perfect Boundary frequency of
Approximations
the bandwidth. Figure 5c demonstrates that the maximum current density is at the 2nd and 6th
dipoles of the antenna, thereby stating that both the dipoles resonate at 790 MHz. The reason for this
is the intentionally created anomaly in the antenna design, which results in the energy getting
trapped between these two dipoles, which ultimately leads to high rejection beyond this frequency.
As seen in Figure 5d, at 960 MHz, very minimal current density is seen throughout the antenna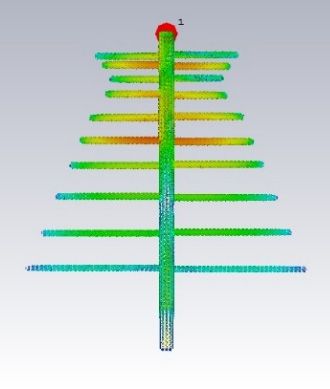
Electronics 2020, 9, x FOR PEER REVIEW 7 of 12
Electronics 2020, 9, 1830 7 of 12
(PBA) [28]. For this paper, the Finite Integration Technique (FIT) included in CST was used to simulate
the proposed antenna design. The model was hexahedrally meshed using 4,668,482 mesh cells, and the
simulations were performed with −50 dB accuracy. Open boundary conditions with a reflection level
of approximately 10−4 were used to model this antenna in CST. A discrete 50 Ω port that connects
the center points of both the booms at front end of the antenna is used to provide the excitation.
The antenna was simulated in the frequency range from 450 MHz to 1000 MHz with 10 MHz resolution,
because the frequency of interest involves UHF TV, LTE-800, and GSM-900 bands. The anechoic
chamber at the National Physical Laboratory (NPL), UK was used to test and measure the fabricated
LPDA design. Figure 4. Fabricated LPDA built using the optimized LPDA dimensions.
The surface current density of the optimized antenna was simulated in order to obtain the current
The surface
distribution current frequency
at four specific density of points:
the optimized antenna
(a) 470 MHz, (b) was simulated
630 MHz, in MHz,
(c) 790 order and
to obtain
(d) 960the
MHz
as current
shown distribution
in Figure 5.atThe fourfour
specific frequency
frequency points:
points (a) specifically
were 470 MHz, (b)selected
630 MHz, such(c) 790
thatMHz,
threeand
of the
(d) 960 MHz
frequency pointsaslieshown
in thein Figure 5.(470–790
passband The fourMHz),
frequency
and apoints were point
frequency specifically selected
is in the such that
stopband/rejection
band (810–960 MHz) of the antenna. The surface current density presented in Figure is
three of the frequency points lie in the passband (470–790 MHz), and a frequency point in the
5 validates
stopband/rejection band (810–960 MHz) of the antenna. The surface current density
the fact that each dipole resonates at a specific frequency. Figure 5a suggests that the longest dipole presented in
of Figure 5 validates
the antenna has the
the fact that each
highest dipole
surface resonates
current at a specific
density, as the frequency.
longest dipoleFigure 5a suggests
will resonatethat
at the
the longest dipole of the antenna has the highest surface current density, as the longest dipole will
lowest frequency of bandwidth. However, Figure 5b shows a shift in maximum surface current
resonate at the lowest frequency of bandwidth. However, Figure 5b shows a shift in maximum
density to the 7th dipole at 630 MHz, which is approximately the center frequency of the bandwidth.
surface current density to the 7th dipole at 630 MHz, which is approximately the center frequency of
Figure 5c demonstrates that the maximum current density is at the 2nd and 6th dipoles of the antenna,
the bandwidth. Figure 5c demonstrates that the maximum current density is at the 2nd and 6th
thereby stating that both the dipoles resonate at 790 MHz. The reason for this is the intentionally
dipoles of the antenna, thereby stating that both the dipoles resonate at 790 MHz. The reason for this
created
is theanomaly in the
intentionally antenna
created design,inwhich
anomaly resultsdesign,
the antenna in the energy gettingintrapped
which results between
the energy these
getting
twotrapped between these two dipoles, which ultimately leads to high rejection beyond this frequency. 5d,
dipoles, which ultimately leads to high rejection beyond this frequency. As seen in Figure
at 960 MHz,invery
As seen minimal
Figure 5d, at current
960 MHz, density
very is seen throughout
minimal the antenna
current density is seen model, which
throughout suggests
the antennathat
none of the
model, dipoles
which of thethat
suggests antenna
none ofresonates at this
the dipoles frequency.
of the antenna resonates at this frequency.
(a) (b) (c) (d)
Figure
Figure Surface
5. 5. Surfacecurrent
currentdensity
densityof
of the
the optimized antennaatat(a)
optimized antenna (a)470
470MHz,
MHz,(b)(b)
630630 MHz,
MHz, (c) 790
(c) 790 MHz,
MHz,
and (d)(d)
and 960 MHz
960 MHz from
fromsimulation.
simulation.
The S11 values of the simulated and the measured LPDA design using Carrel’s design guidelines
The S11 values of the simulated and the measured LPDA design using Carrel’s design
areguidelines
shown in Figure 6. Ininaddition,
are shown Figure 6.the
InS11 values the
addition, of the
S11optimized
values of antenna are alsoantenna
the optimized shown are
in Figure
also 6.
Theshown in Figure 6. The graphs suggest that the S11 values of the optimized antenna are relatively to
graphs suggest that the S11 values of the optimized antenna are relatively lower compared
thelower
Carrel’s modelto
compared inthe
theCarrel’s
passband,
model hence validating
in the passband,the improved
hence S11 the
validating of the optimized
improved antenna.
S11 of the
This also demonstrates excellent antenna matching for the reception in the passband. Furthermore,
in the LTE-800 and GSM-900 mobile service bands (stopband), the S11 values of the optimized antenna
are significantly higher compared to the Carrel’s model. This demonstrates the ability of the optimized
antenna to reject the interference from the stopband from all the directions. This figure also indicates a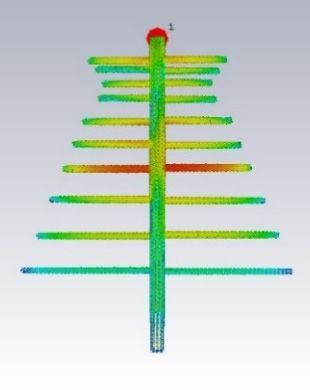
optimized antenna.
Electronics 2020, 9, x FORThis
PEERalso
REVIEWdemonstrates excellent antenna matching for the reception in 8the of 12
passband. Furthermore, in the LTE-800 and GSM-900 mobile service bands (stopband), the S11
optimized
values of theantenna.
optimized Thisantenna
also demonstrates excellent
are significantly antenna
higher matching
compared to theforCarrel’s
the reception
model. in the
This
passband. Furthermore,
demonstrates the ability ofin thethe LTE-800antenna
optimized and GSM-900
to rejectmobile service bands
the interference (stopband),
from the stopbandthe fromS11
allvalues of2020,
the9, optimized
the directions.
Electronics antenna
1830This figure also are significantly
indicates a goodhigher compared
agreement to the
between the Carrel’s
simulated model. This
and 8theof 12
demonstrates the ability of the optimized antenna to reject the interference
measured S11 values of the proposed antenna design. The measured S11 values have been corrected from the stopband from
inall the to
order directions. This figure
take into account somealso
extraindicates
losses inathe
good agreement
fabricated between the simulated and the
antenna.
good agreement
measured S11 valuesbetween the
of the simulated
proposed and thedesign.
antenna measuredThe S11 values S11
measured of the proposed
values have antenna design.
been corrected
The measured S11 values have been corrected in order to
in order to take into account some extra losses in the fabricated antenna.take into account some extra losses in the
fabricated antenna.
Figure 6. S11 plot of Carrel’s conventional LPDA design and the optimized LPDA design of this
paper.
Figure 6. S11 plot of Carrel’s conventional LPDA design and the optimized LPDA design of this paper.
Figure 6. S11 plot of Carrel’s conventional LPDA design and the optimized LPDA design of this
Figure
paper.
Figure 7 7compares
comparesthethesimulated
simulatedandandmeasured
measuredRG RGofofCarrel’s
Carrel’sconventional
conventionalLPDA
LPDAwith withthe
the
simulated
simulated RG RGofof
the
theoptimized
optimized LPDA
LPDA and
and the
themeasured
measured results. The
results. Themeasured
measured RGRGofofthe theproposed
proposed
antenna Figure
has 7 compares
been corrected the
in simulated
order to andinto
take measured
account RG
some ofextra
Carrel’s conventional
losses in the LPDAantenna.
fabricated with the
antenna has been corrected in order to take into account some extra losses in the fabricated antenna.
simulated
This result RG of the
shows that optimized
the LPDAantenna
optimized and theachieves
measured a results. RG
higher Thecompared
measured to RGthat
of the proposed
derived byby
This result shows that the optimized antenna achieves a higher RG compared to that derived
antenna
Carrel’s has
model. been corrected
Furthermore, in order
thethe to take
optimized into
antennaaccount some
demonstrates extra losses
a steep in the
rejectionfabricated
in in
thethe antenna.
stopband,
Carrel’s model. Furthermore, optimized antenna demonstrates a steep rejection stopband,
This result
where the RG shows
drops that
below the
0 optimized
dBi. This antenna
ensures thatachieves
that a higher
antenna RGthe
rejects compared
signals to that
from all derived
the anglesby
where the RG drops below 0 dBi. This ensures that that antenna rejects the signals from all the angles of
Carrel’s
ofarrival model. Furthermore,
arrivalofofradiation.
radiation. The the
measured optimized
realized antenna
gain demonstrates
of the proposed a steep rejection
antenna in
follows the stopband,
closely the
The measured realized gain of the proposed antenna follows closely the simulated
where theRG
simulated RG drops thebelow 0 dBi. This ensuressomethat that antennacanrejects the signals from allmeasured
the angles
RG inside theinside
passband.passband.
However, However,
some difference difference
can be seen betweenbe seen
the between
measuredthe and simulated
of simulated
and arrival of RG radiation.
of the The measured
proposed antennarealized
from gain
700 MHzof the
to proposed
1000 MHz. antenna
The RG follows
drops closely
faster inin the
the
RG of the proposed antenna from 700 MHz to 1000 MHz. The RG drops faster in the stopband the
simulated
stopband in RG
the inside the
measurement passband.
than in However,
the some
simulation. difference can be seen between the measured
measurement than in the simulation.
and simulated RG of the proposed antenna from 700 MHz to 1000 MHz. The RG drops faster in the
stopband in the measurement than in the simulation.
Figure 7. Realized
Figure gain
7. Realized plot
gain of of
plot Carrel’s conventional
Carrel’s LPDA
conventional and
LPDA thethe
and proposed LPDA
proposed of of
LPDA this paper.
this paper.
The simulated
Figure FBR
7. Realized ofplot
gain theof
optimized LPDA is compared
Carrel’s conventional LPDA and with Carrel’sLPDA
the proposed conventional LPDA in
of this paper.
Figure 8. This plot shows that the proposed antenna exhibits highly directive characteristics in the
passband. In contrary to this, Carrel’s model demonstrates a highly directive nature in the passband
as well as stopband, therefore being vulnerable to the interference. Furthermore, in comparison to
Carrel’s model, the optimized antenna also achieves a somewhat improved FBR in the passband.
passband.diagram
schematic       In contrary   to this,
                          of the       Carrel’s
                                 test setup  formodel   demonstrates aishighly
                                                 gain measurements        showndirective  nature
                                                                                  in Figure 9. TheinS12
                                                                                                     the from
                                                                                                          passband
                                                                                                                the
test antenna to the reference antenna was measured using a Vector Network Analyzer (VNA). Then,to
 as  well   as  stopband,    therefore  being  vulnerable  to  the interference. Furthermore,   in  comparison
 Carrel’s
these  datamodel,
              were usedthe optimized
                            along withantenna    also known
                                         the already  achievesgain
                                                                a somewhat
                                                                    values of improved   FBRantenna
                                                                              the reference  in the passband.
                                                                                                      to calculate
        Figure    9 shows   the test setup in an  NPL  anechoic   chamber  for the measurement
the RG of the test antenna. As shown in Figure 10, the reference antenna and the test             of antenna
                                                                                                     realized gain
                                                                                                                are
 and radiation
Electronics
oriented    parallelpatterns
            2020, 9, 1830      of the optimized
                       to the ground   in order toLPDA.   The
                                                    perform     Schwarzbeck
                                                            E-plane            USLP-9143B LPDA was used
                                                                      measurements.                          9 ofas
                                                                                                                  12a
 reference antenna in these measurements. The AUT (Antenna Under Test) was placed 2 m apart
 from the reference antenna, and both the antennas were placed at 1.2 m above the absorbing floor. A
 schematic diagram of the test setup for gain measurements is shown in Figure 9. The S12 from the
 test antenna to the reference antenna was measured using a Vector Network Analyzer (VNA). Then,
 these data were used along with the already known gain values of the reference antenna to calculate
 the RG of the test antenna. As shown in Figure 10, the reference antenna and the test antenna are
 oriented parallel to the ground in order to perform E-plane measurements.

             8. FBR
     Figure 8.
     Figure     FBR(front-to-back
                    (front-to-backratio) plot
                                    ratio)    of Carrel’s
                                           plot           conventional
                                                 of Carrel’s           design
                                                              conventional    and the
                                                                            design andoptimized LPDA design.
                                                                                        the optimized LPDA
     design.
      Figure 9 shows the test setup in an NPL anechoic chamber for the measurement of realized gain
and radiation patterns of the optimized LPDA. The Schwarzbeck USLP-9143B LPDA was used as
a reference antenna in these measurements. The AUT (Antenna Under Test) was placed 2 m apart
from the reference antenna, and both the antennas were placed at 1.2 m above the absorbing floor.
A schematic diagram of the test setup for gain measurements is shown in Figure 9. The S12 from the
test antenna   to FBR
       Figure 8.  the reference   antenna
                       (front-to-back ratio)was
                                             plotmeasured
                                                  of Carrel’susing a Vectordesign
                                                              conventional   Network
                                                                                  and Analyzer   (VNA).
                                                                                       the optimized LPDA Then,
these data  were
       design.     used   along  with the  already  known    gain values of the reference antenna  to calculate
the RG of the test antenna. As shown in Figure 10, the reference antenna and the test antenna are
oriented parallel to the ground in order to perform E-plane measurements.

        Figure 9. A schematic diagram of the test setup for gain measurements in an anechoic chamber.

  Electronics 2020,9.9,A
          Figure       x FOR PEER REVIEW
                         schematic diagram of the test setup for gain measurements in an anechoic chamber.       10 of 12
         Figure 9. A schematic diagram of the test setup for gain measurements in an anechoic chamber.

                            (a)                                                        (b)

     Figure
       Figure    TheThe
             10.10.  testtest
                          setup to measure
                              setup        the radiation
                                     to measure          patterns:patterns:
                                                 the radiation     (a) E-plane
                                                                            (a) and (b) H-plane
                                                                                 E-plane and (b)of H-plane
                                                                                                   the fabricated
                                                                                                             of the
     optimized   LPDA   in an NPL   anechoic chamber.
       fabricated optimized LPDA in an NPL anechoic chamber.

       Figure 11 presents the simulated and the measured E-plane normalized radiation patterns of
  the optimized antenna at (a) 470 MHz, (b) 630 MHz, (c) 790 MHz, and (d) 960 MHz. These plots
  suggest that the simulated radiation patterns and the measured radiation pattern in the E-plane are
  in good agreement. It also validates the highly directional behavior of the antenna in the passband as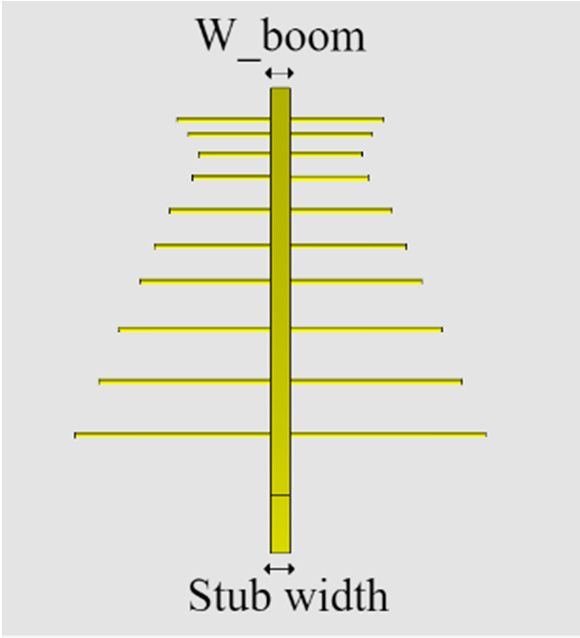
(a) (b)
Figure
Electronics 2020,10. The test setup to measure the radiation patterns: (a) E-plane and (b) H-plane of the
9, 1830 10 of 12
fabricated optimized LPDA in an NPL anechoic chamber.
Figure
Figure1111presents
presentsthe thesimulated
simulatedand andthethe
measured
measured E-plane
E-planenormalized
normalized radiation patterns
radiation of the
patterns of
optimized antenna
the optimized at (a)at
antenna 470(a)MHz, (b) 630(b)
470 MHz, MHz,
630 (c)
MHz,790 (c)
MHz, 790and (d) and
MHz, 960 MHz.
(d) 960These
MHz. plots suggest
These plots
that the simulated
suggest radiationradiation
that the simulated patterns patterns
and the measured radiationradiation
and the measured pattern in the E-plane
pattern in the are in good
E-plane are
agreement. It also validates
in good agreement. the highlythe
It also validates directional behavior of
highly directional the antenna
behavior of theinantenna
the passband as shown in
in the passband as
Figure 11a–c. The directional behavior of the antenna degrades in the stopband as
shown in Figure 11a–c. The directional behavior of the antenna degrades in the stopband as shown shown in Figure 11d
at
in960 MHz.
Figure 11d at 960 MHz.
(a) (b) (c) (d)
Figure 11.
Figure 11. E-plane
E-plane normalized
normalized radiation
radiation patterns
patterns at
at (a) 470 MHz,
(a) 470 MHz, (b)
(b) 630
630 MHz,
MHz, (c)
(c) 790
790 MHz,
MHz, and
and (d)
(d)
960 MHz.
960 MHz.
After
Afterthetheradiation
radiationpattern measurements
pattern measurementson theonE-plane, the radiation
the E-plane, patterns of
the radiation the optimized
patterns of the
LPDA wereLPDA
optimized measured
were at the sameatfrequency
measured the same points on the
frequency H-plane.
points on the The test setup
H-plane. for setup
The test H-plane
for
radiation pattern measurements
H-plane radiation used exactly
pattern measurements usedthe samethe
exactly testsame
setuptest
as setup
the E-plane
as the radiation pattern
E-plane radiation
measurements, where only
pattern measurements, the orientation
where of the test antenna
only the orientation and antenna
of the test the reference
and antenna were changed
the reference antenna
to be perpendicularly
were aligned with respect
changed to be perpendicularly to the
aligned absorbing
with respect floor,
to theasabsorbing
shown in floor,
Figureas10. The simulated
shown in Figure
and the measured
10. The simulatedradiation
and the patters
measuredat four frequency
radiation points
patters are compared
at four frequency in Figure
points 12.compared
are The results
in
show
Figuresatisfactory agreement
12. The results between measurements
show satisfactory and simulations.
agreement between measurements and simulations.
(a) (b) (c) (d)
Figure 12. Normalized radiation patterns on the H-plane at (a) 470 MHz, (b) 630 MHz, (c) 790 MHz,
and (d) 960 MHz.
5. Conclusions
An optimized interference-rejecting 10-dipole LPDA that mitigates interference problems because
of UHF DTT broadcasting co-existence with LTE-800 mobile communications band has been presented.
Compared to conventional LPDAs, the proposed optimized LPDA demonstrates improved performance
in the UHF DTT reception band (passband), which improves the quality-of-service (QoS) of the TV
reception. Another advantage is that the proposed antenna offers high-rejection capabilities in the
LTE-800 band without the use of external bandstop filters, which reduces the final cost of the antenna.
Furthermore, this paper highlights a novel design procedure for LPDAs in order to achieve desired
passband and stopband characteristics by simply optimizing antenna geometry [19]. The proposed
antenna exhibits excellent matching in the passband with low S11 values below −12 dB. Moreover,Electronics 2020, 9, 1830 11 of 12
the antenna achieves a relatively flat gain of approximately 8 dBi in the passband and also demonstrates
a highly directive behavior with a front-to-back ratio of 20 dB. Finally, this paper also presents the S11,
RG, and radiation pattern measurements of the fabricated proposed antenna in an anechoic chamber.
The measured results show good agreement with simulated results.
Author Contributions: Conceptualization, K.K.M. and P.I.L.; methodology, K.K.M., P.I.L., Z.D.Z.; software,
K.K.M.; validation, P.I.L., Z.D.Z. and I.P.G.; formal analysis, K.K.M. and P.I.L.; investigation, K.K.M. and P.I.L.;
resources, P.I.L., T.H.L. and D.C.; data curation, K.K.M., T.H.L. and D.C.; writing—original draft preparation,
K.K.M. and P.I.L.; writing—review and editing, Z.D.Z., I.P.G. and I.P.C.; visualization, K.K.M.; supervision, P.I.L.,
Z.D.Z. and I.P.C.; project administration, P.I.L.; funding acquisition, P.I.L. All authors have read and agreed to the
published version of the manuscript.
Funding: This research was funded by the “European Union’s Horizon 2020 research and innovation programme
under the Marie Skłodowska-Curie”, grant agreement number 861219, and the “European Union’s Horizon 2020
Research and Innovation Staff Exchange programme”, grant agreement number 872857.
Acknowledgments: The work of T. H. Loh and D. Cheadle were supported by The 2017-2020 National Measurement
System Programme of the UK government’s Department for Business, Energy and Industrial Strategy (BEIS),
under Science Theme Reference EMT20 of that Programme.
Conflicts of Interest: The authors declare no conflict of interest.
References
1. EPR 2008/2099 (INI), “Reaping the Full Benefits of the Digital Dividend in Europe: A Common Approach to
the Use of the Spectrum Released by the Digital Switchover,” European Parliament Resolution, September.
2008. Available online: https://op.europa.eu/en/publication-detail/-/publication/cfb2bb65-48a0-48bc-b8d8-
1a5d163f96d6/language-en (accessed on 2 November 2020).
2. EU COM (2009) 586, “Transforming the Digital Dividend into Social Benefits and Economic Growth,” October
2009. Available online: https://www.eesc.europa.eu/en/our-work/opinions-information-reports/opinions/
transforming-digital-dividend-social-benefits-and-economic-growth (accessed on 2 November 2020).
3. Dec. 2010/267/EU “On Harmonised Technical Conditions of Use in the 790–862 MHz Frequency Band for
Terrestrial Systems Capable of Providing Electronic Communications Services in the European Union,”
May 2010. Available online: https://eur-lex.europa.eu/legal-content/EN/ALL/?uri=CELEX%3A32010D0267
(accessed on 2 November 2020).
4. Ferrante, M.; Fusco, G.; Restuccia, E.; Celidonio, M.; Masullo, P.G.; Pulcini, L. Experimental results on the
coexistence of TV broadcasting services with LTE mobile systems in the 800 MHz band. In Proceedings of
the 2014 Euro Med Telco Conference (EMTC), Naples, Italy, 12–15 November 2014; pp. 1–6.
5. WRC Resolution 232 [COM5/10]. Use of the Frequency Band 694–790 MHz by the Mobile, Except Aeronautical
Mobile, Service in Region 1 and Related Studies. Geneva, 2012. Available online: https://www.itu.int/dms_
pub/itu-r/md/15/wrc15/c/R15-WRC15-C-0028!A2!MSW-E.docx (accessed on 2 November 2020).
6. Final Acts-WRC-12; ITU-R: Geneva, Switzerland, 2012.
7. Provisional Final Acts-WRC-15; ITU-R: Geneva, Switzerland, 2015.
8. Fuentes, M.; Garcia-Pardo, C.; Garro, E.; Gomez-Barquero, D.; Cardona, N. Coexistence of digital terrestrial
television and next generation cellular networks in the 700 MHz band. IEEE Wirel. Commun. 2014, 21, 63–69.
[CrossRef]
9. Mistry, K.K.; Lazaridis, P.I.; Loh, T.H.; Zaharis, Z.D.; Glover, I.A.; Liu, B. A novel design of a 10-dipole
log-periodic antenna with LTE-800 and GSM-900 band rejection. In Proceedings of the 2019 IEEE MTT-S
International Conference on Numerical Electromagnetic and Multiphysics Modeling and Optimization
(NEMO), Boston, MA, USA, 29–31 May 2019; pp. 1–4.
10. Zaharis, Z.D.; Skeberis, C.; Xenos, T.D.; Lazaridis, P.I.; Stratakis, D.I. IWO-based synthesis of log-periodic
dipole array. In Proceedings of the 2014 International Conference on Telecommunications and Multimedia
(TEMU), Heraklion, Greece, 28–30 July 2014; pp. 150–154.
11. Balanis, C.A. Antenna Theory: Analysis and Design; Wiley: Hoboken, NJ, USA, 1997.
12. Casula, G.; Maxia, P.; Mazzarella, G.; Montisci, G. Design of a printed log-periodic dipole array for
ultra-wideband applications. Prog. Electromagn. Res. C 2013, 38, 15–26. [CrossRef]
13. Huang, Y.; Boyle, K. Antennas; John Wiley & Sons: New York, NY, USA, 2008.Electronics 2020, 9, 1830 12 of 12
14. Carrel, L. Analysis and Design of the Log-Periodic Dipole Antenna; Technical Report No. 52; University of Illinois:
Champaign, IL, USA, 1961.
15. Song, Q.; Shen, Z.; Lu, J. Log-periodic monopole array with uniform spacing and uniform height. IEEE Trans.
Antennas Propag. 2018, 66, 4687–4694. [CrossRef]
16. Andrea, N. Improvements of Antennas, Particularly Log-Periodic Antennas. Patent EP2549587B1,
24 July 2013.
17. Barbano, N.; Hochman, H. Antenna Boom and Feed Line Structure. Patent US3550144A, 22 December 1970.
18. Zaharis, Z.; Gravas, I.; Lazaridis, P.; Glover, I.; Antonopoulos, C.; Xenos, T. Optimal LTE-protected
LPDA design for DVB-T reception using particle swarm optimization with velocity mutation. IEEE Trans.
Antennas Propag. 2018, 66, 3926–3935. [CrossRef]
19. Mistry, K.K.; Lazaridis, P.I.; Zaharis, Z.D.; Xenos, T.D.; Glover, I.A. Optimization of log-periodic dipole
antenna with LTE band-rejection. In Proceedings of the Loughborough Antennas & Propagation Conference
(LAPC 2017), Loughborough, UK, 13–14 November 2017; pp. 1–5.
20. Lazaridis, P. Log-Periodic Antenna with a Passband and a Stopband. Patent GB2568280A, 15 May 2019.
21. Li, Y.; Yang, F.; OuYang, J.; Zhou, H. Yagi-Uda antenna optimization based on invasive weed optimization
method. Electromagnetics 2011, 31, 571–577. [CrossRef]
22. Mallahzadeh, A.; Oraizi, H.; Davoodi-Rad, Z. Application of the invasive weed optimization technique for
antenna configurations. Prog. Electromagn. Res. 2008, 79, 137–150. [CrossRef]
23. Pal, S.; Basak, A.; Das, S. Linear antenna array synthesis with modified invasive weed optimisation algorithm.
Int. J. Bio-Inspired Comput. 2011, 3, 238. [CrossRef]
24. Sedighy, S.; Mallahzadeh, A.; Soleimani, M.; Rashed-Mohassel, J. Optimization of printed Yagi antenna using
invasive weed optimization (IWO). IEEE Antennas Wirel. Propag. Lett. 2010, 9, 1275–1278. [CrossRef]
25. Pantoja, M.; Bretones, A.; Ruiz, F.; Garcia, S.; Martin, R. Particle-swarm optimization in antenna design:
Optimization of log-periodic dipole arrays. IEEE Antennas Propag. Mag. 2007, 49, 34–47. [CrossRef]
26. Golubovic, R.; Olcan, D. Antenna optimization using particle swarm optimization algorithm. J. Autom.
Control 2006, 16, 21–24. [CrossRef]
27. Zaharis, Z.D.; Gravas, I.P.; Yioultsis, T.V.; Lazaridis, P.I.; Glover, I.A.; Skeberis, C.; Xenos, T.D. Exponential
log-periodic antenna design using improved particle swarm optimization with velocity mutation.
IEEE Trans. Magn. 2017, 53, 1–4. [CrossRef]
28. Mistry, K.K.; Lazaridis, P.I.; Zaharis, Z.D.; Akinsolu, M.O.; Liu, B.; Xenos, T.D.; Glover, I.A.; Prasad, R.
Time and Frequency Domain Simulation, Measurement and Optimization of Log-Periodic Antennas.
Wirel. Pers. Commun. 2019, 107, 771–783. [CrossRef]
Publisher’s Note: MDPI stays neutral with regard to jurisdictional claims in published maps and institutional
affiliations.
© 2020 by the authors. Licensee MDPI, Basel, Switzerland. This article is an open access
article distributed under the terms and conditions of the Creative Commons Attribution
(CC BY) license (http://creativecommons.org/licenses/by/4.0/).You can also read