Processing and Evaluation of Predictions in CASP4 - LCQB
←
→
Page content transcription
If your browser does not render page correctly, please read the page content below
PROTEINS: Structure, Function, and Genetics Suppl 5:13–21 (2001)
                                                                                                         DOI 10.1002/prot.10052

Processing and Evaluation of Predictions in CASP4
Adam Zemla,1 Česlovas Venclovas,1§ John Moult,2 and Krzysztof Fidelis1*
1
  Biology and Biotechnology Research Program, Lawrence Livermore National Laboratory, Livermore, California
2
  Center for Advanced Research in Biotechnology, University of Maryland Biotechnology Institute, Rockville, Maryland

   ABSTRACT      The Livermore Prediction Center                 4. Presentation of results: Organization of the evaluation
conducted the target collection and prediction sub-                 data, including generation of graphical summaries with
mission processes for Critical Assessment of Protein                links to detailed results and generation of an adjustable
Structure Prediction (CASP4) and Critical Assess-                   interface allowing for user-defined comparison of re-
ment of Fully Automated Structure Prediction Meth-                  sults.
ods (CAFASP2). We have also evaluated all the
submitted predictions using criteria and methods                    In the area of results analysis, probably the most
developed during the course of three previous CASP               significant development since CASP3 was an increase in
experiments and preparation for CASP4. We present                the need for overview-type presentations. With an almost
an overview of the implemented system. Particular                threefold increase in the total number of submitted predic-
attention is paid to newly developed evaluation                  tions, from approximately 3,800 in CASP3 to ⬎11,000 in
techniques and data presentation schemes. With the               CASP4, it became practically impossible to analyze the
rapid increase in CASP participation and in the                  results without the aid of summaries, which provide an
number of submitted predictions, special emphasis                uppermost organizational layer and a guide to any further
is placed on methods allowing reliable pre-classifica-           comparisons. In this spirit, we have developed a number of
tion of submissions and on techniques useful in                  graphic comparison tools designed to capture at least the
automated evaluation of predictions. We also                     overall quality of any given prediction. Beginning with
present an overview of our website, including                    these overviews, more detailed presentations of the results
target structures, predictions, and their evalua-                follow as a second layer and are accessible from the first
tions (http://predictioncenter.llnl.gov). Proteins               through multiple HTML links.
2001;Suppl 5:13–21. © 2002 Wiley-Liss, Inc.                         The second significant development concerns the struc-
                                                                 ture superposition method working in the sequence-
Key words: protein structure prediction; evalua-                 independent mode. Until CASP3, we have used outside
           tion methods; CASP4                                   techniques,1,2 recognizing the value of their track record in
                                                                 the community. However, with the large increase in the
                     INTRODUCTION                                number of predictions submitted to CASP, it became
                                                                 prohibitively difficult to rely on methods that are not
   An outline of the Critical Assessment of Protein Struc-       available locally. To remedy the situation, we have ex-
ture Prediction (CASP) infrastructure implemented at the         tended the GDT software3 to include the local– global
Livermore Prediction Center is presented. The main pur-          alignment package (LGA).4 When tested on CASP3 data,
pose is to provide an overview of the steps involved in          on average, LGA produced slightly larger superimposed
automated assessment of predictions, beginning with for-         sets of atoms than the previously used methods when
mat verification and ending with numerical and graphic           applying the same cutoff values. LGA was the major
presentation of the results. Many elements of this process       superposition engine for all CASP4 results generated at
carry over from previous CASPs, and thus we concentrate          the Livermore Center.
on the new developments, presenting a summary of the
rest. The main tasks addressed at the Livermore Predic-                      SUBMISSION OF PREDICTIONS
tion Center are as follows:
                                                                   All CASP4 and CAFASP2 predictions were received at
                                                                 the Livermore Prediction Center. Both high volume and
1. Prediction targets: Target solicitation and collection        the requirements of subsequent numerical evaluation
   from crystallographers and nuclear magnetic reso-
   nance (NMR) spectroscopists, including verification of
   sequence data and oversight of the target coordinate            Grant sponsor: NIH; Grant number: LM07085-1; Grant sponsor:
                                                                 DOE; Grant number: DE-FG02-96ER 62271.
   release status.                                                 §
                                                                     Joint affiliation with Institute of Biotechnology, Graičiūno 8, 2028
2. Submission of predictions: Format verification, submis-       Vilnius, Lithuania
   sion updates, and verification of compliance with spe-          *Correspondence to: Krzysztof Fidelis, Biology and Biotechnology
   cific target deadlines.                                       Research Program, Lawrence Livermore National Laboratory, Liver-
3. Evaluation of predictions: (a) carrying out the neces-        more, CA 94551. E-mail: fidelis@llnl.gov
   sary calculations; and (b) development of evaluation            Received 19 July 2001; Accepted 29 October 2001
   methods.                                                        Published online 28 January 2002

©   2002 WILEY-LISS, INC.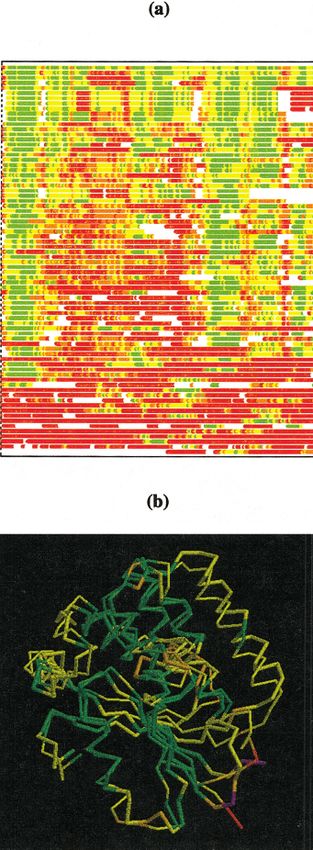
14 A. ZEMLA ET AL.
Fig. 1. Organization of the prediction submission process and preparation of target data.
placed high demands on format consistency and proper ii. AL (alignment): predictions submitted in the form
content of submissions. An automatic verification engine of sequence alignments to publicly available struc-
was used to ensure high standards of accepted data. The tures
verification module was based on a standard UNIX send- iii. SS (secondary structure): assignments of secondary
mail utility, with the addition of Perl scripts to organize structure to target protein sequences
the flow of data, and programs written in C to handle the iv. RR (residue–residue contacts): predictions submit-
verification. Any submission format errors were quickly ted in the form of C–C distances
diagnosed and suggestions on how to amend them mailed 6. Up to five models were accepted from each prediction
back to predictors. Submissions were governed by the group on any given target; primary attention was paid
following set of rules: to only one of the models (designated by the predicting
group as model index 1).
1. All predictions were accepted electronically. 7. Submission of a duplicate model (same target, group,
2. Each submission was automatically tested by the for- model index) replaced a previously accepted model,
mat verification server. provided it was received before target’s prediction dead-
3. Models conforming to format and submission deadlines line.
were assigned an accession code.
4. A unique accession code was composed of the following
Figure 1 shows a schematic of the submission process,
elements:
including target coordinates and homology data prepara-
i. Prediction target ID
tion.
ii. Format category designator
iii. Predictor group number ORGANIZATION OF THE EVALUATION SYSTEM
iv. Model index (a number assigned by predictors to
rank their submissions 1–5) In CASP, evaluation is performed by comparison with
5. The following formats were used: experimental structures, which for each target protein
i. TS (tertiary structure): predictions submitted in the define the “standard of truth.” The Livermore Prediction
form of atomic coordinates (three-dimensional [3D] Center coordinated the information for each of the predic-
models) tion targets (i.e., sequence, source, advancement of struc-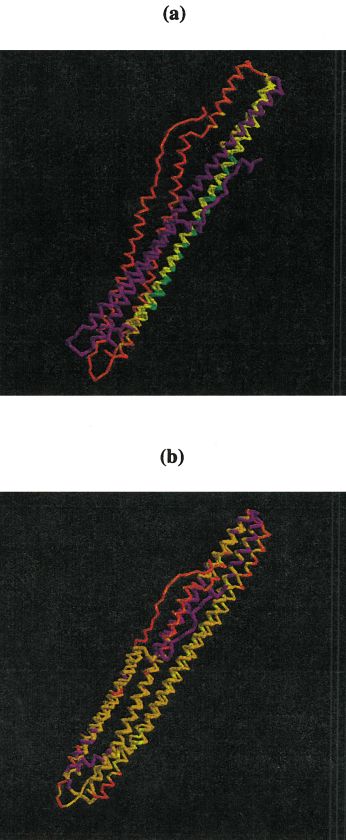
PREDICTIONS IN CASP4                                                      15

                                       Fig. 2.   Organization of the prediction evaluation system.

ture solution). These data were made available to predic-              Further division of the prediction targets into evaluation
tors via a web interface.                                              categories was addressed by the CASP4 independent
  As soon as the experimental structures were released,                assessors and is more broadly discussed in two articles
we collected information on their structural homologues                included in this issue.6,7 Residue–residue contact predic-
available at the time. With approximately 50 new struc-                tions were not evaluated at the Livermore Prediction
tures deposited to the Protein Data Bank (PDB) every                   Center. Hubbard’s evaluation of these results is available
week, it was important to capture the release status of                at http://predict.sanger.ac.uk/casp4/. After the end of the
these homology-related data at closing of the prediction               CASP4 prediction season, all the submitted models, coordi-
time window for each of the targets. Homologous struc-                 nates of the corresponding target structures, and data on
tures were also needed in the subsequent evaluation of                 relevant related proteins were assembled as the evalua-
submitted models. In comparative modeling, one or more                 tion input files. Index tables containing model, target,
of the closely related parent structures (modeling tem-                prediction type, and parent structure identification labels,
plates) were identified for this purpose. In fold recognition,         as well as the PDB accession codes, were used for quick
more extensive lists of target-related structures were                 reference by the evaluation program package (ACE), and
compiled, together with the corresponding levels of struc-             by the data presentation engines (Fig. 2). Access to more
tural similarity they shared with target proteins. In both             than 14,000 3D models and 2,000 other predictions and
cases, we have used the ProSup structure similarity                    their evaluation data is provided through our website.
search procedure as provided by Sippl’s group.2,5 In com-
parative modeling, final selection of the principal parent                           EVALUATION OF 3D MODELS
structure involved further careful examination of the                     In our presentation of CASP results, we have used both
similarity between parent and target structures, using the             sequence-dependent and sequence-independent methods
LGA method.4                                                           of comparing model with target. The sequence-dependent
  Predictions were evaluated as (1) general 3D models                  mode optimizes superposition of the two structures under
submitted in either the TS or AL formats and typically                 the assumption of strict 1:1 correspondence between their
generated by methods in the ab initio (new fold) or fold               residues. The sequence-independent mode forgoes that
recognition categories; (2) high-quality 3D models (de-                restriction. In cases in which the fold is correctly identi-
noted CM) typically generated by comparative modeling;                 fied, but the target sequence alignment with the template
and (3) assignments of secondary structure (denoted SS).               structure is poor, the sequence-independent method will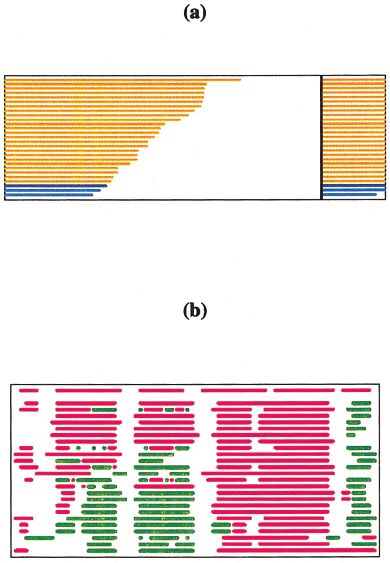
16                                                             A. ZEMLA ET AL.

  Fig. 3. Overall prediction quality graph for all models submitted on
CASP4 target T0124 derived from multiple rigid body sequence-
dependent superpositions of model and target structures. Each line
corresponds to one predicted structure and shows percentages of the
model fitting under the corresponding C␣–C␣ distance cutoffs. Models
submitted by one particular prediction group (383) are shown in blue
(model 1) and cyan (other models).

allow detection of the incorrectly aligned regions in a
two-step process: (1) a best possible superposition between
model and target is obtained, and (2) errors in the relative
sequence alignment are calculated on the basis of that
superposition. This section describes the types of results
calculated for the 3D model predictions.

Sequence-Dependent Method
Overall Prediction Quality Graphs (GDT)
   The global distance test (GDT) summary graphs provide
an approximate sorting of predictions by quality and a
good starting point for further analysis (Fig. 3). Conceptu-
ally they are a variation of the root-mean-square deviation
(RMSD)/coverage plots first introduced by Hubbard8 but
use distance rather than RMSD cutoffs. These plots con-
sist of points identifying subsets of structure that can be
fitted under a specified distance cutoff. In general, the
more horizontal the curve corresponding to a particular
model, the better the prediction. In the HTML presenta-
tion, clicking on a line identifies specific prediction along
with other predictions submitted by the same group (blue
and cyan, respectively). At this point, additional links
provide a comparison of secondary structure assignments
in the target and model, and the longest continuous
                                                                            Fig. 4. Comparison of sequence-dependent superpositions obtained
segment (LCS) analysis. These plots identify precisely the
                                                                         between predicted (group 383, model 1) and target structures of T0124. a:
LCS in the model structure that do not deviate from the                  Superposition calculated with a lower cutoff (4.0 Å) identifies correct
target by more than a specified C␣ RMSD. As in the LCS                   prediction of only one helix. b: For the same prediction, superposition
plots, results of the GDT analysis may also be displayed for             calculated with a higher cutoff (8.0 Å) identifies the overall structure
                                                                         similarity. In both a and b, residues deviating by ⬍2, 4, and 8 Å are shown
specific models, with local prediction quality plotted as a              in green, yellow, and orange, respectively. Segments of model and target
function of position in the sequence. With this type of GDT              not superimposed are shown in red and violet, respectively.
plot, similarity between predicted and experimental struc-
tures may be assessed over regions that are not necessarily
continuous in sequence. Both specialized techniques were                 Links to numerical data on the quality of predictions are
described previously,3 and thus we do not provide specific               also provided. In particular, the GDT_TS (total scores)
graphical examples here. Viewing of the 3D models and of                 measure provides a reasonable single-value approxima-
the corresponding experimental structures is made avail-                 tion of the tertiary structure prediction quality. The
able via the RASMOL graphic package, written by Sayle.9                  GDT_TS is defined as an average of four separate GDT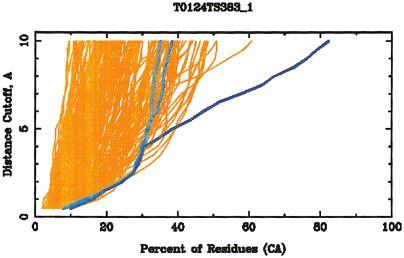
PREDICTIONS IN CASP4 17
calculations identifying maximal sets of residues at 1, 2, 4,
and 8 Å distance cutoffs.
The GDT summary assessment shown in Figure 3
highlights the risk of using single cutoff values in generat-
ing overall summaries. Specifically, the kink in the blue
line represents a transition between a family of structural
superpositions identified as optimal for distance cutoff
values of approximately ⬍4 Å, and another family compat-
ible with cutoffs of ⬎4 Å. In the first case, only a single
helix is identified as structurally aligned with the target,
while in the second case, similarity extends essentially
over the entire structure [Fig. 4 (a) and (b), respectively].
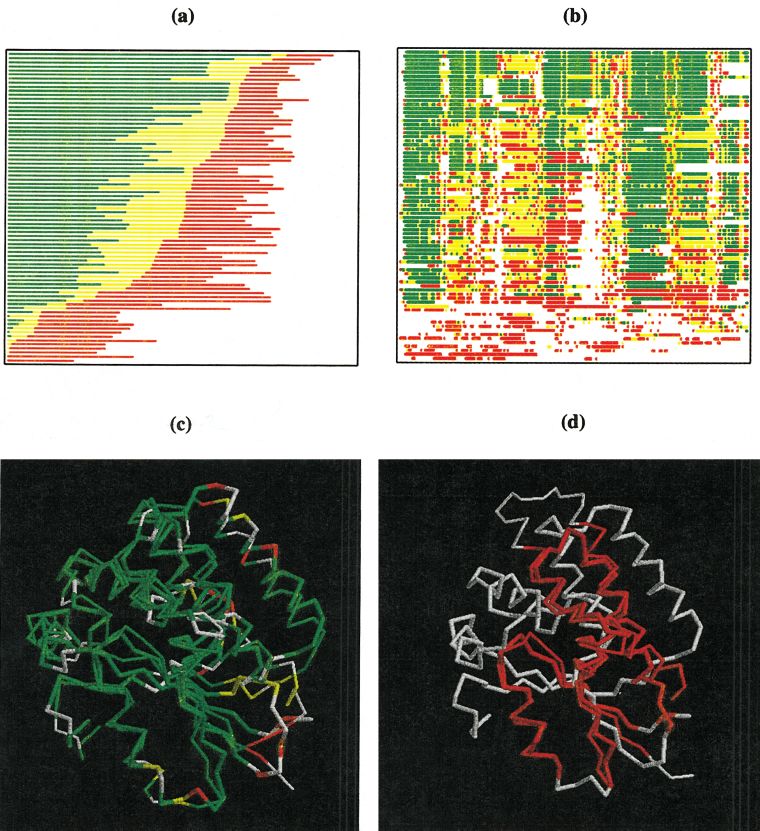
C␣–C␣ Deviation Stripcharts
Another means of quickly comparing all predictions on a
given target are the C␣–C␣ deviation strip charts. This
specific representation is generated based on the best
model-target rigid body superposition identified during
the course of the GDT analysis using a 4-Å distance cutoff.
With the caveat of the risk involved with using superposi-
tions obtained under single cutoff values, discussed in the
previous section, this approach helps identify specific
regions in a prediction that are correctly modeled [Fig.
5(a)]. In the HTML presentation, each stripe provides a
link to a RASMOL rendering of the 3D superposition of
model and target structures [Fig. 5(b)].
Sequence-Independent Method
Sequence-dependent superposition methods are unable
to identify regions of structural similarity in a prediction
that are not correctly aligned by sequence. Sequence-
independent methods will identify such regions and pro-
vide a direct measure of alignment accuracy. The LGA
algorithm4 is now used for all such evaluations at the
Livermore Prediction Center.
We have implemented a calculation of the overall align-
ment quality [Fig. 6(a)], which also permits sorting by
either exact or more relaxed criteria of alignment correct-
ness (sorting allowing ⫾4 residue shift is shown). The
corresponding strip chart [Fig. 6(b)] shows regions of a
model that are correctly aligned. Serving as top-level
overviews, these two graphs also provide HTML links to
3D representations of superimposed target and model
structures [Fig. 6(c) and (d)].
The example shown in Figure 6(d) demonstrates how an
essentially correct prediction of structure, although com-
pletely misaligned in sequence, is still identified by the
sequence-independent superposition. Identification of this
similarity is not possible in the sequence-dependent regime.
Outline of Previously Developed Evaluation
Methods Fig. 5. a: C␣–C␣ deviation strip chart for all predictions on CASP4
target T0117 derived from a single rigid-body sequence-dependent
Evaluation criteria have been designed to address differ- superposition of model and target structures. Each stripe corresponds to a
single prediction shown as a function of sequence. Residues superim-
ent aspects of prediction, features that are particularly posed within 2, 4, and 8 Å are shown in green, yellow, and orange,
difficult to model, and characteristics relevant to protein respectively. Residues with C␣–C␣ deviation of ⬎8 Å are shown in red,
function. They were also designed to single out elements of and those not predicted in white. b: RASMOL rendering of the model
protein structure and to eliminate the effect of possible (thin) and target structures (group 31, model 1, first stripe of the chart in a).
The color scheme is the same as in the strip chart for both model and
experimental uncertainties. Additional criteria assess spe- target, except for target residues that do not superimpose with model
cific stages in the process of prediction, success of the (violet).18 A. ZEMLA ET AL.
Fig. 6. a: Overall alignment quality bar graph for all predictions on CASP4 target T0117 derived from a single rigid-body sequence-independent
superposition of model and target structures. Residues with correct sequence alignment (%) are shown in green and those aligned within ⫾4 residues in
yellow. Residues superimposed structurally, but not aligned by sequence, are shown in red and the remainder, including those not predicted in white. b:
Alignment quality strip chart for predictions shown in a: alignment quality plotted as function of position in sequence. Color scheme as in a. c: RASMOL
rendering of the best model (thin) submitted on this target (group 31, model 1, first stripe of the chart in b). Colors correspond to the strip chart
representation. d: RASMOL rendering of a model capturing fold similarity but failing to align residues correctly by sequence (group 186, model 1, stripe
second from the bottom in b). Colors correspond to the strip chart representation.
refinement techniques, and accuracy of the model reliabil- dent on structural superposition, and between dihedral
ity estimates. A more extensive overview is provided in angles, independent of superposition. For coordinates,
refs. 3, 10, and 11. results are calculated for all atomic positions or subsets,
including C␣, main-chain, and side-chain atoms. RMSDs
Basic Measures over dihedral angles are calculated separately for / and
The RMSD between model and target is used to measure for angles. Completeness of a prediction determines how
differences between atomic coordinates, with results depen- many atomic positions or dihedral angles could be includedPREDICTIONS IN CASP4 19
in the evaluation, and these numbers are provided for each
submission. The following subsets of structure are used in
the general assessment of 3D models: (1) residues of the
secondary structure elements; (2) amino acids that are on
the surface of a protein and those that are buried; and (3)
residues not affected by possible experimental uncer-
tainty, such as disorder or crystal contacts.
Additional Measures for High-Quality Models
To evaluate comparative modeling predictions, addi-
tional criteria have been developed. In the design consider-
ations, particular attention was paid to the parts of the
target structure that differ from any of the homologues, to
the correct selection of the parent structure, and relevance
to protein function. The resulting additional subsets in-
clude (1) angles that have a different rotameric assign-
ment in target and parent structures; (2) chain segments
that have moved significantly relative to the parent struc-
ture; (3) segments of the target structure for which selec-
tion of a parent other than the one closest by sequence is
preferred; (4) “core” and “loop” segments; and (5) regions of
structure that are in direct contact with ligand molecules.
RMSD Details of Loops
Loops as difficult to predict regions of structure were
defined based on global (i.e., LGA) superposition of target
and parent structures. Corresponding residues with C␣
distances greater than cutoff (2.5 Å) were assigned to loop
segments. If fewer than three residues exist between such
segments, they are merged together. To address modeling
performance specifically on individual loops, Cartesian
RMSDs in both global and local superposition are calcu- Fig. 7. Evaluation of secondary structure predictions for CASP4 target
lated on C␣, main-chain, and all atoms for each loop that T0102. a: Bar graph showing prediction success in terms of the SOV
measure13 (%, left side of the graph) and fraction of predicted residues
contains at least three residues. (%, at right). The same type of rendering is used for the Q3 results. b: Strip
chart of predicted secondary structure assignments. First stripe from the
Evaluation of Model Refinement and Confidence top represents secondary structure assignment in the target structure, the
Assessments remaining ones in all model 1 predictions. Color scheme: purple, helix;
green, strand; white, coil; black, residues not predicted. This plot shows
To evaluate the success of the refinement procedures, that only a few groups were able to predict the second and third helices
such as energy minimization or molecular dynamics, paral- correctly.
lel submissions of unrefined and refined models were
accepted and fully assessed. Estimates of position-specific
reliability of submitted models were assessed as previ- comprehensive access to prediction targets, original predic-
ously.3 tions, and evaluation results. The site also allows access to
the visualization tools described above. Data for all four
EVALUATION OF SECONDARY STRUCTURE CASP prediction experiments are available. The website
PREDICTIONS provides three main modes of access to evaluation data:
For the evaluation of secondary structure predictions,
we have used a similar overview approach as in the case of 1. Summary graphics organized by prediction target, allow-
3D models. Bar graphs showing success rates and percent- ing quick comparisons of all predictions submitted on a
age of predicted structure permit rapid comparison of all given target structure, with four types of graphs avail-
predictions submitted on a given target [Fig. 7(a)]. Each able:
evaluated prediction links to a strip diagram comparing a. Alignment accuracy plots (sequence-independent
predicted and target structure secondary structure assign- analysis of 3D models)
ments. Strip charts comparing all predicted assignments b. GDT plots (sequence-dependent analysis of 3D mod-
on a given target are also available [Fig. 7(b)]. els)
c. Target-model C␣–C␣ deviation summary plots (se-
ORGANIZATION OF THE WEBSITE
quence-dependent analysis of 3D models)
The http://predictioncenter.llnl.gov website provides gen- d. Sov and Q3 (secondary structure prediction evalua-
eral information about the prediction experiment and tion results)20 A. ZEMLA ET AL.
2. Interactive browsers, with user-defined comparison cal evaluations of the model–target structure similarity,
tables with links to graphic representations allowing implemented by Sippl’s group5; RMS/coverage graphs,
for the selection of introduced by Hubbard8; and the methods developed by
a. Prediction experiment (CASP1, 2, 3, or 4) the Livermore Prediction Center. A subset are the represen-
b. Category of data tations of prediction quality as a function of position along
i. 3D models (ab initio/new fold and fold recogni- the sequence. While still permitting visualization of all
tion) predictions on a given target with a single glance, they also
ii. Extended evaluation for comparative modeling permit comparison of prediction success in different re-
iii. Evaluation of secondary structure predictions gions of the model. Even if only approximate, these
c. Target proteins methods permit selection of models for further, more
d. Prediction groups complete, assessment.
e. Evaluation criteria Several issues remain, including automated classifica-
f. Subsets of structure tion of protein architecture. An interesting example was
provided in CASP4 by a model containing unlikely “knots”
Generated results tables then provide links to graphic (prediction T0103TS218_1), a feature not easily detected
tools as follows: by present numerical assessments. These rare topologic
a. Summary plots of GDT analysis of all models for features have recently been studied more broadly,12 includ-
selected target ing the development of an algorithm to detect them
b. Plots of largest superpositions between predicted automatically. A discussion of this issue will undoubtedly
and target structures (detailed GDT analysis of each be part of preparations for CASP5.
prediction) Nevertheless, most of the evaluation methods are now
c. Plots of LCS for each prediction stable. There are two principal tasks ahead. The first task
d. Šali plots is full automation of evaluation, such that a prediction on
e. RASMOL plots of predicted and target structures in any structure can be submitted at any time, and the
ii. C␣ sequence-dependent superposition results generated and returned without human interven-
iii. GDT sequence-dependent superposition (only C␣ tion. This system will allow the methods to be used in the
atom pairs closer than 4.0 Å are used to obtain broader set of evaluation scenarios that are now emerging.
the superposition) The second task is the development of a system for
iv. LGA sequence-independent superposition classifying prediction methods. Such a system would pro-
f. RASMOL plots of superimposed target and parent vide cataloging of the existing techniques and remain open
structures (for comparative modeling targets) for the introduction of new ones. It would also provide a
g. Comparisons of residue-by-residue secondary struc- hierarchical organization to identify variations of the
ture assignments between predicted and target struc- applied methodologies. For example, for a particular com-
tures. parative modeling approach, it would specify what class of
alignment algorithm was used. Over time, by providing a
To simplify navigation through evaluation results from track record for all classified modeling methods, such a
interactive browsers, a default set of measures and subsets system will facilitate the development of techniques of
of structure are also provided to generate the comparison assigning accuracy estimates to models obtained in real-
tables. life applications.
ACKNOWLEDGMENTS
3. Links to results generated by other evaluation meth-
ods: This work was performed under the auspices of the U.S.
a. CASP4 fold recognition independent assessment (Sip- Department of Energy by the University of California,
pl’s assessment of fold recognition) Lawrence Livermore National Laboratory under contract
b. Evaluation of models submitted for CAFASP2 experi- W-7405-Eng-48. This work was also supported by NIH
ment (results of the CAFASP assessment of fully grant LM07085-01 (to K.F.) and DOE grant DE-FG02-
automated predictions). 96ER 62271 (to J.M.).
DISCUSSION REFERENCES
At the first CASP experiment in 1994, evaluation of a 1. Holm L, Sander C. Protein structure comparison by alignment of
distance matrices. J Mol Biol 1993;233:123–138.
total of approximately 100 predictions presented a consid- 2. Feng ZK, Sippl MJ. Optimum superimposition of protein struc-
erable assessment task. By CASP4, the number of submit- tures: ambiguities and implications. Fold Des 1996;1:123–132.
ted predictions increased more than 100-fold. The key 3. Zemla A, Venclovas Č, Moult J, Fidelis K. Processing and analysis
of CASP3 protein structure predictions. Proteins 1999;Suppl
elements allowing keeping up with this rapid increase 3:22–29.
were consistent, electronically readable formats, highly 4. Zemla A. LGA program: a method for finding 3-D similarities in
developed evaluation criteria, and considerable automa- protein structures. 2000; accessed at http://predictioncenter.llnl.
tion of the evaluation process. With the large number of gov/local/lga/.
5. Lackner P, Koppensteiner WA, Domingues FS, Sippl MJ. Auto-
predictions, classification by prediction quality became mated large scale evaluation of protein structure predictions.
indispensable. In CASP, these techniques include numeri- Proteins 1999;Suppl 3:7–14.PREDICTIONS IN CASP4 21 6. Tramontano A, Laplae R, Morea V. Analysis and assessment of 10. Venclovas Č, Zemla A, Fidelis K, Moult J. Criteria for evaluating comparative modeling prediction in CASP4. Proteins 2001; Suppl protein structures derived from comparative modeling. Proteins 5:22–38. 1997;Suppl 1:7–13. 7. Sippl MJ, Domingues FS, Prlic A, Malik R, Andreeva A, Wieder- 11. Zemla A, Venclovas Č, Reinhardt A, Fidelis K, Hubbard TJ. stein M. Assessment of the CASP4 fold recognition category, Numerical criteria for the evaluation of ab initio predictions of Proteins 2001; Suppl 5:55– 67. protein structure. Proteins 1997;Suppl 1:140 –150. 8. Hubbard TJ. RMS/coverage graphs: a qualitative method for 12. Taylor WR. A deeply knotted protein structure and how it might comparing three-dimensional protein structure predictions. Pro- fold. Nature 2000;406:916 –919. teins 1999;Suppl 3:15–21. 13. Zemla A, Venclovas Č, Fidelis K, Rost B. A modified definition of 9. Sayle RA, Milner-White EJ. RASMOL: biomolecular graphics for Sov, a segment-based measure for protein secondary structure all. Trends Biochem Sci 1995;20:374 –376. prediction assessment. Proteins 1999;34:220 –223.
You can also read