Fatigue Behaviour of Textile Reinforced Cementitious Composites and Their Application in Sandwich Elements - MDPI
←
→
Page content transcription
If your browser does not render page correctly, please read the page content below
applied
           sciences
Article
Fatigue Behaviour of Textile Reinforced Cementitious
Composites and Their Application in
Sandwich Elements
Matthias De Munck 1, * , Tine Tysmans 1 , Jan Wastiels 1 , Panagiotis Kapsalis 1 ,
Jolien Vervloet 1 , Michael El Kadi 1 and Olivier Remy 2
 1   Department Mechanics of Materials and Constructions, Vrije Universiteit Brussel (VUB), Pleinlaan 2,
     1050 Brussels, Belgium; Tine.Tysmans@vub.be (T.T.); Jan.Wastiels@vub.be (J.W.);
     Panagiotis.Kapsalis@vub.be (P.K.); Jolien.Vervloet@vub.be (J.V.); Michael.El.Kadi@vub.be (M.E.K.)
 2   CRH Structural Concrete Belgium nv, Marnixdreef 5, 2500 Lier, Belgium; O.Remy@plakagroup.be
 *   Correspondence: Matthias.De.Munck@vub.be; Tel.: +32-(0)2-629-2927

 Received: 19 February 2019; Accepted: 26 March 2019; Published: 28 March 2019

 Abstract: Using large lightweight insulating sandwich panels with cement composite faces offers
 great possibilities for the renovation of existing dwellings. During their lifetime, these panels are
 subjected to wind loading, which is equivalent to a repeated loading. To guarantee the structural
 performance of these panels during their entire lifetime, it is necessary to quantify the impact of
 these loading conditions on the long term. The fatigue behaviour was, therefore, examined in this
 paper both at the material level of the faces and at the element level as well. plain textile reinforced
 cementitious composite (TRC) specimens were subjected to 100,000 loading cycles by means of a
 uniaxial tensile test, while sandwich beams were loaded 100.000 times with a four-point bending
 test. Results show that the residual behaviour is strongly dependent on the occurrence of cracks.
 The formation of cracks leads to a reduction of the initial stiffness. The ultimate strength is only
 affected in a minor way by the preloading history.

 Keywords: textile reinforced cementitious composites (TRC), sandwich elements; fatigue; uniaxial
 tensile tests; four-point bending tests; digital image correlation (DIC)

1. Introduction
      The energy and thermal insulation regulations for both new buildings and renovations become
stricter year after year, leading directly to a growing demand for low-energy insulating building
solutions. Particularly for renovation, the installation time on site needs to be reduced to the minimum
to limit the inconvenience for the current residents. In this context, large lightweight prefabricated
sandwich panels offer great possibilities. Renovating and insulating existing dwellings by placing
panels with the dimensions of one story facilitates the installation process and reduces the total
renovation time to a couple of days.
      Nowadays sandwich panels are already widely spread in construction. They are characterized
by a large stiffness to weight ratio thanks to the composite action between the two stiff faces and the
insulating core. Different materials can be used, both for the core as for the skins [1]. Steel, wood,
concrete, etc., have been used as facing material. Precast concrete sandwich panels are commonly used
for walls of (industrial) buildings. Typically, these panels consist of steel reinforced concrete faces
with a thickness of 60 mm or more, which ensure the load-bearing capacity. The total weight of such
panels can be substantially reduced by omitting the non-structural concrete, i.e., the concrete cover
necessary to protect the steel rebars against corrosion. This can be achieved by using technical textiles
as an alternative reinforcement to steel. Since these textiles are not sensitive to corrosion, no concrete

Appl. Sci. 2019, 9, 1293; doi:10.3390/app9071293                                 www.mdpi.com/journal/applsci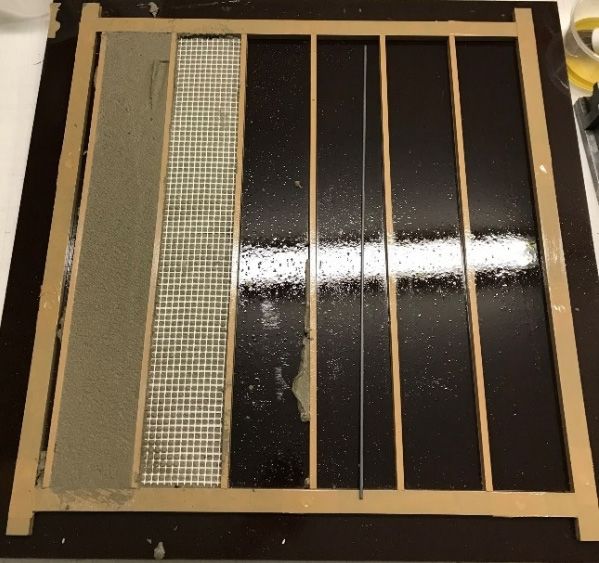
Appl. Sci. 2019, 9, 1293 2 of 19
cover is needed, and lightweight sandwich panels with skins of only a few millimeter’s thickness can
Appl. Sci. 2018, 8, x FOR PEER REVIEW
be achieved. The combination of a cementitious matrix with a textile reinforcement has been2 widely of 19
investigated for different kinds of applications: reinforcing and/or strengthening of concrete and
thickness can be achieved. The combination of a cementitious matrix with a textile reinforcement has
masonry structures [2–5], construction of pedestrian bridges [6], and as skins for the fabrication of
been widely investigated for different kinds of applications: reinforcing and/or strengthening of
sandwich panels. In addition to an experimental characterization of the bending behaviour of TRC
concrete and masonry structures [2–5], construction of pedestrian bridges [6], and as skins for the
sandwich panels [7–10], various work has been done on the analytical [11,12] and numerical [13–15]
fabrication of sandwich panels. In addition to an experimental characterization of the bending
modelling of this behavior.
behaviour of TRC sandwich panels [7–10], various work has been done on the analytical [11, 12] and
Textile reinforced cementitious composite (TRC) is characterized by a linear behavior in
numerical [13–15] modelling of this behavior.
compression and a non-linear behavior in tension. This non-linear tensile behavior was observed in
Textile reinforced cementitious composite (TRC) is characterized by a linear behavior in
various experiments [16–20]. Parallel to this experimental campaign, different models were elaborated
compression and a non-linear behavior in tension. This non-linear tensile behavior was observed in
to predict the structural behavior of TRC [21–24]. Generally, the tensile behavior of the composite
various experiments [16–20]. Parallel to this experimental campaign, different models were
can be divided into three different stages (Figure 1). During the first linear stage, fibers and matrix
elaborated to predict the structural behavior of TRC [21–24]. Generally, the tensile behavior of the
are working together, and the modulus is given by the law of mixtures. For composites with a low
composite can be divided into three different stages (Error! Reference source not found.). During the
fiber volume fraction, the modulus of the matrix is determining for the resulting initial modulus E1.
first linear stage, fibers and matrix are working together, and the modulus is given by the law of
Cracks start forming in the matrix when the ultimate tensile stress of the matrix is exceeded, resulting
mixtures. For composites with a low fiber volume fraction, the modulus of the matrix is determining
in a reduction of the modulus. Once a crack is formed, the load is redistributed. This process of the
for the resulting initial modulus E1. Cracks start forming in the matrix when the ultimate tensile stress
formation of cracks and subsequently redistribution of the load is called the multiple cracking stage
of the matrix is exceeded, resulting in a reduction of the modulus. Once a crack is formed, the load is
and repeats itself until the matrix is fully saturated with cracks. The third and last stage is called the
redistributed. This process of the formation of cracks and subsequently redistribution of the load is
post-cracking stage. In this linear stage, the additional load is only carried by the fibers. The tangential
called the multiple cracking stage and repeats itself until the matrix is fully saturated with cracks.
modulus of the composite E3 is determined by the modulus of the fibers and the fiber volume fraction.
The third and last stage is called the post-cracking stage. In this linear stage, the additional load is
Finally, failure of the composite material is induced by tensile rupture of the textile at a strain largely
only carried by the fibers. The tangential modulus of the composite E3 is determined by the
exceeding the tensile failure strain of the matrix.
modulus
Figure
Figure 1. Characteristic
1. Characteristic tensile
tensile behavior
behavior of textile
of textile reinforced
reinforced cementitious
cementitious composite
composite (TRC).
(TRC).
Applied
Applied in in sandwich
sandwich panels,
panels, thethe
TRCTRC faces
faces areare subjected
subjected to to different
different loading
loading conditions.
conditions. OneOneof of
the determining loading conditions is wind loading, comparable to a repeated loading. The influence of
the determining loading conditions is wind loading, comparable to a repeated loading. The influence
of TRC
TRC sandwich
sandwich panels
panelssubjected
subjectedto toaarepeated
repeatedloading
loadinghas hasbeen
beenstudied
studiedlittle
littlebefore.
before.Cuypers
Cuypers etet
al.al.
[25]
cyclically
[25] loaded
cyclically loaded sandwich
sandwich panels with
panels E-glass
with E-glassfiber reinforced
fiber cementitious
reinforced cementitious faces up up
faces to 2/3rd
to 2/3rdof their
of
ultimate load. The panels were subjected to ten loading cycles and subsequently
their ultimate load. The panels were subjected to ten loading cycles and subsequently loaded up loaded up to failure.
to
During
failure. the repeated
During loading
the repeated an accumulation
loading of the residual
an accumulation deformation
of the residual was observed.
deformation Literature
was observed.
data on the fatigue behavior of TRC itself are limited. Hegger [6] and
Literature data on the fatigue behavior of TRC itself are limited. Hegger [6] and Mesticou [26] Mesticou [26] performed
cyclic loading
performed cyclic tests
loadingon TRC coupons,
tests on but the number
TRC coupons, of loading
but the number cycles was
of loading cycleslimited. Remy Remy
was limited. [27] and
Cuypers
[27] [28] studied
and Cuypers the behavior
[28] studied of TRCofspecimens,
the behavior combining
TRC specimens, an inorganic
combining phosphate
an inorganic cement
phosphate
with E-glass fibers. The specimens were subjected up to 10 7 cycles for different maximum cyclic
cement with E-glass fibers. The specimens were subjected up to 107 cycles for different maximum
loads.
cyclic By assessing
loads. By assessingthe evolving modulus,
the evolving it was
modulus, it concluded that the
was concluded thataccumulation
the accumulationof damage was not
of damage
stabilized 7
after 10after
cycles. In all the
was not stabilized 107 cycles. In above-mentioned
all the above-mentionedresearch, samplessamples
research, were loadedwere and unloaded
loaded and
unloaded using a uniaxial tensile test up to a load at which the multiple cracking fully took place. An
evaluation of the fatigue behavior of TRC at low load levels, i.e., below the matrix cracking stress is
lacking in the literature.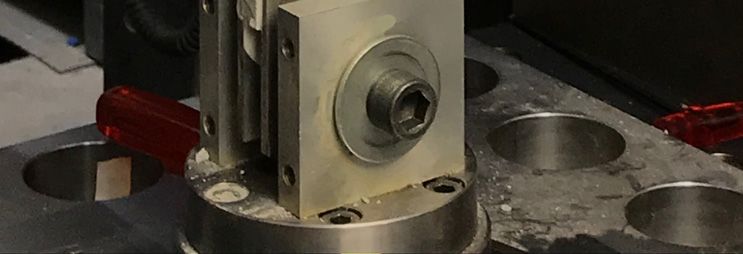
Appl. Sci. 2019, 9, 1293                                                                            3 of 19

using a uniaxial tensile test up to a load at which the multiple cracking fully took place. An evaluation
of the fatigue behavior of TRC at low load levels, i.e., below the matrix cracking stress is lacking in
the literature.
      Applied as thin faces in a sandwich panel loaded in bending, TRC will subjected to (nearly)
uniform tension or compression and to loading cycles at relatively low stress levels originating from
the characteristic wind loadings. The investigation of repeated loading conditions at the lower stress
range is crucial and differs from the work done in literature. The formation of cracks at lower stress
levels needs to be evaluated. This occurrence of cracks is directly linked to the ingress of aggressive
substances and, thus, to durability measures of the façade panels. In addition, the modulus of
TRC in the cracked state is significantly reduced. This lowered modulus has a direct impact on the
displacements of the panels. A proper comprehension of the tensile fatigue behavior of TRC is, thus,
indispensable to evaluate the long-term behavior of the resulting sandwich panels, and this already at
low stress levels to account for the serviceability limit state.
      This paper describes an extensive experimental study on 27 TRC coupons and 13 sandwich
beams with TRC faces. Nine coupons were tested statically to identify the reference tensile behavior.
The other 18 samples were divided into three different series. Each series was subjected to 100,000
tensile loading–unloading cycles up to a different predefined stress level, based on the expected loading
conditions in serviceability limit state: 0.5 MPa, 1.0 Mpa, and 2.0 MPa. Afterwards, a static tensile
test was performed to quantify the residual behavior. From the 13 sandwich beams, five sandwich
beams were used as reference beams and loaded up to failure. The eight other beams, divided into
two series, were subjected to 100,000 loading–unloading cycles and subsequently loaded up to failure.
The maximum cycle load of the first series was equivalent to an elastic tensile stress of 1.0 MPa in the
TRC skin, for the second series this was equivalent to an elastic tensile stress of 2.0 MPa. For both
the coupons and the sandwich beams, an extensive analysis was performed on the hysteresis curves
of the repeated loading tests and on the residual static behavior. In addition to a comparison of the
structural behavior, the cracking behavior was also investigated in detail. Conclusions were drawn on
the evolution of the parameters of the hysteresis curves and on the degradation of the static behavior.

2. Materials and Methods

2.1. Material Characteristics
     To allow a clear comparison between the investigations on the component and the element level,
the same materials were used for the coupons and the sandwich faces. For the TRC coupons, a premix
mortar was reinforced with multiple layers of alkali-resistant (AR) glass fiber textiles. For the sandwich
beams, an expanded polystyrene (EPS) core was covered with the same textile, embedded in the
premix mortar. The material properties of both the EPS and the TRC constituents (mortar and textile)
are described below.

2.1.1. Mortar
     A commercially available Portland cement-based shrinkage-compensated mortar was chosen as
the matrix of the TRC. Its maximum grain size was 0.5 mm, and a water to binder mass ratio of 0.15
was considered. Six flexural and twelve compression tests were performed according to the European
Standards [29], to characterize the flexural strength fct,f and compressive strength fcc (Table 1).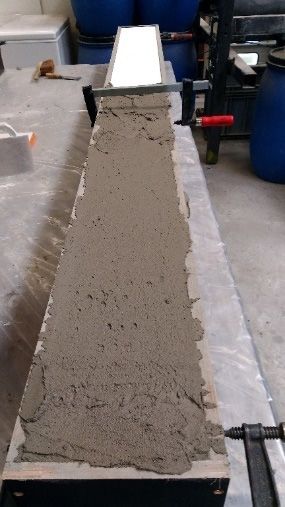
Appl. Sci. 2019, 9, 1293 4 of 19
Appl. Sci. 2018, 8, x FOR PEER REVIEW 4 of 19
Table 1. Mechanical properties of the used mortar.
Table 1. Mechanical properties of the used mortar.
fct,f fcc
MPa MPa fct,f fcc
Average 6.35 23.17MPa MPa
Standard Deviation 0.45 1.59
Average 6.35 23.17
Standard Deviation 0.45 1.59
2.1.2. Textile Reinforcement
2.1.2.
A Textiletextile
technical Reinforcement
made of AR glass rovings is embedded in the mortar. The textile is polymer
coated and woven into an
A technical textileorthogonal
made of ARmesh.
glassThe textileishas
rovings a nominal
embedded in tensile strength
the mortar. Theof 2500 is
textile N polymer
per
50 mm, a total surface weight of 200 g/m 2 (165 g/m2 glass fibers), and a mesh opening of 5 mm in
coated and woven into an orthogonal mesh. The textile has a nominal tensile strength of 2500 N per
both 50
directions [30] (Figure
mm, a total surface2).
weight of 200 g/m2 (165 g/m2 glass fibers), and a mesh opening of 5 mm in
both
Figure 2. An alkali-resistant (AR) glass textile with a mesh size of 6 mm used.
Figure 2. An alkali-resistant (AR) glass textile with a mesh size of 6 mm used.
2.1.3. Expanded Polystyrene
2.1.3. Expanded Polystyrene
For the fabrication of the sandwich beams, expanded polystyrene (EPS) was chosen as a rigid
insulatingFor the EPS
core. fabrication
is not of
thethe sandwich
most beams,
performant expanded
thermal polystyrene
insulating (EPS)but
material, wasthis
chosen as a rigid
is largely
insulating
compensated bycore. EPS
its low costisand
notlow
thedensity
most performant 3
(15–20 kg/mthermal insulating
). Both cost material,
and density butparameters
are key this is largely
compensated
for the by its low The
considered application. costproperties
and low ofdensity (15–
the used EPSצ20200
kg/m³). Both
are listed in cost
Tableand
2. density are key
parameters for the considered application. The properties of the used EPS 200 are listed in Table 2.
Table 2. Properties expanded polystyrene (EPS) 200 [31].
Table 2. Properties expanded polystyrene (EPS) 200 [31].
Density E-Modulus Bending Strength
kg/m3
Density MPa
E-Modulus kPaBending strength
kg/m3 20 MPa
10 250 kPa
20 10 250
2.2. Specimen Preparation
2.2. Specimen Preparation
The experiments on the material level were carried out on prismatic TRC coupons, with a nominal
Themm,
length of 500 experiments
a nominalon the ofmaterial
width 75 mm, level
and a were
nominal carried out on
thickness of 10prismatic
mm. All TRC coupons,
specimens had anwith a
nominal
identical length
build-up, of 500 mm,
reinforced withatwo nominal
layers width of equally
of textile 75 mm,distributed
and a nominal thickness
over the height of 10 mm.
(Figure 3). All
To dospecimens hadmade
so, they were an identical build-up,
separately using areinforced
hand lay-up with two layers
technique; theofmortar
textile was
equally
cast distributed
three times.over
Afterthe height (Figure
spreading out the3). To layer
first do so,ofthey wereamade
mortar, separatelyfiber
reinforcement usingneta was
handplaced
lay-upand
technique; the mortar
impregnated
in thewas cast three
mortar times.
(Figure After spreading
4). Subsequently, out thelayer
a second first layer of mortar,
of mortar a reinforcement
and second fiber net
reinforcement gridwas
wereplaced
and impregnated in the mortar (Figure 4). Subsequently, a second layer
placed. Once the third layer of mortar was cast, a plastic sheet was used to seal the mold and to of mortar and second
reinforcement
prevent grid were placed.
premature evaporation of the O nce the
water. Allthird layer of mortar
the coupons was cast, aafter
were demoulded plastic
24 hsheet was the
and had used to
seal the mold and to prevent premature evaporation of the water. All the ◦
coupons
same curing process for 28 days; stored at ambient temperature (approximately 20 C) and a relative were demoulded
after of
humidity 24between
hours and45%had and the
60%same
for atcuring
least 28process
days. Thefor resulting
28 days; fiber
stored at ambient
volume fractiontemperature
of the
(approximately
samples was equal to20 °C) (0.65%
1.29% and a relative humidity
in the loading of between 45% and 60% for at least 28 days. The
direction).
resulting fiber volume fraction of the samples was equal to 1.29% (0.65% in the loading direction).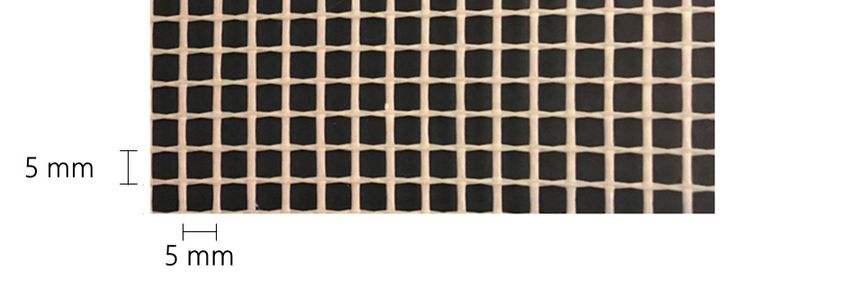
Appl. Sci. 2018, 8, x FOR PEER REVIEW 5 of 19
Appl. Sci. 2019,
2018, 9,
8, 1293
x FOR PEER REVIEW 55 of
of 19
Figure 3. Stacking sequence TRC coupons.
Figure 3. Stacking sequence TRC coupons.
Figure 3. Stacking sequence TRC coupons.
(a) (b)
(a) technique was used for the preparation
Figure 4. A hand lay-up preparation of the (b)
the specimens:
specimens: (a) TRC coupons
and (b) 4.
Figure sandwich beams with
A hand lay-up TRC faces.
technique was used for the preparation of the specimens: (a) TRC coupons
and (b) sandwich beams with TRC faces.
For the
the element
elementlevel,
level,sandwich
sandwichbeams beams with
witha total length
a total of 2500
length mmmm
of 2500 and and
a width of 200ofmm
a width 200were
mm
fabricated
wereFor and
fabricated tested. An
and tested.
the element EPS core with
An EPS core
level, sandwich a thickness
withwith
beams of 200
a thickness mm was
of 200 mm
a total length covered
wasmm
of 2500 on both
covered
and aonsides with
both of
width a
sides5 mm
200with
mm
thick
awere
5 mm TRC layer
thick
fabricated using
TRC a hand
andlayer using
tested. An lay-up
a hand
EPS technique.
corelay-up After spreading
with atechnique.
thickness After
of out awas
layer
200 spreading
mm of mortar,
out a layer
covered the textile
of mortar,
on both grid
the
sides with
was embedded
textile grid was in the mortar.
embedded in The
the glass fiber
mortar. volume
The glass fraction
fiber was
volume equal to
fractionthat
was
a 5 mm thick TRC layer using a hand lay-up technique. After spreading out a layer of mortar, the of the
equal coupons,
to that 0.65%
of the
in the loading
coupons,
textile grid0.65%
wasdirection.
embedded Thein
in the loading faces
the were sealed
direction.
mortar. Thewith
The glassa plastic
faces cover tofraction
werevolume
fiber sealed prevent
with premature
a plastic
was cover
equal toevaporation.
to
thatprevent
of the
All beams were stored for at least 28 days at ambient temperature (approximately 20 ◦ C) and relative
premature evaporation. All beams were stored for at least 28 days
coupons, 0.65% in the loading direction. The faces were sealed with a plastic cover to preventat ambient temperature
humidity
prematureof evaporation.
(approximately between
20 °C)45% and
andAll 60%.
relative
beamshumidity of between
were stored for 45% and 60%.
at least 28 days at ambient temperature
(approximately 20 °C) and relative humidity of between 45% and 60%.
2.3. Test Set-Up
2.3. Test set-up
2.3. Test
2.3.1. set-up Tensile Tests
Uniaxial
2.3.1. Uniaxial Tensile Tests
2.3.1.For
For
the material
Uniaxial Tensilelevel,
the material
uniaxial tensile tests on TRC coupons were preferred over bending tests,
Testsuniaxial
level, tensile tests on TRC coupons were preferred over bending tests,
since they are more representative for the considered application: the thin faces of a sandwich panel
sinceForthey are more representative for the considered
the material level, uniaxial tensile tests on TRC application: the thin
coupons were faces ofover
preferred a sandwich
bendingpanel
tests,
subjected to bending are loaded under (nearly) uniform tension or compression. In the uniaxial test
subjected to bending are loaded under (nearly) uniform tension or compression. In the uniaxial
since they are more representative for the considered application: the thin faces of a sandwich panel test
set-up, the load was introduced via bolt through aluminum end-plates, which were glued to the TRC
set-up, the load was introduced via bolt through aluminum end-plates, which were glued
subjected to bending are loaded under (nearly) uniform tension or compression. In the uniaxial test to the TRC
coupons with a two-component glue. Stress concentrations were avoided by tapering the end-plates
coupons
set-up, thewith
loada was
two-component glue.
introduced via Stress
bolt concentrations
through aluminum were avoided
end-plates, by tapering
which the to
were glued end-plates
the TRC
(Figure 5). The specimens were loaded by a servo-hydraulic actuator with a capacity of 25 kN, using a
(Error! Reference source not found.). The specimens were loaded by a servo-hydraulic
coupons with a two-component glue. Stress concentrations were avoided by tapering the end-plates actuator with
10 kN load cell. The static tests were displacement-controlled with a rate of 1 mm/min. The cyclic
a(Error!
capacity of 25 kN, using a 10 kN load cell. The static tests were displacement-controlled
Reference source not found.). The specimens were loaded by a servo-hydraulic actuator with with a rate
loading was load controlled at a frequency of 10 Hz. Displacements were measured with a dynamic
of 1 mm/min.
a capacity of 25The
kN,cyclic
usingloading
a 10 kNwas
loadload
cell. controlled at a frequency
The static tests of 10 Hz. Displacements
were displacement-controlled with awere
rate
extensometer at one side and digital image correlation (DIC) at the other side.
of 1 mm/min. The cyclic loading was load controlled at a frequency of 10 Hz. Displacements were
Appl. Sci. 2018, 8, x FOR PEER REVIEW 6 of 19
Appl. Sci. 2018, 8, x FOR PEER REVIEW 6 of 19
Appl. Sci. 2019, 9, 1293
measured with a dynamic extensometer at one side and digital image correlation (DIC) at the6other
of 19
measured with a dynamic extensometer at one side and digital image correlation (DIC) at the other
side.
side.
Figure5.5.Uniaxial
Figure Uniaxialtest
testset-up
set-upand
anddimensions.
dimensions.
Figure 5. Uniaxial test set-up and dimensions.
2.3.2. Four-Point Bending Tests
2.3.2. Four-Point Bending Tests
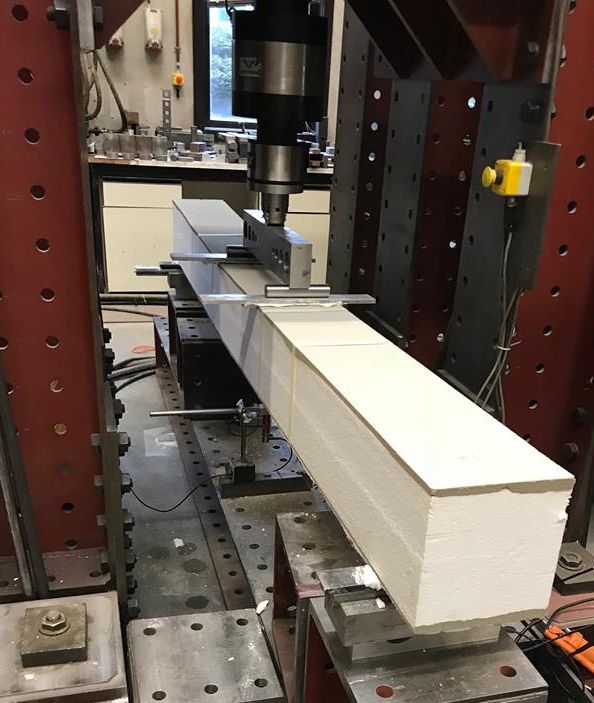
2.3.2.To
Four-Point
assess theBending
fatigue Tests
behavior on the element level, sandwich beams were both statically and
To assess the fatigue behavior on the element level, sandwich beams were both statically and
cyclically loaded using a four-point
To assess the fatigue behavior on bending test set-up.
the element The distance
level, sandwich between
beams were the
bothroller supports
statically and
cyclically loaded using a four-point bending test set-up. The distance between the roller supports was
was 2200 mm. The load was induced by means of a 500 mm span dividing beam, connected
cyclically loaded using a four-point bending test set-up. The distance between the roller supports through
was
2200 mm. The load was induced by means of a 500 mm span dividing beam, connected through a
a 10 kN
2200 mm.load
Thecell
loadto was
a servo-hydraulic
induced by means actuator
of a with
500 mma capacity of 25 kNbeam,
span dividing (Figure 6). The static
connected throughtestsa
10 kN load cell to a servo-hydraulic actuator with a capacity of 25 kN (Figure 6). The static tests were
10 kN load cell to a servo-hydraulic actuator with a capacity of 25 kN (Figure 6). The static tests werea
were displacement-controlled with a rate of 1 mm/min. The cyclic loading was load-controlled at
displacement-controlled with a rate of 1 mm/min. The cyclic loading was load-controlled at a
frequency of 2 Hz. To avoid
displacement-controlled local
with stressofconcentrations,
a rate 1 mm/min. The aluminum distribution
cyclic loading was plates were placed
load-controlled at ata
frequency of 2 Hz. To avoid local stress concentrations, aluminum distribution plates were placed at
the supports
frequency of and
2 Hz.atTotheavoid
loading areas.
local stressMid-span displacements
concentrations, weredistribution
aluminum monitored with anwere
plates LVDT (Linear
placed at
the supports and at the loading areas. Mid-span displacements were monitored with an LVDT
Variable
the Differential
supports and at Transducer).
the loading DICareas.was used to monitor
Mid-span the cracking
displacements were behavior
monitoredof with
the tensile
an LVDTface
(Linear Variable Differential Transducer). DIC was used to monitor the cracking behavior of
partly inVariable
(Linear the zoneDifferential
of the constant moment. DIC was used to monitor the cracking behavior of
Transducer).
Figure 6. Four-point bending test set-up.
Figure
Figure 6.
6. Four-point
Four-point bending
bending test
test set-up.
set-up.
2.3.3. Digital Image Correlation
2.3.3. Digital
2.3.3. Digital Image
Image Correlation
Correlation
To measure strains and displacements and to visualize cracks, digital image correlation (DIC)
To measure
To measurestrains
strainsand
anddisplacements
displacementsand andto to
visualize
visualizecracks, digital
cracks, image
digital correlation
image (DIC)
correlation was
(DIC)
was used. It is an optical, non-contacting method to measure displacement- and strain-fields of a
used. It is an optical, non-contacting method to measure displacement- and strain-fields
was used. It is an optical, non-contacting method to measure displacement- and strain-fields of a of a specimen.
specimen. The measurement is based on the comparison of a reference image (generally unloaded
The measurement
specimen. is based onisthe
The measurement comparison
based of a reference
on the comparison of aimage (generally
reference image unloaded
(generally condition)
unloaded
condition) with images taken at different load steps. The settings of the DIC systems are specified in
with images
condition) taken
with at different
images taken atload steps.load
different Thesteps.
settings
Theof the DIC
settings of systems are specified
the DIC systems in Tablein
are specified 3.
Table 3. The features of the used cameras are listed in Error! Reference source not found.. For the
The features of the used cameras are listed in Table 4. For the static tests, images
Table 3. The features of the used cameras are listed in Error! Reference source not found.. For the were acquired at
static tests, images were acquired at a frequency of 0.3 1/s. During the cyclic tests, one image every
a frequency
static of 0.3 1/s.
tests, images wereDuring theatcyclic
acquired tests, one
a frequency ofimage
0.3 1/s.every
During10 cycles wastests,
the cyclic takenone
during
image theevery
first
10 cycles was taken during the first 100 cycles. Further, one image was acquired every 100 cycles up
100cycles
10 cycles.wasFurther,
takenone image
during thewas
firstacquired every
100 cycles. 100 cycles
Further, one up to cycle
image was 1000 and every
acquired every1000 cycles up
100 cycles up
Appl. Sci. 2019, 9, 1293 7 of 19
Appl. Sci. 2018, 8, x FOR PEER REVIEW 7 of 19
to cycle 100,000. A more extensive description of the working principle of DIC can be found in the
to cycle 1000
literature [32].and every 1000 cycles up to cycle 100,000. A more extensive description of the working
principle of DIC can be found in the literature [32].
Table 3. Settings digital image correlation (DIC) analysis.
Table 3. Settings digital image correlation (DIC) analysis.
TRC Coupons Sandwich Beams
subset TRC21 coupons
pxs Sandwich
21 pxsbeams
subset
step 721pxs
pxs 21 pxs
7 pxs
filter size
step 711pxs 711
pxs
areafilter
of interest
size 250 × 4511 mm 250 × 190
11 mm
area of interest 250x45 mm 250x190 mm
Table 4. Camera features.
Table 4. Camera features.
Type of Camera CCD
type ofsize
lenses camera 8CCD
mm
resolution
lenses size 2546 × 2048 pxs
8 mm
resolution 2546x2048 pxs
3. Results and Discussion
3. Results and discussion
3.1. Investigations on TRC Coupons
3.1. Investigations on TRC Coupons
In total 27 specimens were tested. First, the reference behavior (TRC REF) was characterized
by testing nine
In total specimenswere
27 specimens in a tested.
quasi-static
First, way. The stresses
the reference were(TRC
behavior calculated
REF) was using the nominal
characterized by
dimensions, strains were measured using DIC over a length of 320 mm.
testing nine specimens in a quasi-static way. The stresses were calculated using the nominal The average stress–strain
curve was determined
dimensions, strains were from the different
measured usingcurves;
DIC overthe standard
a length of deviation
320 mm.isThepresented
average asstress–strain
the shaded
area (Figure 6). In the first linear stage, the modulus E1 was 11.38 GPa. A modulus
curve was determined from the different curves; the standard deviation is presented as the shaded E3 of 411.34 MPa
was
areadetermined
(Figure 6). Inin the
the first
thirdlinear
stage.stage,
On average, the first
the modulus E1crack appeared
was 11.38 GPa. at
A amodulus
stress equal
E3 ofto411.34
1.65 MPa.
MPa
was As mentioned
determined inbefore,
the thirdbuilding elements,
stage. On average,suchtheasfirst
façade panels,
crack will be
appeared at aprone
stresstoequal
repeated loading
to 1.65 MPa.
conditions originating
As mentioned frombuilding
before, the wind. Under characteristic
elements, such as façadewind loading,
panels, will bethe stress
prone to level in the
repeated faces
loading
will not exceed
conditions 2 MPa (Figure
originating from the 7).wind.
To have a clear
Under insight on wind
characteristic the influence
loading,ofthe
such loading
stress level conditions,
in the faces
three series
will not of six2specimens
exceed MPa (Figure were7).cyclically
To have aloaded up to three
clear insight different
on the stress
influence levels;
of such 0.5 MPa,
loading 1.0 Mpa,
conditions,
and 2.0 MPa. These series were nominated as: TRC CYCL 0.5 MPa, TRC CYCL
three series of six specimens were cyclically loaded up to three different stress levels; 0.5 MPa, 1.0 Mpa, and TRC
1.0
CYCL 2.0 MPa.
Mpa, and 2.0 MPa. These series were nominated as: TRC CYCL 0.5 MPa, TRC CYCL 1.0 Mpa,
Figure 7. Reference behavior of TRC coupons.
Figure 7. Reference behavior of TRC coupons.
All specimens were loaded 100,000 cycles up to the specific stress level and unloaded to a stress
All specimens were loaded 100,000 cycles up to the specific stress level and unloaded to a stress
level above 0 MPa to avoid loading the specimens in compression. To compare the different series,
level above 0 MPa to avoid loading the specimens in compression. To compare the different series,
focus was put on the evolution of some distinctive fatigue parameters during the cyclic loading: the
cycle modulus and the dissipative energy. The modulus per cycle was determined from the hysteresis
Appl. Sci. 2019, 9, 1293 8 of 19
focusSci.was
Appl. 2018,put on the
8, x FOR evolution
PEER REVIEW of some distinctive fatigue parameters during the cyclic loading: 8 of 19
the cycle modulus and the dissipative energy. The modulus per cycle was determined from the
curve by linear
hysteresis curveregression and expressed
by linear regression and relatively
expressedcompared to the modulus
relatively compared to theofmodulus
the first of
cycle. The
the first
dissipative energy wasenergy
cycle. The dissipative calculated
was as the area as
calculated enclosed
the areabyenclosed
the loading–unloading curve of each
by the loading–unloading cycle.
curve of
As
eachfor the modulus,
cycle. As for thethis was expressed
modulus, relatively relatively
this was expressed comparedcompared
to the energy
to thedissipation of the first
energy dissipation of
cycle. The
the first evolution
cycle. of these of
The evolution different fatigue fatigue
these different parameters was observed
parameters to be strongly
was observed relatedrelated
to be strongly to the
formation of cracks.
to the formation Without
of cracks. the occurrence
Without of cracks,
the occurrence both the
of cracks, modulus
both and theand
the modulus dissipative energy
the dissipative
remained more or less constant (Error! Reference source not found. a). Regardless
energy remained more or less constant (Figure 8a). Regardless of the applied maximum cycle stress of the applied
maximum
(1.0 MPa orcycle stresseach
2.0 MPa), (1.0 formation
MPa or 2.0 of MPa),
a crackeach
led toformation of of
a decrease a crack led to atogether
the modulus, decreasewithof the
an
modulus,
increase intogether with anenergy
the dissipative increase in the8b).
(Figure dissipative energy (Error! Reference source not found. b).
TRC CYCL. 1.0 MPa D TRC CYCL. 1.0 MPa B
(a) (b)
Figure 8. The
The evolution
evolution of
of the modulus and the dissipated energy of representative TRC coupons
during the loading–unloading cycles: (a) an uncracked sample and (b) a cracked sample.
visualizing the
Using DIC enabled tracking and visualizing the crack
crack patterns
patterns during
during the therepeated
repeated loading
loadingtests.
tests.
The crack widths or crack openings were calculated using the displacement fields measured by the
DIC. The
The formation
formationofofcracks
crackswaswas related to to
related thethemaximum
maximum cycle stress.
cycle The The
stress. higher the maximum
higher the maximum cycle
stressstress
cycle the higher the probability
the higher of forming
the probability cracks.
of forming TRCTRC
cracks. CYCL 0.5 MPa
CYCL 0.5 MParemained
remained uncracked
uncracked for for
all
six tested coupons. This stress level did not come near the cracking stress
all six tested coupons. This stress level did not come near the cracking stress of the TRC equalof the TRC equal to the
average reference
referencecracking
crackingstress of 1.65
stress MPa,
of 1.65 which
MPa, was observed
which duringduring
was observed the staticthetests. Thetests.
static cracking
The
phenomena of TRC have
cracking phenomena a very
of TRC havestochastic nature, resulting
a very stochastic in a largein
nature, resulting variation on the first
a large variation oncracking
the first
strength. strength.
cracking A standard deviationdeviation
A standard of 0.54 MPa was MPa
of 0.54 determined, leading toleading
was determined, a smeared to a range
smeared of 1.11 MPa
range of
and MPa
1.11 2.19 MPa. TRC
and 2.19 CYCL
MPa. TRC 1.0CYCL
MPa 1.0andMPaTRCand CYCL
TRC2.0 MPa2.0
CYCL were
MPaloaded closer to
were loaded this range
closer to thiswhich
range
explains
which the larger
explains the probability of the occurrence
larger probability of cracks.
of the occurrence of Two specimens
cracks. of TRC CYCL
Two specimens of TRC 1.0CYCL
MPa
andMPa
1.0 one and
specimen of TRC CYCL
one specimen of TRC2.0 CYCLMPa2.0remained uncracked
MPa remained (Table (Table
uncracked 5). Overall, more more
5). Overall, crackscracks
were
observed
were for TRC
observed forCYCL 2.0 MPa.
TRC CYCL 2.0 The
MPa.outlier is specimen
The outlier A of TRC
is specimen A ofCYCL
TRC CYCL1.0 MPa, 1.0in which
MPa, 22 cracks
in which 22
were observed after the cyclic preloading. No clear explanation could be found
cracks were observed after the cyclic preloading. No clear explanation could be found for this; for this; damage caused
during manufacturing
damage caused duringismanufacturing
the most probable is thecause
mostfor this distorted
probable cause forbehavior.
this distorted behavior.
Table 5. Number of cracks formed during cyclic preloading of the TRC coupons.
Table coupons.
TRC
TRC CYCL
CYCL TRC CYCL TRC
TRC CYCL TRC CYCL
CYCL
Specimen
Specimen 0.5 MPa
0.5 MPa 1.0 MPa
1.0 MPa 2.0 MPa
2.0 MPa
A A 00 22
22 7 7
B B 0 0 8
8 12 12
C 0 0 10
C D 00 0
0 0
10
D E 00 0
5 16 0
E F 00 15 1 16
F 0 1 1
Once a crack was formed, its width tended to stabilize. Both for TRC CYCL. 1.0 MPa as for TRC
CYCL. 2.0 MPa, the crack width increased during the first hundred cycles but stabilized afterwards.
As an example, the evolution of the crack width was shown for a sample subjected to a maximum
cycle stress of 1.0 MPa (Error! Reference source not found. 9).
Appl. Sci. 2019, 9, 1293 9 of 19
Once a crack was formed, its width tended to stabilize. Both for TRC CYCL. 1.0 MPa as for TRC
CYCL. 2.0 MPa, the crack width increased during the first hundred cycles but stabilized afterwards.
As an example, the evolution of the crack width was shown for a sample subjected to a maximum
Appl. Sci. 2018, 8, x FOR PEER REVIEW 9 of 19
cycleSci.
Appl. stress
2018, of
8, x1.0
FORMPa (Figure
PEER REVIEW9). 9 of 19
TRC CYCL. 1.0 MPa B
TRC CYCL. 1.0 MPa B
Figure 9. Evolution of the crack width of some representative cracks formed during cyclic loading of
Figure 9.
Figure Evolution of
9. Evolution of the
the crack
crack width
width of
of some
some representative
representative cracks
cracks formed
formed during
during cyclic
cyclic loading
loading of
of
TRC coupons.
TRC coupons.
TRC coupons.
After passing
After passing all all loading
loading cycles,
cycles, aa static
static test
test as
as described
described in in section
Section 2.3.1
2.3.1 was
was performed
performed to to
After
determine passing all loading cycles, a static test as described in section 2.3.1 was performed to
determinethe theresidual
residualcapacity
capacity of of the
the TRC
TRC coupons.
coupons.The Thestresses
stresseswerewerecalculated
calculatedusingusingthe thenominal
nominal
determine the
dimensions residual
of the
thecoupons, capacity
coupons, the of the TRC
strains werecoupons.
measured The using
stressesDIC were calculated using the nominal
dimensions of the strains were measured using DIC over aover
lengtha length of 320
of 320 mm. Themm. The
obtained
dimensions
obtained of the
stress–straincoupons,
curves the
were strains
groupedwere measured
per series. Inusing
Figure DIC 10 over
one a
canlength
see of
that 320
the mm. The
residual
stress–strain curves were grouped per series. In Figure 10 one can see that the residual behavior was
obtained
behavior stress–strain
wasaffected
only slightly curves were
affected grouped per series. In Figure 10 one can see that the residual
only slightly for series TRCfor CYCLseries
0.5TRC
MPa.CYCL 0.5 MPa.
As shown As shown
in Table in Table
5 no cracks were 5 no cracksduring
induced were
behaviorduring
induced was onlythe slightly
cyclic affectedThe
loading. for formation
series TRCof CYCL
cracks0.5was
MPa. As shown
found as the in Table
only 5 no cracks
degradation were
fatigue
the cyclic loading. The formation of cracks was found as the only degradation fatigue mechanism,
induced
mechanism, during the
leading cyclic
directlyloading.
to theof The formation
explanation of
of the cracks
observedwas found
residual as the only degradation fatigue
leading directly to the explanation the observed residual behavior: bothbehavior: both as
the modulus, thethemodulus,
strength
mechanism,
as the strength leading
were directly
comparable to the
to explanation
the reference of the observed
behavior (Table residual
6). The behavior:
only both
difference the modulus,
between the
were comparable to the reference behavior (Table 6). The only difference between the residual curves
as the strength
residual curves were
and comparable
the reference toonethewas
reference
found behavior
in the (Table 6).
multiple The only
cracking difference
stage. As can between
be seen the
in
and the reference one was found in the multiple cracking stage. As can be seen in Table 6, more cracks
residual
Table 6, curves
more and
cracks the
werereference
formed one
for was
TRC found
CYCL in
0.5 the
MPa multiple
samples cracking
compared stage.
to As
REF, can be
which seen
could in
were formed for TRC CYCL 0.5 MPa samples compared to REF, which could explain the limited stress
Table 6, more cracks were formed for TRC CYCL 0.5 MPa samples compared to REF, which could
increase during the multiple cracking stage, and, thus, the shifted stress–strain curves.
Figure10.
Figure Residualbehavior
10.Residual behaviorof
ofTRC
TRCCYCL.
CYCL.0.5
0.5MPa.
MPa.
Figure 10. Residual behavior of TRC CYCL. 0.5 MPa.
Appl. Sci. 2019, 9, 1293 10 of 19
Appl. Sci. 2018, 8, x FOR PEER REVIEW 10 of 19
Table
Table 6.6. Quantitative
Quantitativecomparison
comparisonof of some
some distinctive
distinctive parameters
parameters ofstatic
of the the static
tensiletensile stress–strain
stress–strain curve:
curve: the average reference versus the specimens cyclically preloaded
the average reference versus the specimens cyclically preloaded to 0.5 MPa. to 0.5 MPa.
Specimen E1 E3 σcrack σultimate # cracks
# Cracks
Specimen E1 E3 σcrack σultimate after cyclic
GPa GPaGPa GPa MPa
MPa MPa
MPa After Cyclic at failure
preloading At Failure
Preloading
REF avg avg
11.38 11.380.41 0.41 1.65
1.65
7.49
7.49 -
- 13
13
REF
st dev 1.94
st dev 1.940.018 0.018 0.54
0.54 0.52
0.52 -- 2 2
A A8.99 8.99 0.45 0.45 2.19
2.19 6.44
6.44 00 14 14
B B15.32 15.320.49 0.49 1.85
1.85 7.22
7.22 00 11 11
C C11.74 11.740.37 0.37 1.49
1.49 6.43
6.43 00 19 19
D
CYCL. CYCL.D 14.60 14.600.43 0.43 1.38
1.38 7.40
7.40 0
0 19
19
0.5 MPa E 9.22 0.48 1.96 7.07 0 14
0.5 MPa E F9.22 12.640.48 0.43 1.96
2.30 7.07
7.32 00 17 14
F 12.64 0.43 2.30 7.32 0 17
avg 12.08 0.44 1.86 6.98 - 16
avg 12.08
st dev 2.42 0.44 0.038 1.86
0.34 6.98
0.40 -- 3 16
st dev 2.42 0.038 0.34 0.40 - 3
As the maximum stress to which the TRC coupons were cyclically loaded was increased for series
TRC AsCYCL the 1.0
maximum
MPa andstress to which
TRC CYCL 2.0 the
MPa,TRC coupons
so did were cyclically
the probability loaded was
to the formation ofincreased for
cracks. Once
series
a crackTRCwasCYCL 1.0 this
formed, MPadirectly
and TRC CYCL in
resulted 2.0aMPa, so did
decrease of the probabilityintothe
E1 measured theresidual
formation of cracks.
stress–strain
Once a crack was formed, this directly resulted in a decrease of E 1 measured in the residual stress–
behavior. The more cracks are formed, the lower E1 . Since this initial modulus was very dependent
strain
on the behavior.
occurrenceThe more cracks
of cracks, a largeare formed,
scatter existsthe
on lower E1. Since
the results and thethisaverage
initial value
modulus
of Ewas very
1 was not
dependent on the occurrence of cracks, a large scatter exists on the results and the
representative and, therefore, not displayed in Tables 7 and 8. A specimen fully saturated with cracks average value of
E 1 was not representative and, therefore, not displayed in Table 7 and Table 8. A specimen fully
showed a linear behavior in the static tests, for example, specimen A in Figure 11 and specimen E in
saturated
Figure 12.with cracksspecimens,
For these showed a few
linear behavior
extra cracksin the formed
were static tests, for example,
during the static specimen A inresidual
tests and the Figure
11 and specimen E in Figure 12. For these specimens, few extra cracks were formed
behavior was characterized with a modulus equal to E3 (Tables 7 and 8). The cyclic preloading did during the static
not
tests and the residual behavior was characterized with a modulus equal to E 3 (Table 7-8). The
affect the modulus in the last branch, E3 (Tables 7 and 8). Overall, the ultimate strength was lowered
cyclic
after subjection to loading cycles up to 1.0 MPa (Table 7) and 2.0 MPa (Table 8). However, no clear link
was found between the number of cracks and the ultimate strength.
Figure 11. Residual behavior of TRC CYCL. 1.0 MPa.
Figure 11. Residual behavior of TRC CYCL. 1.0 MPa.Appl. Sci. 2019, 9, 1293 11 of 19
Appl. Sci. 2018, 8, x FOR PEER REVIEW 11 of 19
Table
Table 7.7. Quantitative
Quantitativecomparison
comparisonof of some
some distinctive
distinctive parameters
parameters ofstatic
of the the static
tensiletensile stress–strain
stress–strain curve:
curve: the average reference versus the specimens cyclically preloaded
the average reference versus the specimens cyclically preloaded to 1.0 MPa. to 1.0 MPa.
Specimen E1 E3 σcrack σultimate # cracks
# Cracks
E1 E3 σcrack σultimate after cyclic
Specimen GPa at failure
GPaGPa GPa MPa MPa
MPa MPa After Cyclic
preloading At Failure
Preloading
avg 11.38
avg 11.380.41 0.41 1.65
1.65 7.49
7.49 -- 13 13
REF REF
st dev 1.94
st dev 1.940.018 0.018 0.54
0.54 0.52
0.52 -- 2 2
A A0.48 0.48 0.48 0.48 - - 5.55
5.55 22
22 24 24
B B0.92 0.92 0.49 0.49 2.41
2.41 5.92
5.92 88 14 14
C C8.37 8.37 0.39 0.39 1.53
1.53 5.49
5.49 00 22 22
CYCL.D D 12.27 0.45 1.63 7.20 0 14
CYCL. 12.27 0.45 1.63 7.20 0 14
1.0 MPa E 0.91 0.41 1.70 8.25 5 29
1.0 MPa E F0.91 2.59 0.41 0.41 1.70
1.20 8.25
7.41 15 28 29
F 2.59 0.41 1.20 7.41 1 28
avg - 0.44 1.69 6.64 - 22
avg st dev - 0.037 1.69
0.40 6.64
1.04 - 6
Figure 12. Residual behavior of TRC CYCL. 2.0 MPa.
Figure 12. Residual behavior of TRC CYCL. 2.0 MPa.
Table 8. Quantitative comparison of some distinctive parameters of the static tensile stress–strain curve:
Table 8. Quantitative
the average comparison
reference versus of somecyclically
the specimens distinctive parameters
preloaded of MPa.
to 2.0 the static tensile stress–strain
curve: the average reference versus the specimens cyclically preloaded to 2.0 MPa.
# Cracks
Specimen E1 E 1 E 3 E3 σ σcrack
crack σ
σ ultimate
ultimate # cracks
Specimen After Cyclic
GPa GPa MPa MPa after cyclic At Failure
GPa GPa MPa MPa Preloading at failure
preloading
avg 11.38 0.41 1.65 7.49 - 13
REFavg 11.38
st dev 1.94 0.41 0.018 1.65
0.54 7.49
0.52 -- 2 13
REF
st dev A1.94 0.840.018 0.42 0.54
2.30 0.52
6.74 7- 22 2
A B0.84 0.65 0.42 0.48 2.30
2.13 6.74
6.48 127 19 22
B C0.65 0.81 0.48 0.43 2.41
2.13 5.65
6.48 10
12 20 19
CYCL.C D 13.06 0.47 2.66 5.88 0 10
0.81 0.43 2.41 5.65 10 20
2.0 MPa E 0.48 0.42 2.42 6.68 16 24
CYCL. D 13.06
F 4.76 0.47 0.48 2.66
2.24 5.88
7.13 10 11 10
2.0 MPa E 0.48 0.42 2.42 6.68 16 24
avg - 0.45 2.36 6.43 - 18
F 4.76
st dev - 0.48 0.029 2.24
0.17 7.13
0.51 -1 5 11
avg - 0.45 2.36 6.43 - 18
st dev - 0.029 0.17 0.51 - 5Appl. Sci. 2018, 8, x FOR PEER REVIEW 12 of 19
Appl. Sci. 2019, 9, 1293 12 of 19
Monitoring the static tests up to failure with DIC measurements enabled to map cracking
patterns and measure crack widths and spacings. The average, maximum and total crack widths were
Monitoring the static tests up to failure with DIC measurements enabled to map cracking patterns
calculated from the measured displacement fields for each specimen separately at different stress
and measure crack widths and spacings. The average, maximum and total crack widths were
levels. In addition to the crack spacing itself, the cumulative frequency was also determined to
calculated from the measured displacement fields for each specimen separately at different stress levels.
quantify the degree of saturation, i.e., the ratio of actually formed cracks to the total number of cracks
In addition to the crack spacing itself, the cumulative frequency was also determined to quantify the
at failure. To compare the different series to the reference behavior, the average per series was
degree of saturation, i.e., the ratio of actually formed cracks to the total number of cracks at failure.
calculated out of the average and total crack width, the crack spacing and the cumulative frequency.
To compare the different series to the reference behavior, the average per series was calculated out of
For the maximum crack width, the absolute maximum crack width observed over all specimens
the average and total crack width, the crack spacing and the cumulative frequency. For the maximum
within one series was determined. The maximum crack width is an important parameter for
crack width, the absolute maximum crack width observed over all specimens within one series was
designing concrete building elements regarding durability measures, decisive for the ingress of
determined. The maximum crack width is an important parameter for designing concrete building
aggressive materials.
elements regarding durability measures, decisive for the ingress of aggressive materials.
Looking at the cumulative frequency one could observe that more cracks were formed at lower
Looking at the cumulative frequency one could observe that more cracks were formed at lower
stress levels for TRC CYCL 0.5 MPa, TRC CYCL 1.0 Mpa, and TRC CYCL 2.0 MPa., while for TRC
stress levels for TRC CYCL 0.5 MPa, TRC CYCL 1.0 Mpa, and TRC CYCL 2.0 MPa., while for TRC
REF 20% of the total amount of cracks were still formed at stress levels above 4.0 MPa (Figure 13 a).
REF 20% of the total amount of cracks were still formed at stress levels above 4.0 MPa (Figure 13a).
The crack spacing showed a discrepancy between TRC REF and TRC CYCL 0.5 MPa versus TRC
The crack spacing showed a discrepancy between TRC REF and TRC CYCL 0.5 MPa versus TRC CYCL
CYCL 1.0 MPa and TRC CYCL 2.0 MPa (Figure 13 b) again. For TRC CYCL 1.0 MPa and TRC CYCL
1.0 MPa and TRC CYCL 2.0 MPa (Figure 13b) again. For TRC CYCL 1.0 MPa and TRC CYCL 2.0 MPa
2.0 MPa cracks originated at lower stress levels leading to a diminished crack spacing. As observed
cracks originated at lower stress levels leading to a diminished crack spacing. As observed for the
for the cumulative frequency, the crack patterns of the cyclically preloaded series were nearly
cumulative frequency, the crack patterns of the cyclically preloaded series were nearly complete at the
complete at the stress level of 2.5 MPa. At all stress levels, the crack spacing of these series was lower
stress level of 2.5 MPa. At all stress levels, the crack spacing of these series was lower compared to
compared to TRC REF, leading to the conclusion that more cracks were formed for TRC CYCL
TRC REF, leading to the conclusion that more cracks were formed for TRC CYCL 0.5 MPa, TRC CYCL
0.5 MPa, TRC CYCL 1.0 Mpa, and TRC CYCL 2.0 MPa.
1.0 Mpa, and TRC CYCL 2.0 MPa.
(a) (b)
Figure
Figure 13.
13. The
Thenumber
numberofofcracks
crackspresent
present in
in the
thedifferent
different samples
samples was
was used
used to
to compare:
compare: (a)
(a) the
the average
average
cumulative
cumulative frequency
frequency and (b) the average crack spacing.
Other than
Other than for
for TRC
TRC REFREF and
and TRC
TRC CYCL
CYCL 0.5 0.5 MPa,
MPa, TRC
TRC CYCL
CYCL 1.01.0 Mpa,
Mpa, and
and TRC
TRC CYCL
CYCL 2.02.0 MPa
MPa
showed
showed cracks already at stress levels lower than 1.0 MPa (Figure 14), as a consequence
already at stress levels lower than 1.0 MPa (Figure 14), as a consequence of the fact of the fact that
cracks
that were were
cracks already formedformed
already during during
the cyclicthepreloading. This is displayed
cyclic preloading. for all studied
This is displayed for parameters.
all studied
Looking at the average crack width, a discrepancy was observed for stress
parameters. Looking at the average crack width, a discrepancy was observed for stress levels levels below 2.0 MPa and
below
above
2.0 MPa2.0and
MPa: at lower
above stressatlevels,
2.0 MPa: lowerTRC CYCL
stress 1.0 TRC
levels, MPa CYCL
and TRC1.0CYCL
MPa and2.0 MPa
TRChad CYCL a higher average
2.0 MPa had
acrack width,
higher whilecrack
average for higher
width,stress
whilelevels, widerstress
for higher crackslevels,
were measured
wider cracksfor TRC
wereREF and TRC
measured forCYCL.
TRC
0.5 MPa
REF and(Figure
TRC CYCL.14a). The same (Figure
0.5 MPa tendency 14was seen same
a). The for thetendency
maximum wascrack
seenwidth butmaximum
for the less pronounced
crack
(Figurebut
width 14b).
lessSince this maximum
pronounced (Figurecrack width
14 (b)). wasthis
Since strongly
maximumrelated to the
crack durability
width requirements,
was strongly relatedoneto
could state that the impact of repeated loading on durability measurements
the durability requirements, one could state that the impact of repeated loading on durability is little. The lowest total
crack width was
measurements is observed
little. Thefor TRCtotal
lowest REF crack
and this at all
width stress
was levels. for
observed (Figure
TRC 14c).
REF and this at all stress
levels. (Figure 14 c).Appl. Sci. 2019, 9, 1293 13 of 19
Appl. Sci. 2018, 8, x FOR PEER REVIEW 13 of 19
(a) (b)
(c)
Figure
Figure14.
14.The
Thecracking
crackingpatterns
patternsof
ofthe
thedifferent
differentseries
serieswere
werecompared
comparedusing
usingthe:
the:(a)
(a)the
theaverage
averagecrack
crack
width,
width,(b)
(b)the
themaximum
maximumcrack
crack width
width and
and (c)
(c) the
the total
total crack
crack width.
width.
3.2.Investigations
3.2. Investigationson
onSandwich
SandwichBeams
Beams
Inaddition
In additionto tothe
the fatigue
fatiguebehavior
behaviorof of TRC
TRC coupons
couponsunder
undertensile
tensileloading,
loading,the thefatigue
fatiguebehavior
behavior
in bending of sandwich (SW) beams with TRC faces was investigated. In
in bending of sandwich (SW) beams with TRC faces was investigated. In total 13 beams were tested. total 13 beams were tested.
To determine
To determinethe thevirgin,
virgin,reference
referencebehavior
behaviorofofthe thepanels
panels(SW (SWREF),
REF), five
five samples
samples were
were tested
tested with
with a
a quasi-static four-point bending test, as described in Section 2.3.2. The other
quasi-static four-point bending test, as described in section 2.3.2. The other beams were subjected to beams were subjected
atocyclic
a cyclic preloading,
preloading, divided
divided intointo two
two different
different seriesanalogous
series analogoustotothe theexperiments
experimentson onthe
the TRC
TRC
coupons.Since
coupons. Sincenonoinfluence
influencewas wasobserved
observedfor foraacyclic
cyclicpreloading
preloadingof ofthe
thecoupons
couponsup upto to0.5
0.5MPa
MPathis
this
was excluded from further experiments. The stress levels of 1.0 MPa and 2.0
was excluded from further experiments. The stress levels of 1.0 MPa and 2.0 Mpa, respectively, in the Mpa, respectively, in the
tensileface
tensile facewere
wereconverted
convertedto toequivalent
equivalentloadsloadsfor forthe
thesandwich
sandwichbeamsbeamsusingusingaavalidated
validatednumerical
numerical
model [33], respectively, 0.5 kN and 1.0 kN. These beams will be referred to as SW CYCL MPa
model [33], respectively, 0.5 kN and 1.0 kN. These beams will be referred to as SW CYCL 1.0 and
1.0 MPa
SW CYCL 2.0 MPa. Similar to the coupons, the typical hysteresis curve
and SW CYCL 2.0 MPa. Similar to the coupons, the typical hysteresis curve was analyzed by was analyzed by comparing
some fatigue
comparing someparameters. The cycle stiffness
fatigue parameters. The cycle and the dissipated
stiffness and the energy
dissipatedwereenergy
calculated
weresimilarly
calculatedas
explained in Section 3.1.
similarly as explained in section 3.1.
Theevolution
The evolutionof ofthe
thestiffness
stiffnessand
andthethedissipated
dissipatedenergy
energyshow
showthe thesame
sametrends
trendsasasfor
forthe
thecoupons.
coupons.
The stiffness and the dissipated energy evolved in the opposite direction
The stiffness and the dissipated energy evolved in the opposite direction and directly linked to and directly linked tothe
the
formation of cracks. For uncracked specimens, they remained constant (Figure
formation of cracks. For uncracked specimens, they remained constant (Figure 15 a). The occurrence 15a). The occurrence
ofaacrack
of crackwaswasaccompanied
accompaniedby byaadrop
dropin instiffness
stiffnessand andaajump
jumpin indissipated
dissipatedenergy,
energy,asaswas
wasseen
seenfor
for
sample SW CYCL. 2.0 MPa A at cycle 93.000
sample SW CYCL. 2.0 MPa A at cycle 93.000 in Figure 15 b. in Figure 15b.
Overall, fewer cracks were observed for the sandwich bending tests (Table 9) compared to the
coupon uniaxial tensile tests. A possible reason for this was the different anchorage length in the
different configurations. When applied in the sandwich beam, the textile was embedded over a longer
length in the matrix, leading to a better anchorage. In addition, the presence of the insulating core
could have had a beneficial effect, the bond between the EPS-core and the TRC faces restricted the
crack widths.You can also read