AC/DC hybrid distribution system concept
←
→
Page content transcription
If your browser does not render page correctly, please read the page content below

VTT-R-06033-14

AC/DC hybrid distribution system
concept
Authors:           Riku Pasonen

Confidentiality:   Public
RESEARCH REPORT VTT-R-06033-14
                        2 (35)
RESEARCH REPORT VTT-R-06033-14
3 (35)
Preface
This work was carried out in the Smart Grids and Energy Markets (SGEM) research programme, coordinated by
CLEEN Ltd, with funding from the Finnish Funding Agency for Technology and Innovation, Tekes. The purpose of
this work is to investigate a hybrid AC/DC distribution system concept.RESEARCH REPORT VTT-R-06033-14
4 (35)
Contents
Preface................................................................................................................................... 2
Contents ................................................................................................................................. 4
1. Introduction ....................................................................................................................... 5
2. Hybrid LV distribution system concept ............................................................................. 5
2.1 Technical requirements and limitations ..................................................................... 5
2.2 Operational modes ................................................................................................... 6
3. Simulation model .............................................................................................................. 8
3.1 Simulation model main components ......................................................................... 8
3.1.1 Grid connection model .................................................................................. 8
3.1.2 Inverter ......................................................................................................... 9
3.1.3 Synchronization system .............................................................................. 11
3.1.4 DC/DC converter......................................................................................... 12
3.1.5 Energy storage ........................................................................................... 13
3.1.6 PV production ............................................................................................. 14
3.1.7 Loads and distribution line .......................................................................... 15
4. Simulation cases ............................................................................................................. 15
4.1 System functionality test simulation ........................................................................ 15
4.2 Simulations to study power capacity limits .............................................................. 17
4.2.1 AC system only ........................................................................................... 17
4.2.2 Hybrid system with symmetric AC load ....................................................... 18
4.2.3 Hybrid system with 5% voltage rise on neutral ............................................ 19
4.2.4 Hybrid system with AC unbalance ............................................................... 20
4.3 DC voltage adjusted to peak value of AC voltage ................................................... 21
4.3.1 Hybrid system, 90 kW symmetric AC, 5% voltage rise on neutral ............... 21
4.3.2 Hybrid system, 90 kW symmetric +10 kW single phase AC, 5% voltage rise
on neutral .................................................................................................... 22
4.3.3 Hybrid system maximum power with 325 V DC voltage .............................. 23
4.4 Fault simulations ..................................................................................................... 23
4.4.1 Over-current protection AC part of the concept ........................................... 23
4.4.2 Over-current protection DC system ............................................................. 26
4.4.3 Overvoltage protection ................................................................................ 27
4.4.4 Combined neutral conductor fault simulations ............................................. 28
5. Results............................................................................................................................ 31
6. Conclusions .................................................................................................................... 32
References ........................................................................................................................... 32RESEARCH REPORT VTT-R-06033-14
5 (35)
1. Introduction
At the end of 19th century, alternating current (AC) and direct current (DC) systems were
fighting for the position of dominant electric transmission system. AC systems won the battle
then, but the importance of DC electricity has increased in energy production with the rise of
photovoltaic panels which output DC. DC transmission is also used today in long-distance
high-voltage cables, such as transmission cables on the floors of oceans.
The integration of renewable energy production and energy storages into power grids is a
common research topic. What makes this demanding is that most of PV production is
installed in an LV distribution system. One option for making this easier is to change LV
distribution to DC and convert the voltage to AC at the customer premises. This publication
investigates a further option, namely a concept for integrating a low voltage direct current
system (LVDC) into current LVAC distribution systems to form a hybrid transmission system.
The concept presented here also enables microgrid operation. Microgrids are electric power
systems that can operate independently from main distribution systems by having their own
production units and power quality control devices.
2. Hybrid LV distribution system concept
The defining factor of the AC/DC hybrid distribution concept presented here is use of the
neutral wire to transmit DC current along with the asymmetric component of three-phase AC
current. The result is a system with one less wire compared to two separate AC and DC
systems. This will naturally increase the load on the neutral wire, so DC injection to the
neutral conductor must be limited when the AC system requires more of the capacity. Figure
2.1 represents the general concept of the hybrid AC/DC distribution system.
Figure 2.1. Hybrid AC/DC distribution system concept. Based on the figure presented in [1].
2.1 Technical requirements and limitations
To enable use of the neutral wire for the combined DC and asymmetric component of AC
current, the converter in question must have galvanic isolation on the DC side so that
simultaneous operation of the DC and AC system is possible in the manner presented in
Figure 2.1. Without galvanic isolation, the converter would create a short circuit. Control of
the converter must be capable of operation in island mode if uninterruptable power supply is
needed for the AC or DC side. DC should be able to operate independently if there is a fault
in the AC system and vice versa. DC power capacity is clearly limited and variable, with the
room available in the neutral conductor for DC current dependent on the status of the AC
system. Although dimensioning of the neutral conductor sets the limit for maximum available
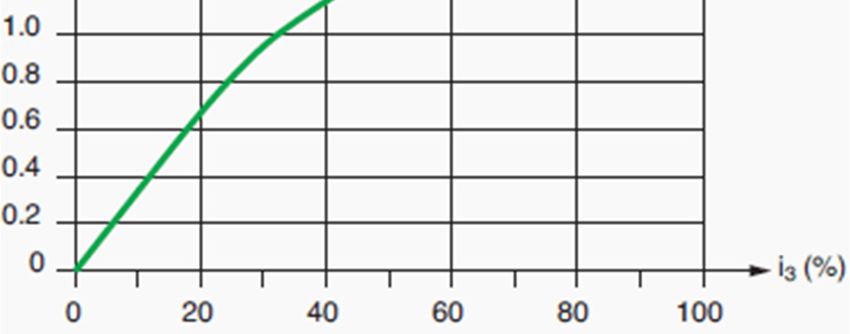
DC power in a symmetric AC load situation, capacity is also affected by the 3rd harmonic.
Figure 2.2 displays maximum current in a neutral conductor with respect to the 3rd harmonic
in the phase conductor.RESEARCH REPORT VTT-R-06033-14
6 (35)
Figure 2.2. Maximum current in the neutral conductor with respect to 3rd harmonic
percentage in a three-phase AC system. [2]
It can be seen from the figure that the 3rd harmonic greatly affects the neutral current, and
would also take capacity from the DC current in the examined concept.
2.2 Operational modes
One of the main targets of the hybrid distribution concept is to achieve a system capable of
operating in many different situations with respect to fault location. The following figures
represent these modes. The green shapes represent parts that are functioning, and the red
shapes the parts that are faulty or disconnected because of a fault. Figure 2.3 displays the
system in normal operation.
Figure 2.3. Parallel operation with AC grid. "Normal operation mode"
In normal operation mode, both systems operate in parallel. Control modes depend on how
the system is to be used. On a general level, the inverter operates in power control mode,
and the DC side in voltage control mode. Figure 2.4 displays the system with external faults.RESEARCH REPORT VTT-R-06033-14
7 (35)
Figure 2.4. Failure in the external grid connection. "AC/DC microgrid operation"
The system should be able to continue to operate for some period after a fault occurs in the
external grid. This can be described as AC/DC microgrid operation. Figure 2.5 displays the
system with AC distribution faults.
Figure 2.5. Failure of the entire AC system." DC microgrid operation"
The whole AC system could be faulted, the DC part then operating as a microgrid (assuming
the fault not to be in the neutral part of the AC system). Figure 2.6 displays the system with
DC system faults.
Figure 2.6. Failure in the DC system. "AC system operational"
Similarly, faults on the DC side should not affect operation of the AC system, and the DC
system should be capable of shutting down safely in a fault situation.RESEARCH REPORT VTT-R-06033-14
8 (35)
3. Simulation model
The simulation model built for the task was made using a PSCAD transient simulator,
developed by the Manitoba HVDC Research Centre. PSCAD can be used in transient
simulation studies for accurate calculation of instantaneous values of currents and voltages
in AC and DC systems. Version X4 of the program was used in this model.
3.1 Simulation model main components
The upper layer of the simulation model is presented in Figure 3.1.
Figure 3.1. Principle representation of the upper layer of the simulation model
A detailed screen capture of the model in PSCAD is displayed in Appendix A. Individual parts
of the model are described in detail in the following chapters.
3.1.1 Grid connection model
The grid connection is modelled with the ideal connection to the system. The choice of ideal
connection (only 0.002 ohm resistance) is because of the need only to investigate voltage
deviations caused by the LV system. Figure 3.2 displays the grid connection in the model.
50.0
angle
0.42 * V F Ph
0.002 Fault BRK1
A
V
Fault
Figure 3.2. Grid connection model
In addition to the normal voltage source model, one breaker is added to act as a fault and
another breaker to act as a protection device for the line. Voltage is also driven to zero during
the fault. This is because opening the breaker does not actually remove the connection but
inserts large resistance into the line. This could affect simulation accuracy when the breaker
is open and the phase angle is measured close to the breaker.RESEARCH REPORT VTT-R-06033-14
9 (35)
3.1.2 Inverter
The inverter is needed for converting the DC current to AC. The inverter is configured to
operate in power control mode when the AC grid has no fault, and in voltage control when
supplying an isolated microgrid. Figure 3.3 displays the outer layer of the inverter simulation
block and signal inputs and outputs.
Figure 3.3. Inverter simulation block outer layer and external connection point
In addition to voltage connection points, there is output for phase difference stats ( sync ok),
protection relay status (protection), input for control mode selection and external input for
voltage measurement from the grid side of the synchronisation relay. Figure 3.4 displays the
circuit diagram of the inverter bridge and LCL filter.
Figure 3.4. Circuit diagram of the inverter bridge and LCL filter.
The basic configuration of the inverter is based on that presented in [3]. The inverter control
system has separate controls for grid connected operation and microgrid island operation.
Figure 3.5 presents the control logic when in grid connected mode.RESEARCH REPORT VTT-R-06033-14
10 (35)
Figure 3.5. Inverter control for grid connected mode. A larger figure is presented in Appendix
B.
In grid connected mode, the inverter is controlled so that voltage between the inverter and
the DC/DC converter remains constant. This also keeps the battery state of charge (SOC) at
an approximate constant. In a more sophisticated control method this mode could be
adjusted to give direct control of the SOC. Figure 3.6 displays the inverter control logic in an
islanded microgrid.
Figure 3.6. Inverter control logic in a microgrid
As mentioned previously, the inverter operates in voltage control mode when feeding the AC
system during faulted supply from the upstream grid. The logic was created to control voltage
with two PI controllers. This type of control can also be called single-loop control [4]. Voltage
is measured and converted to a DQ system. Equation 1 displays the method of conversion of
instantaneous values of phase voltages.RESEARCH REPORT VTT-R-06033-14
11 (35)
Equation 1. Conversion of phase voltages to a DQ system [5]
2π 4π
cos(φ ) cos(φ −
3
) cos(φ −
3
)
U D Ua
2 2π 4π
U Q = 3 − sin(φ ) - sin(φ −
3
) - sin((φ − ) Ub
3
U Uc
0
1 1 1
2 2 2
The phase angle in the transformation matrix is locked to phase “a” of the grid. PI controllers
in both control systems are driven to zero when not used. Output signals would wander too
far from the right setting if the unused control system remained active when switching to
alternative control. In practice this would introduce current spikes when switching the control
logic. Current references in the DQ system for power control can be calculated using the
following equations.
Equation 2. Calculation of current reference using DQ voltages for active power (P)
2⋅P
id _ ref =
3 ⋅ Ud
Equation 3 Calculation of current reference using DQ voltages for reactive power (Q)
2⋅Q
iq _ ref =
3 ⋅ Ud
3.1.3 Synchronisation system
There are basically two ways of synchronising the generator to the AC system. Traditionally,
the power generator frequency is driven close to the grid frequency, but with a deliberate
small difference retained. This ensures that phase angles of the grid and device cross at
some point in time. At this exact moment, the synchronisation relay closes and the generator
is connected to the grid. The frequency difference nevertheless causes a short power spike
when the generator is forced to accelerate or slow down to the grid frequency. Another
option is to lock the frequency of the converter to the grid frequency, and adjust the phase
angle to match the grid phase angle exactly. In theory, this method would not produce a
power spike at synchronisation. The latter option is used in this model. Figure 3.7 displays
the main part of the implementation of synchronisation in the model.RESEARCH REPORT VTT-R-06033-14
12 (35)
Synchronisation A
2.0 Ctrl = 1
Controller that adjusts signal generator
angle. Controller is driven to zero when
Theta
Angle B
outside grid is down D + - Resolver Pdif
Ctrl
* A F
Ctrl = 1
Pdif -1 Theta2 brk1 difference to
Converts angle
P
B
degrees
0.0
[ brk1 ] Ctrl I
A go signal locks
Ctrl = 0
signal generator
qo B
S/H S/H ao
in out in out Ctrl
hold hold
qo qo
qo
0.0
A Ctrl = 1
ok
S
Wait For A d/dt
0.5 B [ ok ]
ok 0.15 [s] ok
Ctrl
B Compar-
| X| ator
Pdif brk1
Figure 3.7. Main part of the model’s synchronisation system
The synchronisation system measures an angle difference and converts it to degrees for the
PI controller. The controller adjusts the phase angle of the signal generator used for making
the reference signal for the inverter. Phase angle control is locked when the system operates
as an island and the external grid is down.
3.1.4 DC/DC converter
The DC/DC converter in the concept is in charge of keeping DC voltage constant in the DC
distribution line. Figure 3.8 displays the symbol for the converter module in the model.
Bidirectional isolated
DC/DC converter
HV_plus LV_plus
HV_minus LV_minus
Udc
Figure 3.8. Bidirectional DC/DC converter with galvanic isolation
The converter layout is that of a bidirectional flyback converter. Galvanic isolation is achieved
using transformer coils inside the converter. The converter design was presented in [1].
Figure 3.9 displays the principle circuit diagram of the converter.RESEARCH REPORT VTT-R-06033-14
13 (35)
Figure 3.9. Principle circuit layout of the converter [1]
The converter is controlled in voltage control so that it keeps voltage constant at the DC bus.
The converter control has individual controls for both power directions. Figure 3.10 illustrates
the model’s control logic implementation.
Figure 3.10. Control logic of the DC/DC converter [1]
The control operates by measuring voltage error and generating a current reference with the
PI controller. The current reference is compared to the measured current, and the difference
fed to a hysteresis generator which controls the actual power electronic switches. The control
mode is selected by measuring which way voltage error occurs. This selection is presented
in Figure 3.11.
Figure 3.11. Control mode selection
The actual selection is made with a PI controller which improved the stability of the control
mode selection signal.
3.1.5 Energy storage
A lead acid battery was chosen as energy storage for this model. The model is based on the
CIEMAT model which was used in simulations in [6]. The model has different output voltage
equations for discharge, charge, and overcharge situations. The reference product for the
model is STECO Saphir 3600, the parameters of which have also been validated in [6]. An
in-depth description of the battery component model can be found in [3].RESEARCH REPORT VTT-R-06033-14
14 (35)
3.1.6 PV production
PV production is modelled to be connected to a DC bus. The PV panel model is based on
what was presented in [7]. The model was made with a single equation and current source.
Equation 4 displays the equation.
Equation 4
To simplify the equation the following renaming can be used,
Equation 5
= 1 − × −
This can be modified to operate as a voltage source type by solving voltage (V) with respect
to current (I)
Equation 6
= +
This voltage source version is used in the model. To model a large array of panels, Voc,
Vmin and Isc were multiplied to reflect configuration of multiple panels in series and in
parallel. Figure 3.12 displays the PV module simulation block in the PSCAD program.RESEARCH REPORT VTT-R-06033-14
15 (35)
temp up
25.0
Temperature
ir um
g
Figure 3.12. PV panel simulation block
Input signals for the block are solar radiation (ir) and temperature of the panel (temp). The
PV module block was used in the model to test bidirectional capability of the DC/DC
converter.
3.1.7 Loads and distribution line
Loads are modelled with three- and single-phase load models found from the PSCAD main
library. In practice, three-phase load is star-connected impedance. The value of impedance
is calculated from the nominal voltage value and from the given power set point of the user.
Single-phase load is similar, but impedance is connected between one phase and neutral.
The distribution line is modelled as two 185 mm2 aluminium conductors in parallel. The
length is set to 2 km. Lines are modelled with standard single-phase coupled PI sections
found in the PSCAD main library. Table 1 has a list of the parameters used for the line
model.
Table 1. Parameters for the AC line model (calculated for two Al 185 parallel lines from [8])
The neutral line is assumed to have the same parameters as the phase conductors. Due to
the inverter, the AC system also has a 200 kVA isolation transformer to create a true neutral
for the system.
4. Simulation cases
Simulation cases are for the most part performed as comparisons with and without a hybrid
distribution system. In addition to these studies, one simulation is carried out to verify the
desired operation in an AC grid fault.
4.1 System functionality test simulation
In this test, the system is first started and normal operation continued parallel with the
external grid. A fault in the AC system will occur at 0.6s of simulation time, after which the
system is separated from the faulty external AC grid. At the same time as the system is
switched to islanded operation mode, the control mode is changed to voltage control of the
AC side of the distribution system. The fault is cleared from the external grid at 1.5 s of
simulation time. The system then adjusts the voltage angle to match the grid. When voltage
angle and frequency are equal, the system is again synchronised to the external AC grid.
The load on the AC side is set as symmetric 100 kW. The DC system has only a PV panel
producing 1.6 kW of power. Figure 4.1 displays the three-phase AC voltages in per unit
values (1.0 equates to 400 VAC).RESEARCH REPORT VTT-R-06033-14
16 (35)
Main : Graphs
Uload AC Ufeed AC
1.20
1.10
1.00
0.90
0.80
0.70
x 0.00 0.25 0.50 0.75 1.00 1.25 1.50 1.75 2.00 2.25
Figure 4.1. Measured voltages at the start (green) and end (blue) of the distribution line in
per unit values with nominal voltage (1.0) of 400 V.
The first dip and spike in the figure is the point in time when the fault occurs in the AC supply
and the system is switched to operate as an island. The second spike at 1.5 s occurs when
the voltage angle is adjusted to match the external grid when the fault is cleared. At 2.0 s the
system is again synchronised to the external grid. The voltage spike due to angle adjustment
can be minimised with slower control. Here the simulation period is quite short, and control is
fast. A closer look at the voltage after the 400 V/400 V isolation transformer during the fault
and islanding is presented in Figure 4.2.
Main : Graphs
U2a U2b U2c U2n
400
300
200
100
0
-100
-200
-300
-400
x 0.5900 0.5950 0.6000 0.6050 0.6100 0.6150
Figure 4.2. Shape of the voltage (V) when the operation mode is changed
The transformer smooths the noise from the voltage produced by the inverter. The voltage
sag length depends on how fast the loss-of-mains protection can work. Here it would be ideal
to view the performance of the converter control. The power output of the inverter is
presented in Figure 4.3.RESEARCH REPORT VTT-R-06033-14
17 (35)
Main : Graphs
Pinv Qinv
120
100
80
60
40
20
0
-20
x 0.25 0.50 0.75 1.00 1.25 1.50 1.75 2.00 2.25 2.50
Figure 4.3. Power output of the inverter. Active power, kW (blue), reactive power, kVAr
(green)
The inverter is charging the battery before the AC fault. The inverter starts feeding the AC
load once the system is in island operation mode. There is a small change in power when the
voltage angle is adjusted to match the grid at 1.5 s (see same spot in Figure 4.1).
4.2 Simulations for studying power capacity limits
In this chapter of simulations the AC load is varied from symmetric to asymmetric, and
results with and without hybrid distribution are compared.
4.2.1 AC system only
Here symmetric AC load is set to 90 kW and single-phase load increased in one phase until
voltage sag in that phase is 10% of nominal voltage. 10 kW seems to be a limit for the
unbalanced load in this case. Figure 4.4 displays the corresponding phase voltages,
measured at the load connection point.
u2a u2b u2c
230.0
225.0
220.0
215.0
210.0
205.0
200.0
Figure 4.4. 50 Hz components of phase voltages (V) at the end of the lineRESEARCH REPORT VTT-R-06033-14
18 (35)
Voltage in phase with the single-phase load is 206.6 V. this means about a 10% difference
from the 230 V nominal value. The unbalanced load also causes a rise in the neutral RMS
voltage. This is presented in Figure 4.5.
Main : Graphs
U2n
6.460
6.440
6.420
6.400
6.380
6.360
6.340
6.320
6.300
x 0.260 0.300 0.340 0.380
Figure 4.5. RMS neutral-to-ground voltage (V) at the end of the line
The RMS value of neutral-to-ground voltage is 6.36 V RMS. This means peak-to-peak
variation in neutral is about 18 V (2 ∙ 6.36 ∙ √2=18.0 V).
4.2.2 Hybrid system with symmetric AC load
In this case, the symmetric AC load is the same 90 kW, but now the 10 kW additional load is
connected to a DC bus instead of to the AC phase. Figure 4.6 displays phase voltages at the
end of the line, while Figure 4.7 displays RMS voltage rise in neutral.
Main : Graphs
u2a u2b u2c
220.900
220.850
220.800
220.750
220.700
220.650
x 1.3000 1.3100 1.3200 1.3300 1.3400 1.3500
Figure 4.6. 50 Hz components of phase voltages (V) at the end of the lineRESEARCH REPORT VTT-R-06033-14
19 (35)
Main : Graphs
U2n
6.0580
6.0570
6.0560
6.0550
6.0540
6.0530
6.0520
x 0.400 0.440 0.480 0.520 0.560
Figure 4.7 RMS neutral-to-ground voltage (V) at the end of the line
Comparing the two results, asymmetric AC load creates large differences between phase
voltages, and also a slightly higher rise in neutral-to-ground voltage compared to the hybrid
system. The SFS-EN 50160 standard states that line and line-to-line voltages must for 95%
of the time be between ±10% of nominal and always within +10% and -15% for normal power
quality. This would mean that when voltage drops due to asymmetric AC load, half of the
voltage drop would be caused by the neutral conductor, assuming equal line and neutral
conductors. The next simulation therefore targets a 5% voltage drop in the neutral conductor
due to DC current as the maximum DC power allowed in the hybrid system.
4.2.3 Hybrid system with 5% voltage rise in neutral
In this case, the AC system has a 90 kW symmetric star-connected load. DC load is adjusted
until there is a 5% (11.5 V) voltage rise in neutral-to-ground to find out the maximum DC
power value when neutral voltage is the limiter. Figure 4.8 displays a neutral-to-ground
voltage rise of 11.5 V, while Figure 4.9 displays the DC power at this voltage rise limit.
Main : Graphs
U2n
11.520
11.510
11.500
11.490
11.480
11.470
11.460
x 1.500 1.510 1.520 1.530 1.540 1.550 1.560
Figure 4.8. Neutral-to-ground voltage (V) at end of the lineRESEARCH REPORT VTT-R-06033-14
20 (35)
Main : Graphs
Pdc
19.0100
19.0080
19.0060
19.0040
19.0020
19.0000
18.9980
18.9960
18.9940
x 0.440 0.460 0.480 0.500 0.520 0.540 0.560 0.580 0.600
Figure 4.9. DC load power (kW)
The DC system allows 9 kW more power compared to a case where there is 90 kW of
symmetric load and 10 kW of single-phase load. Interestingly, if there is a symmetric load of
150 kW on the AC side, the neutral line can take 21.3 kW of DC current at 11.5 V RMS limit,
which is more than with the 90 kW AC load. The reason for this is that the DC and AC
systems are connected from the star point. With the delta AC load there is not this kind of
effect.
4.2.4 Hybrid system with AC unbalance
In this simulation base, the setup is the same as in the first simulation: 90 kW symmetric star-
connected load and 10 kW single-phase load (at c-phase). In addition to these, the maximum
amount of DC load is used until neutral-to-ground voltage rises to 11.5 V (RMS). Figure 4.10
displays the DC power measured from simulation using 50 Hz RMS measurement (green)
and by multiplying current and voltage (blue).
Main : Graphs
Pdc Pdc_rms
17.80
17.60
17.40
17.20
17.00
16.80
16.60
16.40
16.20
16.00
15.80
x 1.560 1.580 1.600 1.620 1.640 1.660 1.680 1.700 1.720
Figure 4.10. DC load power kW. Blue is calculated by multiplying current and voltage and
green measured with a 50 Hz RMS meter.RESEARCH REPORT VTT-R-06033-14
21 (35)
The difference in the power curves results from the fact that the AC system is creating a
50 Hz fluctuation in neutral-to-ground voltage. Figure 4.11 displays this fluctuation in DC
voltage.
Main : Graphs
Udc
233.0
232.0
231.0
230.0
229.0
228.0
227.0
x 3.380 3.400 3.420 3.440 3.460
Figure 4.11. 50 Hz fluctuation in DC voltage (V)
Voltage fluctuation in the DC line is minimal in the figure and would cause no problems with
DC loads.
4.3 DC voltage adjusted to the peak value of AC voltage
The DC voltage level and the peak value of AC voltage are considered comparable in terms
of electrical safety and also when classifying the low voltage limit as 1000 VAC or 1500 VDC
(√2 ∙ 1000 = 1414 . [9] From this point of view, DC voltage could be 325 V in this kind of
hybrid concept if there is a standard 230 V in the AC system. Of course, the LV definition
allows much higher voltages, but the voltage level must also be compatible with devices.
Should the DC voltage level be too high for most devices, we could use medium DC voltage
instead if there is in any case a need for more conversions. In theory, most power electronic
single-phase AC devices can also be used with DC voltage when the voltage level is 156 V–
325 V, with 156 V being the peak value of the 110V LV system and 325 V the same value for
the 230 V LV system. Nowadays most devices have universal power supplies capable of
operating with 50 Hz and 60 Hz systems, and therefore with both voltage levels. DC voltage
would simply pass the rectifier section of the single-phase AC device. There can be problems
with some active rectifiers, however.
4.3.1 Hybrid system, 90 kW symmetric AC, 5% voltage rise in neutral
In this case, the AC system has a 90 kW symmetric star-connected load. DC load is adjusted
until there is a 5% (11.5 V) voltage rise in neutral-to-ground to establish the maximum DC
power value when neutral voltage is the limiter. The result is 23.2 kW of DC using a 325 V
DC voltage level. Figure 4.12 displays measured DC power.RESEARCH REPORT VTT-R-06033-14
22 (35)
Main : Graphs
Pdc Pdc_rms
26.950
26.925
26.900
26.875
26.850
26.825
26.800
26.775
26.750
x 0.960 0.970 0.980 0.990 1.000 1.010 1.020
Figure 4.12. Measured DC power at an 11.5 V neutral-to-ground RMS limit
The DC power limit in this case is about 26.85 kW. This result could be predicted by
comparing results with 230 V DC and taking account of a 41.3% increase in voltage, which
means current can be raised 41.3% for the same voltage drop. ( 19 $% ∗ 1.413 = 26.847 $%)
As with 230 V voltage, DC power can be also increased when symmetric AC power is
increased to 150 kW. DC power limit in this case is 30 kW.
4.3.2 Hybrid system, 90 kW symmetric +10 kW single-phase AC, 5% voltage rise in
neutral
Here the case is the same as the previous one, but now there is 10 kW additional single-
phase load.
Main : Graphs
Pdc Pdc_rms
24.00
23.75
23.50
23.25
23.00
22.75
22.50
22.25
22.00
21.75
x 1.200 1.220 1.240 1.260 1.280 1.300 1.320
Figure 4.13. DC power (kW) when neutral has risen to 11.5 V RMS
Adding the 10 kW single-phase load decreased DC capacity by 3.6 kW, from 26.85 kW to
23.25 kW.RESEARCH REPORT VTT-R-06033-14
23 (35)
4.3.3 Hybrid system maximum power with 325 V DC voltage
Here the total hybrid system capacity is tested when DC voltage is 325 V and AC load 90 kW
symmetric and 10 kW single-phase. This capacity is found by adjusting AC load power to a
point where the voltage drop is 10% on phase voltage, and by adjusting DC power until the
RMS voltage rise in neutral-to-ground voltage is 11.5 V. Figure 4.14 displays the neutral-to-
ground RMS voltage.
U2n
11.560
11.540
11.520
11.500
11.480
11.460
11.440
11.420
11.400
11.380
11.360
Figure 4.14. Neutral-to-ground RMS voltage (V)
Neutral-to-ground voltage has a fluctuation which results from fluctuating DC voltage. The
DC/DC converter output varies and creates fluctuation in the DC load, modelled with a
resistor. Figure 4.15 displays the DC load power.
Pdc Pdc_rms
30.80
30.60
30.40
30.20
30.00
29.80
29.60
29.40
29.20
29.00
Figure 4.15. DC system power when neutral has risen to 11.5 V RMS (kW)
The same variation mentioned previously also appears in load power measurement.
4.4 Fault simulations
4.4.1 Overcurrent protection for the AC part of the concept
Overcurrent protection protects system devices and conductors from continuous power
overloads over nominal power capacity which could cause damage to the system or to
individuals. Short-circuit faults cause much higher currents, and voltage supply to these
faults must be removed much more rapidly.RESEARCH REPORT VTT-R-06033-14
24 (35)
According to the SFS-6000-4-43 standard [10], thermal limits in seconds can be calculated
by:
Equation 7
*
√) = $ ×
Where, t = maximum time in seconds, S = cross-cut area of conductor in mm2, k-factor
dependent on wire type, and I = RMS value of current. According to SFS-6000-4-43, factor k
for Al 185 with PVC insulation is 76. [10]
Maximum short-circuit current is achieved when there is a three-phase short circuit in the
strongest part of the system. In this case it is behind the isolation transformer, when the
inverter is assumed to be connected straight to the transformer and a fault between the two
would be considered. Figure 4.16 displays RMS currents in short circuit in this locations.
ia ib ic
5.0
4.0
3.0
2.0
1.0
0.0
Figure 4.16. RMS short-circuit currents (kA) in three-phase fault at point after transformer
The peak value of the RMS fault current is 4.7 kA in the figure. By calculating t from Equation
7 we get 8.95 s. Although this is quite easy to achieve even with fuse protection, overcurrent
relay protection is needed because the system is also designed to allow it to be fed from the
inverter. Maximum AC power for symmetric load was 150 kW from the previous simulations,
equating to 216.5 A of current. From the point of view of inverter protection, the inverter
controls the maximum current allowed internally. Due to capacity constraint, the inverter
cannot output high short-circuit current for a long period. In a study and test carried out by
NREL [11], the maximum short-circuit current was 2 to 3 times the nominal peak value, while
duration times were from 1.1 ms to 4.25 ms. The peak value of the current in a system with
nominal power of 150 kW is 306 A. With the multiplier 3 (indicated by [11]), this would mean
a maximum short-circuit current peak value of 919 A.
Overcurrent protection simulation
An OC relay with two triggering rules is used, the low setting of 210 A and 2 s and high
setting of 215 A and 20 ms being the settings for tripping. The first test is performed without
protection to see how much the preliminary inverter model built to PSCAD can output. The
test is the same as in Figure 4.16, except that now the current is supplied by the inverter and
not by an external grid connection.RESEARCH REPORT VTT-R-06033-14
25 (35)
Main : Graphs
ia ib ic
0.70
0.60
0.50
0.40
0.30
0.20
0.10
0.00
x 0.40 0.50 0.60 0.70 0.80 0.90 1.00 1.10 1.20 1.30
Figure 4.17. Short-circuit current (kA) RMS value supplied by the inverter
The internal control logic here is set to limit current components + and , individually to
300 A. It can be seen in the figure that this limiting does not work very well, as the current
peaks at the start. The peak value in the fault is 1.8 times the nominal current. An internal
limiter for total output current (instead of components) is added to the simulation in Figure
4.18.
Main : Graphs
ic ib ia
0.400
0.350
0.300
0.250
0.200
0.150
0.100
0.050
0.000
x 0.50 0.60 0.70 0.80 0.90 1.00 1.10
Figure 4.18. Internal limiter added to the inverter to limit total current to 0.3 kA RMS value
The RMS value of the current is limited internally to 300 A. This new type of internal limiter is
in use in the remaining simulations. Using this limiter and the relay settings mentioned,
protection can open the circuit breaker in 100 ms. This is presented in Figure 4.19.RESEARCH REPORT VTT-R-06033-14
26 (35)
Main : Graphs
ic ib ia
0.400
0.350
0.300
0.250
0.200
0.150
0.100
0.050
0.000
x 0.550 0.600 0.650 0.700 0.750 0.800
Figure 4.19. Current during a fault where the circuit breaker takes 100 ms to operate. Fault
current (kA)
Operation time would naturally be shorter if there was higher load before the fault. If the fault
is located at the end of the line there is the following fault curve, presented in Figure 4.20.
Main : Graphs
ia ib ic
0.300
0.250
0.200
0.150
0.100
0.050
0.000
x 0.560 0.600 0.640 0.680 0.720 0.760
Figure 4.20. Three-phase fault current at the end of the line in the model (kA)
Although the fault current is lower, the fault still is registered in the relay’s range of high
setting.
4.4.2 Overcurrent protection for the DC system
As the PSCAD main library and project-related library lack comprehensive models for DC
circuit breakers and relays, the DC overcurrent protection studies here are conducted solely
by inspecting voltage and currents with different faults. An ideal circuit breaker could, of
course, be used, but this would not really give any meaningful information. A model of a DC
protection relay would therefore be a good thing to have in the future. The main difficulty in
breaking DC current vs. AC current is that where current changes polarity there is no point at
which opening of the breaker can be achieved without much effort. This means that as there
is current flowing in at the time of the circuit breaker operation, an electrical arc will formRESEARCH REPORT VTT-R-06033-14
27 (35)
forces in the contact gap that will try to prevent it from opening. Figure 4.21 displays the
short-circuit current of the DC system when 0.01 ohm resistance is inserted to model the
fault between the lines.
BiDi_isolated_1 : Graphs
Io
1.40
1.20
1.00
0.80
0.60
0.40
0.20
0.00
-0.20
x 0.80 1.00 1.20 1.40 1.60 1.80
Figure 4.21. Short-circuit current on the DC side without internal current limiting (kA)
No internal current limiting is enabled in the simulation presented in Figure 4.21. Realistically,
there is always an internal current limiting device. Figure 4.22 displays the short-circuit
current when the DC/DC converter has internal current limiting set to 100 A.
Main : Graphs
Idc
1.20
1.00
0.80
0.60
0.40
0.20
0.00
-0.20
x 0.80 1.00 1.20 1.40 1.60 1.80 2.00
Figure 4.22. Short-circuit current in the DC system with internal current limited to 0.1 kA
The peak value of the current is still the same because the limiter is simply a programmed
limiter. In this way it is impossible to prevent the spike when low resistance is inserted into
the line with a normal voltage level.
4.4.3 Overvoltage protection
According to the SFS-6000 standard, overvoltage protection is required in places in Finland
where there are 25 or more days with thunder. Overvoltage caused by disconnection of
generators and loads is usually lower and therefore covered by the protection forRESEARCH REPORT VTT-R-06033-14
28 (35)
atmospheric-derived overvoltage. Overvoltage resilience requirements for 50 Hz overvoltage
for devices in a low voltage system are as follows:
-. + 250 , ) > 52
-. + 1200 , ) < 52
For impulse-type faults (lightning, etc.) resilience requirements vary depending on the
overvoltage resilience class (1 to 4).Table 2 displays these as presented in the SFS-6000
standard (in Finnish).
Table 2. Impulse voltage resilience requirements for different equipment classifications
Overvoltage protection is required for generators, however. The EN 50438 standard which
applies to units under 50 kVA in Finland states that protection acts in 0.2 s when voltage is
over 10% or under 15% of nominal. The DC system in this concept falls into this category
with a maximum power of 21.3 kW with 230 V voltage and 30 kW with 325 V. The maximum
capacity of the AC system in the concept is 150 kW, which means protection for which the
settings would have to be configured case by case according to recommendations from
Finnish Energy Industries [12].
4.4.4 Combined neutral conductor fault simulations
The combined neutral and DC conductor is the main component of the concept, and
therefore critical for operation. In this chapter, neutral faults are simulated to see the kind of
problems that arise. In the test, the AC side is loaded with 90 kW symmetrically and with
10 kW single-phase load. The DC-side load is 16.6 kW. Conditions are therefore the same
as in 4.2.4.
Combined neutral conductor breaks from grounding point
Figure 4.23 displays the DC-side voltages when the combined neutral conductor is
disconnected from the grounding point at the AC distribution transformer at 1.0 s of
simulation time.RESEARCH REPORT VTT-R-06033-14
29 (35)
Main : Graphs
uplus U2n_pure Udc
300
250
200
150
100
50
0
-50
x 0.80 1.00 1.20 1.40 1.60 1.80 2.00 2.20
Figure 4.23. DC voltage, DC plus in respect of ground, and combined neutral voltage in
respect of ground [V]
Due to the asymmetric AC load, disconnecting of grounding will make neutral-to-ground
voltage fluctuate. The DC conductor is now broken and so cannot maintain stable DC voltage
across the terminals at the end of the line. The DC current actually now circulates through
the secondary side of the transformer, and the DC component is therefore also in line
voltages. Base frequency components of AC voltages are presented in Figure 4.24.
Main : Graphs
u2a u2b u2c
260
240
220
200
180
160
140
x 0.80 1.20 1.60 2.00 2.40
Figure 4.24. RMS base frequency components of AC line voltages
The effect would be much worse if AC in the model was delta type instead of wye (star).
Figure 4.25 displays the DC-side voltage when the AC load is delta type.RESEARCH REPORT VTT-R-06033-14
30 (35)
Main : Graphs
uplus U2n_pure Udc
400
300
200
100
0
x 0.60 0.70 0.80 0.90 1.00 1.10 1.20 1.30 1.40 1.50
Figure 4.25. DC voltage, DC plus with respect to ground, and combined neutral voltage with
respect to ground (V), when AC load is delta type.
Here the combined neutral-to-ground voltage rises to line voltage level. This can also be
seen from the AC-side RMS voltages displayed in Figure 4.26.
Main : Graphs
u2a u2b u2c U2n
400
350
300
250
200
150
100
50
0
x 0.60 0.80 1.00 1.20 1.40 1.60
Figure 4.26. RMS voltages at base frequency (V), when the AC load is delta type
All in all, suitable neutral conductor fault detection must be in use. Multiple point grounding
would help with the neutral voltage, but this would make fault currents flow in ground loops
and this could create hazardous voltages nearby [13]. One tripping rule could be the too-high
neutral-to-ground voltage and other presence of the DC component in neutral current
(measured from the distribution transformer). Neutral fault detection can also be aided as
presented in “Neutral fault management in LV network operation supported by the AMR
system” [14].RESEARCH REPORT VTT-R-06033-14
31 (35)
5. Results
The main focus in the study was on developing a concept and model around the idea of a
shared neutral conductor between AC and DC systems. The neutral conductor is unloaded
when there is a symmetric three-phase AC load. The idea was to find a use for this capacity
by injecting DC current into the neutral line. Focus in the actual simulations was on power
capacity, but microgrid operation was also tested successfully. All conductor lines in the
study were identical in order to enable identification of the difference between AC and DC
capacities. Table 3 displays a summary of the results.
Table 3 Summary of the results of capacity testing
Configuration AC system DC system Total capacity Limiting factor
AC only 90 kW three - 100 kW Voltage 10% sag
phase on the line with
+10 kW single single phase load
phase load
AC+DC (230 V) 90 kW symmetric 19 kW 109 kW Neutral RMS
symmetric voltage 11.5 V
AC+DC (230 V) 90 kW three 16.6 kW 116.6 kW Neutral RMS
unbalance phase voltage 11.5 V
+10 kW single
phase load
AC + DC (230 V) 150 kW three 21.3 kW 171.3 kW Voltage 10% sag
max power phase load on the line
voltages and
Neutral RMS
voltage 11.5 V
AC+DC (325 V) 90 kW symmetric 26.9 kW 116.9 kW Neutral RMS
symmetric voltage 11.5 V
AC+DC (325 V) 90 kW three 23.3 kW 123.3 kW Neutral RMS
unbalance phase voltage 11.5 V
+10 kW single
phase load
AC+DC (325 V) 150 kW 30.1 kW 180.1 kW Voltage 10% sag
max power symmetric and Neutral RMS
voltage 11.5 V
Simulations were performed with 230 V and 325 V DC voltages. The results indicate that
from the total system perspective it is more favourable for this hybrid concept to have DC
load than asymmetric AC load. By moving single-phase load to the DC side of the hybrid
system, load could be increased from 10 kW to 19 kW (230 V DC simulation). Without
removing the single-phase load, DC power could be 16.6 kW at the same time. The DC
system also responded well to increased symmetric load of the AC system. DC load power
could be increased 12% when symmetric AC load was increased 67% from 90 kW to
150 kW. The reason for this was the star-connected AC load model, and with delta-
connected AC load there was no change in DC capacity. Increased voltage level also
increased DC power capacity linearly, as can be expected from the DC power equation.
Fault simulations were also carried out in the study concerning three-phase short circuit,
short circuit in the DC system, and combined neutral breaking. Relay protection must be
used instead of fuses as the overcurrent capacity of the inverter is very limited.
Programmable limiting of the fault current was investigated on both the inverter side and the
DC side. Programmable limiting of the RMS fault current was more effective in reducingRESEARCH REPORT VTT-R-06033-14
32 (35)
short-circuit current spike with the AC system than with the DC system. In both cases,
limiting of steady overcurrent was very effective. Faults in the combined neutral and DC
conductor where also simulated with delta- and wye-connected AC loads. In both cases,
power quality was seriously affected due to asymmetric loading in the AC system. Delta-
connected load resulted in much worse power quality and voltage fluctuations compared to
wye-connected load. The fault was located at the distribution transformer, and thus DC could
continue to operate. Power quality was seriously affected with wye AC load, however, as
grounding of the neutral was lost (a separate PE conductor was assumed to be functional for
device protection). With delta AC load, AC voltage with the DC component was actually
introduced into the combined neutral conductor, and the power quality would therefore not be
acceptable. For these reasons, effective neutral fault detection is mandatory for the concept.
6. Conclusions
This study examined a hybrid AC/DC distribution concept. Simulations were carried out to
establish the technological feasibility of the concept and the performance with regard to
power capacities and fault scenarios. It can be concluded from the simulations that it is
technologically possible to combine with an AC distribution system using a joint neutral and
DC conductor. Power capacity increase by this method is, however, very limited, and varies
according to the asymmetric load on the AC side. Increase in symmetric AC load actually
increased capacity on DC system opposed to how asymmetric load affected the system. As
this study has been carried out from a purely technological perspective, an economic
analysis of possible scenarios would be needed to establish the competiveness of the
concept. Because capacity increases are quite modest, they cannot justify the use of this
kind of concept. A potential use case in mind is the increased reliability of a parallel DC
system providing backup power. The DC system could also be the point where critical loads,
such as computers and lighting are connected, and also a simpler way of connecting small-
scale generation. The use of DC sockets would be a simple way of differentiating system
loads which will be operational when the AC grid is down.
From the reliability and safety perspective, LVDC is a good option, but one that should be
built truly independently from the AC system, with no shared wire and “weak point”. In
Germany, small-scale generation can be as much as the nominal transformer capacity, but in
practice the limit is close to 70% due to voltage fluctuations on higher penetrations [15]. It is
clear that the hybrid concept as presented cannot accept the same amount of renewable
capacity if all of it is connected to a DC bus. However, the DC system could play a part in
solving the problem by balancing the variations with the DC bus, load control in DC loads,
and Var control at the inverter.
References
[1] Pasonen, R. Model of Bi-directional Flyback Converter for Hybrid AC/DC
Distribution. International Journal of Power Electronics and Drive Systems, Vol. 3,
No. 4, December 2013, pp. 444~449.
[2] Sizing and Protection of the Neutral Conductor. Electrical engineering portal EEP.
Available at : http://electrical-engineering-portal.com/sizing-and-protection-of-the-
neutral-conductor-1
[3] Pasonen, R. Energy centre microgrid model. VTT Technical Research Centre of
Finland. 2011. VTT Working Papers 182. 34 p. http://www.vtt.fi/inf/pdf/
workingpapers/2011/W182.pdfRESEARCH REPORT VTT-R-06033-14
33 (35)
[4] Green,T., Prodanovic, M. “Control of inverter-based micro-grids” Electric Power
Sys-tems Research, Volume 77, Issue 9, Distributed Generation, July 2007.
[5] Luomi,J. Sähkökoneiden muutosilmiöt 816 B. Otakustantamo. 1982.
[6] Gergaud, O., Rogib, G., Multon, B., Ben Ahmed, H. Energy modelling of a lead-
acid battery within hybrid wind/photovol taic systems. 2003. ENS Cachan, Bruz,
France.
[7] Peng, F. Z. Photovoltaic Module Model based on the Manufacturer Data Sheet.
Michican State University. Available at:
http://www.egr.msu.edu/pelab/projects/project%20pdf%20files/PV%20Module%2
0Model.pdf
[8] Reka cable values. Available at: http://www.reka.fi/eng/products/814
[9] Low voltage directive overview explained. Available at: https://cemarking.net/low-
voltage-directive/
[10] SFS 6000-4-43 Low-voltage electrical installations. Part 4-43: Protection for
safety. Protection against overcurrent. SESKO ry, electrotechnical standardization
association of Finaland.
[11] Keller, J., Kroposki, B. Understanding Fault Characteristics of Inverter - Based
Distributed Energy Resources. NREL technical report. 2010. Avaiable at:
http://www.nrel.gov/docs/fy10osti/46698.pdf
[12] Lehto, I. Technical appendix 2 Technical requirements concerning generation
installations of over 50 kVA. Finnish Energy Industries. 2011. Available at:
http://energia.fi/sahkomarkkinat/sahkoverkko/pientuotanto
[13] Zipse, D.,W., The Hazardous multigrounded neutral distribution system and
dangerous stray currents. Petroleum and Chemical Industry Conference 2003.
West Chester,USA .23 p. Available at:
http://ieeexplore.ieee.org/stamp/stamp.jsp?arnumber=1242596
[14] Mäkinen A, and others.Neutral fault management in LV network operation
supported by AMR system. Cired 22 nd International Conference on Electricit y
Distribution. Stockholm, 10-13 June 2013. Available at:
http://www.cired.net/publications/cired2013/pdfs/CIRED2013_1214_final.pdf
[15] Impact of photovoltaic generation on power quality in urban areas with high PV
population.2008 Germany. Available at
:http://www.pvupscale.org/IMG/pdf/WP4_D4-3_public_v1c.pdf34 (35)
RESEARCH REPORT VTT-R-06033-14
1-phase Line
umec
A A ia A A I_load_aA
0.2 [MVA]
BRKAC
ib B I_load_b
50.0
A B B B B A
#1 #2
1-phase Line
V V
angle C 0.4 [kV] C icC C I_load_c
C
0.422 *
V F Ph 0.4 [kV] 1-phase Line
P+jQ
0.002 fault BRK1 90 [kW]
1.2 [uF]
ie in
u1n 0.177 [ohm] 0.169 [mH]u2n
Appendix A: Representation of model in PSCAD
Power
0.0 command
ua ub uc
fault
Island inverter u2au2bu2c
BRK
Bi-directional isolated
A a DC/DC converter
udc_p
Idc
1.2 [uF]
b
uplus
B HV_plus LV_plus
A 0.177 [ohm]
0.169 [mH]
V
C c HV_minus LV_minus
in2
R
udc_m Udc
+
0.0
Qload plus Udc
minus
BRK1 uabc
ok cm
sync ok protection control mode u_gridRESEARCH REPORT VTT-R-06033-14
35 (35)
Appendix B: Control logic of inverter in grid connected modeYou can also read