TRANSIENT 3-D MODELLING OF CEILING FAN FOR ACHIEVING THERMAL COMFORT - ashrae
←
→
Page content transcription
If your browser does not render page correctly, please read the page content below
2018 Building Performance Analysis Conference and
                                                                         SimBuild co-organized by ASHRAE and IBPSA-USA
                                                                                                                Chicago, IL
                                                                                                     September 26-28, 2018

    TRANSIENT 3-D MODELLING OF CEILING FAN FOR ACHIEVING THERMAL
                              COMFORT
                                    Y. Anand1, S.K. Verma1 and S. Anand2*
           1. School of Mechanical Engineering, Shri Mata Vaishno Devi University, Katra, J&K, India
           2. School of Energy Management, Shri Mata Vaishno Devi University, Katra, J&K, India

                                                                       summer months, a fan working in the typical mode can
ABSTRACT                                                               diminish how cool you feel in a room by as much as
         In this study, our aim is to check, compare and               eight degrees, allowing you to raise the temperature of
validate the 3-dimensional transient model of a ceiling                your air-conditioning system's and decrease the
fan using Computational Fluid Dynamics. This is done                   energycosts (Hawaii Energy Code, 2015). In the winter,
by comparing the experimentally measured values with                   fans ought to be worked in reverse mode to recycle the
simulated values of air velocities at various precisely                warm air caught at the roof. Something other than
located points, in a building envelope, for achieving                  practical machines, the present fans have turned into an
thermal comfort, using ceiling fan by ANSYS 18.2. As,                  imperative design component in homes and are
the flow of air originating from fan is having turbulent               accessible in a wide cluster of sizes and styles (Ceiling
nature and there are so many models available, so                      Fans, 2013).
choosing the correct model is necessity. In this study,                          Introducing a roof fan in each living space will
the comparison of the experimental work is done for the                enable occupants to feel cooler while sparing energy.
four most widely used turbulence models i.e. the                       Furthermore, on the off chance that you have not
standard k- ω, the SST k-ω, the standard k-ε and the                   updated your roof fans in the previous eight years or
Realizable k-ε. After the analysis and comparison it was               something like that, then you are missing an
found that the result obtained from the SST k-ω are best               opportunity to save the energy requirement and
suited to model for this type of problem, as the                       minimizing your electricity bill also (Ceiling Fans,
simulated values thus obtained shows agreement of                      2013). According to John moody, ceiling fan
94% with the experimented values.                                      manufacturer “a roof fan can spare property holders as
Keywords: Computational Fluid Dynamics, Thermal                        much as 40 % on their air conditioner bills by making a
Comfort, Building Envelope, Turbulent, SST k-ω,                        breeze that influences the ambient temperature to feel
Realizable k-ε, standard k-ε and standard k- ω.                        seven or eight degrees cooler than it really is.
INTRODUCTION                                                                     Individuals feel inconvenience when someone
                                                                       sweats in a room/space with air present in room.
          Fans have been utilized since past many years                Subsequently, individuals attempt to make air breeze
in order to improve indoor thermal comfort in buildings                around the bodies either normally or mechanically to
in tropical and subtropical climatic zones (Jain et al.,               upgrade body convective warmth exchange. Air
2004). The fans there offer an in fact straight forward,               movement helps sweat vanishing and, appropriately
economical, independently operable and, most                           brings body comfort feeling. It is extremely
importantly, effective technique to increase movement                  troublesome for some individuals in developing nations
of air and ultimately thermal comfort in a room (Sekhar                to have an air-conditioning system to accomplish the
et al., 1995). This is generally done by removing/                     conditions suitable for comfort in indoor. Rather,
circulating the warm stratified air from/in the room.                  individuals depend for the most part on natural
The downwash propelled by foil (rotating) drives the                   ventilation. Roof fans are utilized as a part of
warm air downwards to blend with the cold air on                       workplaces, living arrangements as a contrasting option
ground level, countering the impacts of buoyancy. Fans                 to expand the comfort envelope during summer season.
are also widely used and accepted, due to their cost                   Generally, fans are of reasonable cost, basic in
effectiveness and also good availability (Li et al.,                   development, simple to fix, and needn't bother with
2016).                                                                 maintenance. The features of the flow pattern prompted
          Energy preservation and rising fuel costs                    by roof-fans are extremely useful for those individuals
makes fans a natural decision with regards to saving our               of interest who were working in the field of Heating
normal assets. Fans not just circulate cool air in the                 Ventilation and Air-Conditioning (HVAC) (Bassiouny
summer, but they additionally help with the                            et al., 2011).
development of warm air in the winter. Amid the

© 2018 ASHRAE (www.ashrae.org) and IBPSA-USA (www.ibpsa.us).                                                                           197
For personal use only. Additional reproduction, distribution, or transmission in either print or digital form is not permitted without
ASHRAE or IBPSA-USA's prior written permission.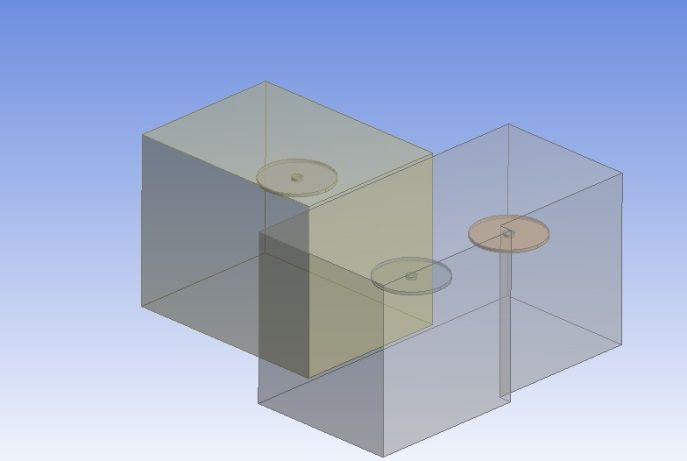
2018 Building Performance Analysis Conference and
                                                                         SimBuild co-organized by ASHRAE and IBPSA-USA
                                                                                                                Chicago, IL
                                                                                                     September 26-28, 2018

To date, there are few existing reports on the utilization             replicate the predominant characteristics of the air flow
of CFD to show roof fans.                                              generated by the fan. The best results are achieved
Rohles et al., 1982 & 1983 studied the usefulness of                   when the SST k-ω turbulence model is used, with 83%
ceiling fans in order to enhance the comfort                           of the simulated values being within the error bars of
experimentally by investigating the 256 subjects under                 the respective measured value.
various air velocity and temperature in an environment                           In present study, our aim is to make and
chamber equipped with a ceiling fan. The results                       validate a 3D fan model commonly used for air
showed that an air plume originating from ceiling fan                  circulation in a particular space at a typical location and
with velocity between 0.5 and 1.0 m/s compensates fora                 compare the measured data with the simulated results
2.8–3.3 °C temperature change; this represents an                      from 04 turbulent models.
energy saving of 15–18%.                                               METHODOLOGY
Morton-Gibson et al., 1985 investigated the effects of                 There are two approaches which are used during the
ceiling fans or individual fans on thermal comfort in an               study. First one is experimental and other one
office building and found that operating fans for about                Computational fluid Dynamics based simulations.
1000 hour per year at 26.7 °C results in approximately
                                                                       Experimental Setup
the same comfort levels as 24.4 °C without fans and
that the resulting savings are more than the cost and                  The experiment was conducted in the two office spaces
energy usage of the fans.                                              (Room-1 and Room-2) situated in Central workshop of
                                                                       Shri Mata Vaishno Devi University, Kakryal in District
Tian et al., 2018 reviewed the current and potential
                                                                       Reasi of Jammu and Kashmir. The location is having
applications using co-simulation and identify future
                                                                       regular hot and damp atmosphere and situated at
research needs on coupling building energy simulation
                                                                       32.98°N, 74.95°E and has an elevation of
(BES) and Computational Fluid Dynamics (CFD).
                                                                       approximately 2,474 feet (Anand et al., 2014). Room 1,
Gruyters et al., 2018 developed a transient CFD model                  as shown in figure having a volume dimensioned as
to analyze temperature dynamics in a cool store and                    3044×4076×3300 mm respectively whereas Room 2 is
studied the Effects of cooling control on quality change               divided into two sections due to its structure and is
and energy consumption.                                                having the dimension 3140×3040×3300 mm, and
Krole et al., 2018 presented the brief review over the                 3000×2780×3300 mm, respectively.
commonly used models of ceiling fan and expresses                      The ceiling fan used in this work has a sweep diameter
some issues over the selection of model.                               of 1400 mm. There was a single fan (Fan 1) in Room 1
Chen et al., 2018 investigated the influence of various                whereas 2 fans (Fan 2 and Fan 3) in Room 2 as shown
parameters over air distribution and found that air                    in Figure 2(b). The speed of Fan 1, Fan 2 and Fan 3 are
velocity is only affected in the given cylindrical zone.               measured to be 275 rpm, 170 rpm and 255 rpm,
Verma et al., 2018 modelled a ceiling fan for a hostel                 respectively. The fan is installed at 0.82 m of distance
room of a University by using K-ω Turbulence model                     from the ceiling. It is assumed that there is no air
in order to study the air flow in room. They studied the               exchange between the room under investigation and the
velocity contours of a room at three different heights.                environment. This was done by taking into account the
As a result they observed that on the bottom plane                     closed doors, windows and other vents in the respective
(plane near to floor) velocity of air is low but it is                 rooms. The diameter of central hub of the fan is 200
uniform and there weren’t stratified zones in the plane                mm and blades are approximately 600 mm in length.
whereas in above planes there were stratified zones.                   During experiment, all the room furniture and other
                                                                       objects were taken out of room to cause minimum
Balbich et al., 2017 developed and validated a 3-
                                                                       obstruction to the air flow.
dimensional transient implicit CFD model of a typical
ceiling fan by comparing simulation results obtained                   Measurements of velocities were taken in three
using different URANS turbulence models with                           different vertical planes i.e. 0.15 m from floor (Plane
measured data in a controlled environment.They                         1), 0.65 m from floor (Plane 2) and 1.2 m from floor
demonstrated ceiling fan as a source of momentum. In                   (Plane 3) respectively. In each plane, velocities are
order to reduce the required computational power, fan                  measured at 8 points in Room 1 and 16 (eight for each
has been utilized as a hollow ring with a central                      fan) points in Room 2. The point where the
cylinder-shaped solid element. As a result, they                       measurements are taken are depicted in the Figure 1
highlighted that this ceiling fan model is able to                     shown below.

© 2018 ASHRAE (www.ashrae.org) and IBPSA-USA (www.ibpsa.us).                                                                           198
For personal use only. Additional reproduction, distribution, or transmission in either print or digital form is not permitted without
ASHRAE or IBPSA-USA's prior written permission.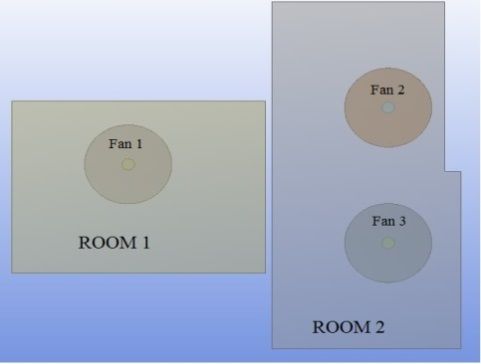
2018 Building Performance Analysis Conference and
SimBuild co-organized by ASHRAE and IBPSA-USA
Chicago, IL
September 26-28, 2018
The readings were taken with the logging duration of
around 5 min. It implies that when a reading was
recorded then after recording it the anemometer has
been placed stationary for around 5 min and next
reading was taken after that time period, so as to let the
anemometer come to rest thus not influencing the other
values.
(a)
Figure 1 Top view of the rooms showing points where (b)
measurements were recorded
This process was repeated for all the readings.
Digital anemometer AM- 4201 is used to measure the
air velocities at different points shown in Figure 1.
Digital non-contact type Tachometer is used to measure
the fan speed (rpm). Anemometer AM-4201 which has
been used for measurement of the air velocity can
measure velocity only in one direction, which implies (c)
that we can measure only speed of the air, neither the Figure 2(a) Front view, (b) Top view, and (c) Side view,
components of velocity of air (axial, radial & of Rooms
tangential) separately. The measuring range of the
anemometer is 0.4 m/s to 30 m/s with resolution of 0.1
m/s and accuracy of ± (2%).
CFD Based Approach
An identical setup, as utilised for the
experiment, was then reproduced using CREO-
Parametric and was investigated in the CFD program
using ANSYS 18.2 Academic version. The 2D sketch
of the room is shown in three different views, that is,
front, top, and side, so that the proper orientation of the
site could be depicted and are shown in Figures 2(a),
2(b), and 2(c), respectively.
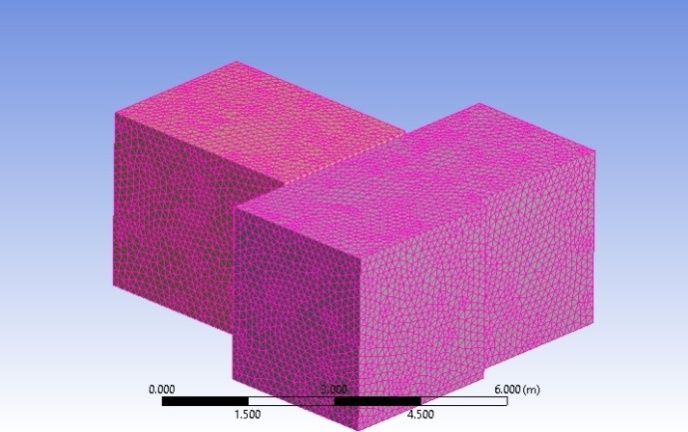
Figure 3 3D model of Room
Figure 3 represents 3D model of the rooms
having the original dimensions to that in experimental
setup. As doors and windows were kept closed during
experiment so we have not included the doors and
© 2018 ASHRAE (www.ashrae.org) and IBPSA-USA (www.ibpsa.us). 199
For personal use only. Additional reproduction, distribution, or transmission in either print or digital form is not permitted without
ASHRAE or IBPSA-USA's prior written permission.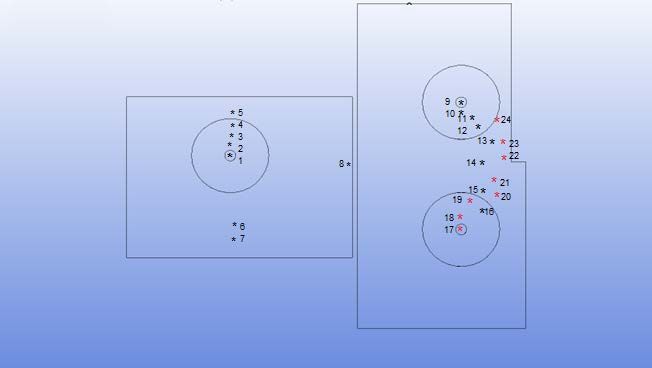
2018 Building Performance Analysis Conference and
                                                                         SimBuild co-organized by ASHRAE and IBPSA-USA
                                                                                                                Chicago, IL
                                                                                                     September 26-28, 2018

windows in the model considered room as close volume                   the results and the limitation of the nodes, as in the
and conducted simply isothermal iterations in order to                 ANSYS Academic version an appropriate mesh was
decrease the computational power required. The ceiling                 used. The current study involves the meshing of room
fan had been demonstrated as a source of momentum                      and fan with the maximum size of 146.47 mm and
(Babich et al., 2017) as shown in Figure 4.                            minimum size of 0.73 mm with growth rate of 1.2
                                                                       (Mesh 3). It involves 32000 nodes and 150580
                                                                       elements. Figure 5 shown below shows the mesh
                                                                       generated by Mesh 3.

                                                                       Table 1 Different mesh used for mesh independence test
                                                                                    Maximum        Minimum                  Elem-
                                                                                                                  Nodes
                                                                                    size (mm)      size (mm)                ents
                                                                        Mesh 1          500            2.5        6116        19381
                                                                        Mesh 2          250           1.25        11083       43489
                                                                        Mesh 3        146.47          0.73        32000      150580
                                                                        Mesh 4         95.25          0.48        80128      405655

             Figure 4 3D model of ceiling fan

          Displaying the actual blades would require
extremely nitty gritty data of the geometry, and also
prompt significantly larger number of elements in mesh
and high utilization of a moving mesh. Due to these
features, the required computational power demand and
uncertainty sources is going to increase, without
ensuring superior results, yet constraining the
convenience and fittingness of the model. Along these
lines, the fan has been utilized as a hollow ring of
diameter of 140 cm, and having separation from the
roof of 820 mm, as that of the fan used during                                     Figure 4 Meshing of the room model
experiment, with a central cylinder-shaped solid
element, since in a real roof fan no air radiates from the                       The CFD has been broadly and promisingly
inside. The volume of the field for simulation was                     utilized as a part of numerous muddled applications. In
approximately 99.97 m3. The rotational zone comprises                  the present investigation, Fluent, a module of ANSYS,
of a tube shaped ring and a disc. Thus, the rotational                 is utilized to simulate the pattern of flow induced by a
zone involved around 1.11% of the recreation field.                    roof fan in a space. Double Precision based serial
          For this model, ANSYS 18.2 academic version                  simulations has been opted in Fluent set up. Transient
is used to generate the mesh. The curvature type size                  pressure based solver has been opted to study the real
functions of mesh used with the skewness of 0.9. Both                  behavior of fan. Absolute formulation has been adopted
the rooms are distributed into number of grids and                     to ensure the robustness and accuracy in the Problem.
elements. Every grid point found in the computational                            Also, considering the rooftop fan as a section
space is encompassed by one volume. Every one of the                   which is going to be used along with the advanced
factors decided for the computations are solved in these               transient models of comfort, so running the transient
points. The calculation results by differential equations              recreations from the most starting stage makes its
in these locations are replaced by discrete values.                    pertinence not only much requesting but rather more
          The mesh independence was also conducted                     reliable. The air stream created by a rooftop fan is
with the help of four different meshes as tabulated in                 extraordinarily turbulent. Thusly, picking the most
Table 1. As the result of mesh independence test, we                   fitting turbulence model is essential with a particular
got to know that results are independent of the type of                ultimate objective to get correct results. For ensuring
mesh selected. Owing to the computation power                          better results we have performed simulations on four
requirement and to have a healthy compromise between                   different models of Fluent i.e. Standard k-ω, SST k-ω,
                                                                       standard k-ε and Realizable k-ε models.

© 2018 ASHRAE (www.ashrae.org) and IBPSA-USA (www.ibpsa.us).                                                                           200
For personal use only. Additional reproduction, distribution, or transmission in either print or digital form is not permitted without
ASHRAE or IBPSA-USA's prior written permission.
2018 Building Performance Analysis Conference and
                                                                         SimBuild co-organized by ASHRAE and IBPSA-USA
                                                                                                                Chicago, IL
                                                                                                     September 26-28, 2018

          The criteria for convergence has been settle                 Standard k-ω, Realizable k-ε and standard k-ε models.
equivalent to 10-04 for the RMS residuals. As doors                    While considering the different models for simulation,
and windows are closed during the experiment so we                     it has been observed that SST k-ω shows the excellent
can say that there isn’t any inlet or exhaust in the                   agreement with the values which are measured
model. Thus, conservation target is not going too                      experimentally. Actually when all the 72 points are
impacted by this. Besides, the sub-space which is                      considered, it has been observed that, there was an
utilized to display the fan essentially goes about as a                average error of 6% when SST k-ω model has been
source of momentum. Yet it is not going to produce any                 used. Table 2 shows the variation while we are using
im-balancing in mass so there weren’t any physical                     different models at different distance from the floor. It
obstructions between this sub-area and the rest of the                 has been observed that SST K-ω is the promising model
part of the room. The time step in the start was settled               which shows the better result as that of realistic values
to 0.1s, with the most extreme and least esteems set                   found during the experiment.
equivalent to 0.1s separately. The source of                                    Here we can see the variation of simulated and
energy/momentum which is going simulates the real fan                  measured values at 1.2 m height from the floor as
has been connected to the subdomain utilizing tube                     shown in Figure 5. It can be seen in case of SST K-ω
shaped parts. Fan 1 has been applied with axial                        that the deviation of measured and simulated value is
component 60 kg/m2s2, radial component 0 kg/m2s2                       within the acceptable range at all the points. Even it has
and theta component 8 kg/m2s2 whereas Fan 2 has                        been clearly seen that at point 5 both values coincides.
been applied with axial component 45 kg/m2s2, radial
component 0 kg/m2s2 and theta component 8 kg/m2s2                       Table 2 Average error of respective models in different
and Fan 3 with axial component 52 kg/m2s2, radial                                              Planes
component 0 kg/m2s2 and theta component 8 kg/m2s2.                     Height from      SST      standard       Realizable     Standard
The theta segment given to cylindrical disc creates the                 floor (m)       k- ω        k-ε            k-ε            k-ω
rotating movement whereas axial component work is to
push the air downwards.                                                     1.2          4.5       25.23           11.31          13.5

                                                                            0.65        5.47         30             15             17
VALIDATION                                                                  0.15          8          20            48.5            50
         Validation has been done by comparing the
                                                                         % Error          6          25             25             27
measured and simulated values at 24 points in each of
the three Planes i.e. 0.15 m above the floor, 0.65 m
above the floor and 1.2 m above the floor. Comparison                           However in case of Realizable K- ε it has been
of values at total of 52 points has been done. Results                 observed that deviations are within permissible limits
show that there is some variations at some points and                  for point 1-6,8,10,11,12,14-24. But much greater
also there were some points in the planes where                        deviation has been observed for the remaining points.
measured and simulated value are same. It has been                     Similarly in case of Standard K-ω, the points in which
largely observed that Variation in the values at some                  deviation is more than permissible are at points 8-10,
points is very much. We can say that it is due to the                  13, 17 and18. But in case of Standard k-ε there are only
range of measuring instrument. As the range of                         5 points which are in permissible range i.e. Points 5, 9,
Anemometer is between 0.4 m/s and 25 m/s, so it may                    10, 16-20 and 24.
be possible that values given below 0.4 m/s by
                                                                                Now, if we will see the variation of simulated
Anemometer is not accurate enough for the velocities
                                                                       and measured values at 0.65 m height from the floor. It
below 0.4 m/s.
                                                                       can be seen in Figure 6 that in case of SST K-ω, the
RESULTS                                                                deviation of measured and simulated value is within the
                                                                       acceptable range at all the points except point 1.
        In the present study we have studied our rooms
using four different turbulence model i.e. SST k-ω,

© 2018 ASHRAE (www.ashrae.org) and IBPSA-USA (www.ibpsa.us).                                                                           201
For personal use only. Additional reproduction, distribution, or transmission in either print or digital form is not permitted without
ASHRAE or IBPSA-USA's prior written permission.
2018 Building Performance Analysis Conference and
SimBuild co-organized by ASHRAE and IBPSA-USA
Chicago, IL
September 26-28, 2018
Simulated using SST Kω Simulated using standard Kϵ
Simulated using realizable Kϵ Simulated using standard kω
Measured values
2.5
Velocity of air in m/s
2
1.5
1
0.5
0
1 2 3 4 5 6 7 8 9 10 11 12 13 14 15 16 17 18 19 20 21 22 23 24
Points in Rooms
Figure 5 Comparison of the measured values of velocity with simulated values in different models at 1.2 m of height
from floor
This is due to the fact that the value measured deviation observed for the point 6. Similarly in case of
at point 1 is below 0.4 m/s but the range of our Standard K-ω, the points in which deviation is more
anemometer is between 0.4 and 25.0 m/s. However in than permissible are 2, 3, 6, 10, 16, 17 and 18. Again in
case of Realizable K- ε it has been observed that this model also deviation at Point 6 is very high. But in
deviations are within permissible limits for all points case of Standard k-ε there are only 5 points which are
except 1, 2, 6,13 and 23. Also there is very high in permissible range i.e. Point 5, 8, 9, 10, 12, 14 and 24.
Simulated using SST Kω Simulated using standard Kϵ
Simulated using realizable Kϵ Simulated using standard kω
Measured values
2.5
Velocity of air in m/s
2
1.5
1
0.5
0
1 2 3 4 5 6 7 8 9 10 11 12 13 14 15 16 17 18 19 20 21 22 23 24
Points in Rooms
Figure 6 Comparison of the measured values of velocity with simulated values in different models at 0.65 m of
height from floor
However, when we see the Figure 7 it has been SST K-ω model, then there were three points on which
observed that air has been circulated uniformly in deviation from measured value is zero and remaining
whole room and the there wasn’t any stratified zone are in permissible range. But in this plane remaining all
formation at 0.15 m above the floor. If we talk about other model shows very high deviations.
© 2018 ASHRAE (www.ashrae.org) and IBPSA-USA (www.ibpsa.us). 202
For personal use only. Additional reproduction, distribution, or transmission in either print or digital form is not permitted without
ASHRAE or IBPSA-USA's prior written permission.2018 Building Performance Analysis Conference and
SimBuild co-organized by ASHRAE and IBPSA-USA
Chicago, IL
September 26-28, 2018
Simulated using SST K-ω Simulated using standard K-ϵ
Simulated using realizable K-ϵ Simulated using standard k-ω
Measured values
1.6
1.4
Velocity of air in m/s
1.2
1
0.8
0.6
0.4
0.2
0
1 2 3 4 5 6 7 8 9 10 11 12 13 14 15 16 17 18 19 20 21 22 23 24
Points in Rooms
Figure 7 Comparison of the measured values of velocity with simulated values in different models at 0.15 m of
height from floor
CONCLUSION REFERENCES
This paper presents a transient 3D [1] Anand, Y., Gupta, A., Maini, A., Gupta, A.,
Computational Fluid Dynamics based model of a roof Sharma, A., Khajuria, A., Gupta, S., Sharma, S.,
fan. The exploration question was whether a straight Anand, S. and Tyagi, S.K., 2014. Comparative
forward model can be utilized for studies related to thermal analysis of different cool roof materials
thermal comfort. Keeping in mind the end goal, to for minimizing building energy
validate the model, a comparison has been made consumption. Journal of Engineering, 2014.
between the simulated and the measured values. The [2] Babich, F., Cook, M., Loveday, D., Rawal, R.
results clarified that the model which has been and Shukla, Y., 2017. Transient three-
developed predicts the accurate behavior of the air dimensional CFD modelling of ceiling
velocity. When SST K-ω model has been used it has fans. Building and Environment, 123, pp.37-49.
been observed that there was average error of only 6 %
[3] Bassiouny, R. and Korah, N.S., 2011. Studying
in the simulated model from measured one which is
the features of air flow induced by a room
quite impressive.
ceiling-fan. Energy and Buildings, 43(8),
So by the study we got to know that SST k-ω pp.1913-1918.
gives the most reliable and accurate results than the [4] Ceiling Fans, 2013, American Lighting
other models. By performing this simulation, it is easy Association,
for us to predict the location of fan in order to minimize http://www.americanlightingassoc.com/About-
the stratified zones and enhance the thermal comfort in ALA/Press-Releases/Featured-Article---Ceiling-
the room or any closed area. Fans-(1).aspx (Accessed on 7th February, 2018)
This study also leads us to one more finding [5] Chen, W., Liu, S., Gao, Y., Zhang, H., Arens, E.,
that if we used the optimized speed then it will lead to Zhao, L. and Liu, J., 2018. Experimental and
reduction in power consumption. Further these results numerical investigations of indoor air movement
can also be utilized for attaining thermally comfortable distribution with an office ceiling fan. Building
condition inside building envelope such as in the case and Environment, 130, pp.14-26.
of rented offices or apartment where the occupant has [6] Gruyters, W., Verboven, P., Delele, M.,
not much to change rather than the furniture. Gwanpua, S.G., Schenk, A. and Nicolaï, B.,
2018. A numerical evaluation of adaptive on-off
cooling strategies for energy savings during
© 2018 ASHRAE (www.ashrae.org) and IBPSA-USA (www.ibpsa.us). 203
For personal use only. Additional reproduction, distribution, or transmission in either print or digital form is not permitted without
ASHRAE or IBPSA-USA's prior written permission.2018 Building Performance Analysis Conference and
SimBuild co-organized by ASHRAE and IBPSA-USA
Chicago, IL
September 26-28, 2018
long-term storage of apples. International
Journal of Refrigeration, 85, pp.431-440.
[7] Jain, A., Upadhyay, R.R., Chandra, S., Saini, M.
and Kale, S., 2004, January. Experimental
investigation of the flow field of a ceiling fan.
In ASME 2004 Heat Transfer/Fluids
Engineering Summer Conference (pp. 93-99).
American Society of Mechanical Engineers.
[8] Król, A. and Król, M., 2018. Study on numerical
modeling of jet fans. Tunnelling and
Underground Space Technology, 73, pp.222-
235.
[9] Li, W., 2016. Numerical and Experimental
Study of Thermal Stratification in Large
Warehouses (Doctoral dissertation, Concordia
University).
[10] S.C. Sekhar, Higher space temperatures and
better thermal comfort—a tropical analysis.
Energy and Buildings. 1995 Oct 1;23(1):63-70.
[11] The Hawaii Energy Code, 2015
https://energy.hawaii.gov/wpcontent/uploads/20
16/07/Ceiling-FansFactsheet_final.pdf,
(Accessed on 7th February, 2018).
[12] Tian, W., Han, X., Zuo, W. and Sohn, M.D.,
2018. Building Energy Simulation Coupled with
CFD for Indoor Environment: A Critical Review
and Recent Applications. Energy and Buildings.
[13] Verma, S.K., Anand, Y and Anand, S. “CFD
Based Modelling of a Ceiling Fan in a
Room.” International Journal of Scientific and
Technical Advancements , vol. 4, no. 1,2, 19
Feb. 2018, pp. 219–224.,
www.ijsta.com/papers/NCEEITET-2018/IJSTA-
V4N2R58Y18.pdf.
[14] Rohles Jr, F. H., Konz, S. A., & Jones, B. W.
(1982, October). Enhancing thermal comfort
with ceiling fans. In Proceedings of the Human
Factors Society Annual Meeting (Vol. 26, No. 2,
pp. 118-120). Sage CA: Los Angeles, CA:
SAGE Publications.
[15] Rohles, F. H., Konz, S. A., & Jones, B. W.
(1983). eiIin Fans Extenders of the Summer
Comfort Envelope. ASHRAE Trans, 89, 245-
263.
[16] Morton-Gibson, M; Coutier,P.J.; Place,W.J.
Effects of fan velocity on thermalcomfort in an
office building, Proceedings of the 10th National
Passive SolarConference, the Solar Energy &
Utilities Conference, the
DaylightingApplications Conference, the
Building with the Sun Conference (1985)406–
409.
© 2018 ASHRAE (www.ashrae.org) and IBPSA-USA (www.ibpsa.us). 204
For personal use only. Additional reproduction, distribution, or transmission in either print or digital form is not permitted without
ASHRAE or IBPSA-USA's prior written permission.You can also read