TEMPORAL PATTERNS AND A DISEASE FORECASTING MODEL OF DENGUE HEMORRHAGIC FEVER IN JAKARTA BASED ON 10 YEARS OF SURVEILLANCE DATA
←
→
Page content transcription
If your browser does not render page correctly, please read the page content below
Southeast Asian J Trop Med Public Health

TEMPORAL PATTERNS AND A DISEASE FORECASTING
  MODEL OF DENGUE HEMORRHAGIC FEVER IN
       JAKARTA BASED ON 10 YEARS OF
            SURVEILLANCE DATA
          Monika S Sitepu1,2, Jaranit Kaewkungwal2,5, Nathanej Luplerdlop2,
      Ngamphol Soonthornworasiri2, Tassanee Silawan3, Supawadee Poungsombat4
                              and Saranath Lawpoolsri2,5

      Directorate General of Health Care, Ministry of Health, Jakarta, Indonesia;
       1

 Department of Tropical Hygiene, Faculty of Tropical Medicine, Mahidol University,
 2

    Bangkok; 3Faculty of Public Health, Mahidol University, Bangkok; 4Bureau of
 Vector-Borne Disease, Ministry of Public Health, Nonthaburi; 5Center for Emerging
          and Neglected Infectious Diseases, Mahidol University, Thailand

       Abstract. This study aimed to describe the temporal patterns of dengue trans-
       mission in Jakarta from 2001 to 2010, using data from the national surveillance
       system. The Box-Jenkins forecasting technique was used to develop a seasonal
       autoregressive integrated moving average (SARIMA) model for the study period
       and subsequently applied to forecast DHF incidence in 2011 in Jakarta Utara,
       Jakarta Pusat, Jakarta Barat, and the municipalities of Jakarta Province. Dengue
       incidence in 2011, based on the forecasting model was predicted to increase from
       the previous year.
       Keywords: dengue hemorrhagic fever, time series analysis, seasonal autoregres-
       sive integrated moving average, forecasting

            INTRODUCTION                         infections are reported annually from 100
                                                 countries worldwide (WHO, 2011). Two
     Dengue infection is a major public          hundred thousand to five hundred thou-
health problem worldwide with a rapidly          sand cases of dengue hemorrhagic fever
increased incidence and spread during the        (DHF) are reported annually worldwide
past five decades (WHO, 2009). Tropical          with 24,000 deaths occurring (Monath,
countries are most afflicted by the trans-       1994; Gubler, 1998; Gibbons and Vaughn,
mission of this virus which threatens over       2002). DHF has been reported to be the
2.5 billion people who live in the tropics       leading cause of hospitalizations and
(Gubler, 1998). Fifty to 100 million dengue      death among children in several countries
                                                 in Southeast Asia, including Indonesia
Correspondence: Dr Saranath Lawpoolsri,
                                                 (WHO SEARO, 1999).
Department of Tropical Hygiene, Faculty of
Tropical Medicine, Mahidol University, 420/6         The first reported outbreak of dengue
Rachavithi Road, Bangkok 10400, Thailand.        fever in Indonesia occurred in Jakarta
Tel: 66 (0) 2354 9100                            and Surabaya in 1968. Since 2005, Indo-
E-mail: saranath.law@mahidol.ac.th               nesia has reported the highest number

206                                                                  Vol 44 No. 2 March 2013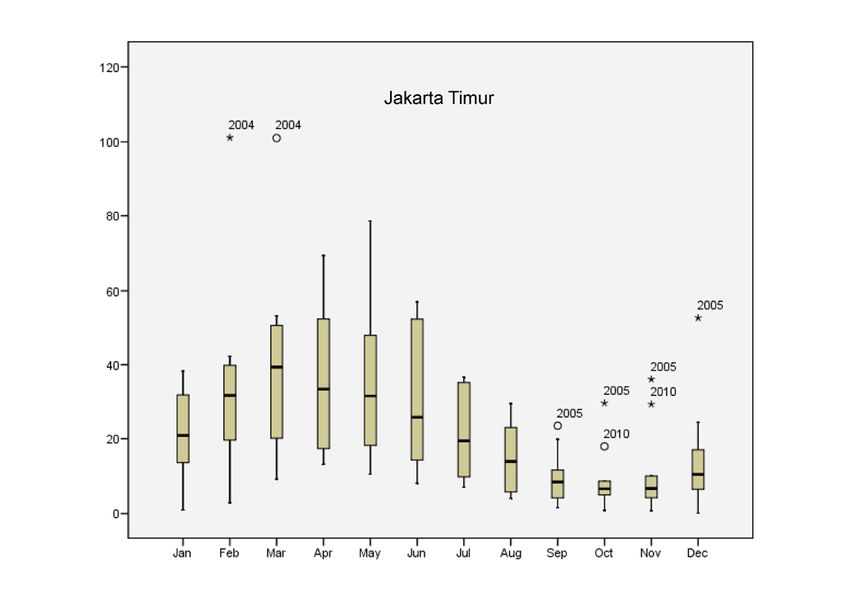
Temporal Patterns of Dengue Transmission in Jakarta

of dengue cases in Southeast Asia (WHO           lance data to understand and forecast
SEARO, 2006). In 2009, the Ministry of           patterns of dengue occurrence in Jakarta,
Health of Indonesia reported that the            Indonesia.
number of DHF cases reached 156,052 in
382 districts. A National Health Survey in            MATERIALS AND METHODS
2007 found DHF was the fourth leading
cause of death and second leading cause          Study area
of hospitalization among toddlers in In-              The Jakarta Province is located at
donesia (MOH, 2010).                             6º12’S and 106º48’E. It covers 662.33 km2
     Jakarta Province has the highest inci-      of land area and 6,977.5 km2 of sea (Gover-
dence of DHF among all the provinces in          nor Decree, 2007). This province is divided
Indonesia (MOH, 2010). All municipalities        into five municipalities (Jakarta Barat, Ja-
in this province are endemic for dengue          karta Timur, Jakarta Pusat, Jakarta Selatan,
transmission with all serotypes circulating      and Jakarta Utara), occupying lowland
(Suwandono et al, 2006). Moreover, the           areas, and a regency (Kepulauan Seribu)
Jakarta Provincial Health Office reported        consists of 110 small islands in the Sea of
that DHF has the highest IR (200,8/100,000       Java (Governor Decree, 2007). In the 2010
population) of all communicable diseases         census, the total population of Jakarta was
in 2010.                                         9,607,787 with a density of 14,476 people/
                                                 km2 (BPS-Statistics Indonesia, 2010). Being
    Prevention and control measures for
                                                 a tropical area, the climate in Jakarta tends
DF/DHF in Jakarta are based on national
                                                 to be hot and humid throughout the year.
policies, which include improvement of
                                                 However, this province has distinct wet
the surveillance system, disease man-
                                                 and dry seasons. Rainfall increases during
agement and community participation
                                                 the wet season from December to March
(Kusriastuti and Sutomo, 2005). Under-
                                                 and decreases significantly during the dry
standing patterns of disease transmission
                                                 season from June to September.
can significantly improve outbreak control
(Allard, 1998).                                       Since dengue transmission in the
                                                 small islands (Kepulauan Seribu Regency)
     Time series analysis has been used
                                                 is reported to be low (Jakarta Provincial
successfully in various studies of com-
                                                 Health Office, 2010, Unpublished data),
municable diseases to determine temporal
                                                 this study was conducted in the five in-
patterns and forecast disease occurrence
                                                 land municipalities: Jakarta Barat, Jakarta
(Helfenstein, 1986; Luz et al, 2008; Sila-
                                                 Timur, Jakarta Pusat, Jakarta Selatan, and
wan et al, 2008; Wangdi et al, 2010). This
                                                 Jakarta Utara (Fig 1). All municipali-
technique is considered a useful tool
                                                 ties are urban and endemic for dengue
for understanding the structure of data,
                                                 (Jakarta Provincial Health Office, 2010,
forecasting, monitoring and providing
                                                 Unpublished data).
feedback regarding control activity (Box
et al, 1994). Time series analysis can be        Data collection
practically applied to routinely collected            Dengue is a notifiable disease in In-
data (longitudinal data) in disease sur-         donesia, hence, all dengue cases at health
veillance systems. The objective of this         centers, hospitals, clinics, and private phy-
study was to demonstrate the use of time         sician’s offices are required to report im-
series analysis of routine dengue surveil-       mediately to the Jakarta Province Health

Vol 44 No. 2 March 2013                                                                   207
Southeast Asian J Trop Med Public Health
Active surveillance is periodi-
cally performed as a part of
the dengue surveillance sys-
tem. However, due to limited
resources, epidemiological in-
vestigations can not be done
for all reported cases. Hence,
data obtained from passive
surveillance comprises the
majority of data.
This study used DHF and
DSS passive surveillance data
collected between January
2001 and December 2010 from
the Jakarta Province Health
Office. The case definition for
DHF/DSS was based on WHO
criteria for DHF/DSS, which
includes fever, hemorrhagic
tendencies, thrombocytope-
nia, and evidence of plasma
leakage due to increased
vascular permeability (WHO,
1997). In this study, the term
DHF refers to both DHF and
DSS.
Monthly data sets from
Fig 1–Map of Jakarta Province.
2001 to 2010 for each munici-
pality and all municipalities
Office. Almost all reported dengue cases were used. The ten-year observations
are based on clinical diagnosis. Dengue were divided into two segments: the
fever tends to be underreported because it first was the estimation segment, where
is difficult to differentiate from viral infec- the monthly incidence data from 2001 to
tions without laboratory confirmation. It 2008 were analyzed to determine the best
is assumed dengue cases reported at the time-series model and the second was the
provincial level to the Ministry of Health 2009 to 2010 data served as the validation
(MOH) may or may not be dengue fever segment to confirm the time series model.
(DF), dengue hemorrhagic fever (DHF) or Data analysis
dengue shock syndrome (DSS). Once the The monthly incidence of DHF over
Jakarta Province Health Office receives a the 10-year period was plotted to observe
case report, they notify the primary health the temporal patterns of DHF transmis-
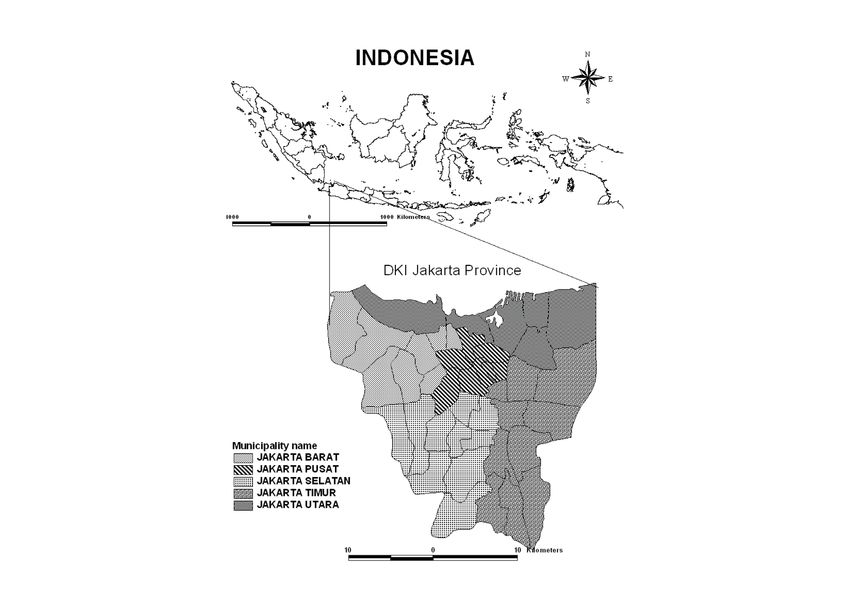
center in the area where the case occurred sion in Jakarta. A seasonal boxplot was
to conduct an epidemiological investiga- created for each municipality to identify
tion and apply dengue control measures. the seasonal pattern and its outliers for
208 Vol 44 No. 2 March 2013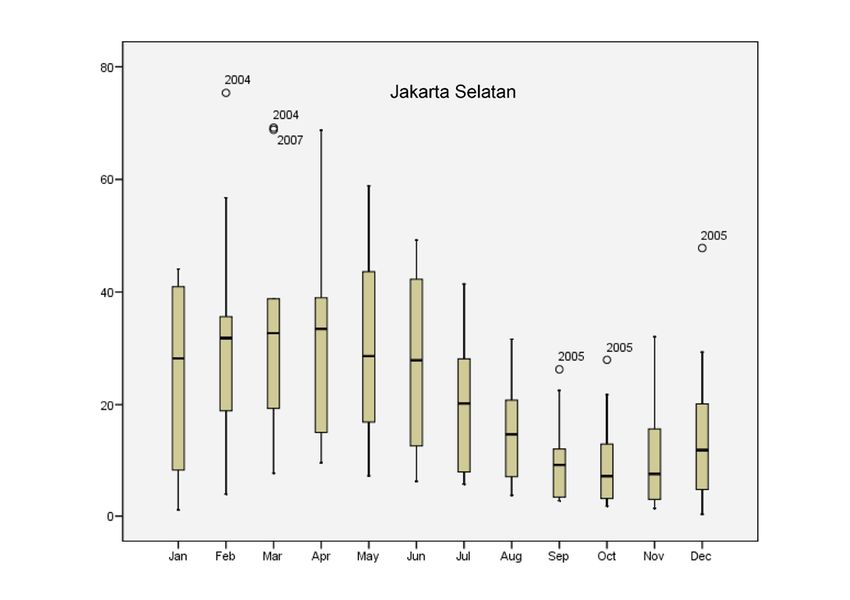
Temporal Patterns of Dengue Transmission in Jakarta

DHF transmission during the 10-year                                 Table 1
period. Trend analysis using Poisson                Descriptive statistics for annual DHF
regression was performed to determine                incidence in the study areas during
the annual trend for DHF incidence in                             2001-2010.
five municipalities and for overall Jakarta,
                                                                           DHF incidence
when seasonal effects were not taken into                              per 100,000 population
account.                                          Municipality
                                                                    Median Minimum Maximum
     Time series analysis was chosen based
on the assumption the incidence of infec-         Jakarta Utara      253      46         379
tious diseases is related to the previous         Jakarta Pusat      351      88         433
incidence and population at risk (Helfen-         Jakarta Barat      171      58         224
stein, 1986). Using to the data of monthly        Jakarta Selatan    293      70         450
DHF incidence, a Seasonal Autoregressive          Jakarta Timur      310      78         398
Integrated Moving Average (SARIMA)
model was chosen to fit the data. Station-
arity of the data were initially assessed. A      Schwartz’s Bayesian Information Crite-
Box-Cox transformation procedure was              rion (BIC) were performed. The model
used to stabilize the variance, while dif-        with the lowest BIC and AIC was chosen
ferencing and seasonal differencing were          as the best-fitting model.
used to stabilize the mean and remove                 An out-of-sample forecast was used
seasonal autocorrelation, respectively. The       to forecast the incidence from January
SARIMA (p,d,q,)(P,D,Q)s model was gen-            2009 to December 2010. The accuracy of
erated using the Box-Jenkins approach.            forecasting was determined by compar-
     The autocorrelation function (ACF)           ing the actual with the forecasted DHF
and the partial autocorrelation function          incidence using the Mean Absolute Per-
(PACF) were analyzed to identify the              centage Error (MAPE) and Mean Absolute
order of SARIMA (p,d,q)(P,D,Q)s model,            Error (MAE).
where: (1) p and P are the order for autore-          The data used in this study was ob-
gressive (AR) and seasonal autoregres-            tained from the Jakarta Health Office. All
sive, respectively; (2) d and D are the order     data were collected anonymously. The
for differences and seasonal differences,         study received ethical approval from the
respectively; (3) q and Q are the order for       Committee on Health Research Ethics,
moving average (MA) and seasonal mov-             the National Institute of Health Research
ing average, respectively, and (4) s is the       and Development, the Ministry of Health,
length of the seasonal period.                    Republic of Indonesia and the Ethics
     Tentative models were then estimated         Committee, Faculty of Tropical Medicine,
using the maximum likelihood method.              Mahidol University, Thailand.
The significance of the estimated param-
eters was derived and considered if the                              RESULTS
p-value was less than 0.05. The Ljung-Box
was performed to determine the adequacy           Temporal distribution
of the tentative model. An adequate model              The overall incidence of DHF sug-
was chosen if the residuals of ACF were           gests high endemicity in all municipalities
statistically equal to zero or white noise.       of Jakarta Province. Table 1 summarizes
Akaike’s Information Criterion (AIC) and          the annual incidence for each endemic

Vol 44 No. 2 March 2013                                                                         209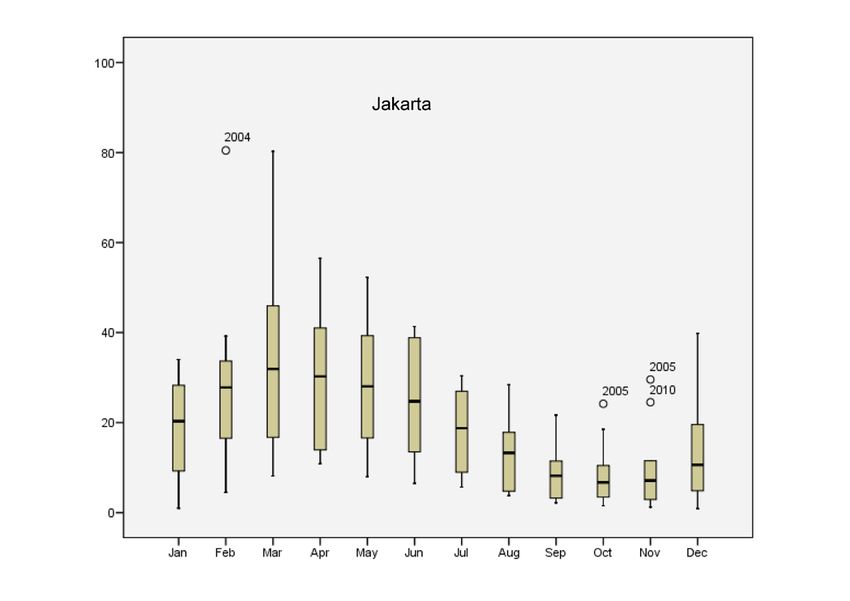
Southeast Asian J Trop Med Public Health

                                                                  Table 2
                           Incidence rate ratio of annual DHF incidence and percent increase in the annual DHF
                             incidence over time (2001 to 2010), by municipality and overall Jakarta Province.
                                   Municipality Incidence rate ratio          95% confidence       Percent increase in the
                                   		                                            interval           incidence (per year)

                                   Jakarta Utara            1.17                 1.15 - 1.18                 17
                                   Jakarta Pusat            1.13                 1.11 - 1.14                 13
                                   Jakarta Barat            1.10                 1.08 - 1.12                 10
                                   Jakarta Selatan          1.13                 1.12 - 1.15                 13
                                   Jakarta Timur            1.12                 1.10 - 1.13                 12
                                   Jakarta Province         1.13                 1.11 - 1.14                 13

                                                                                                    municipalities (Fig 2).
                                   120                                                              DHF cases were found
Incidence per 100,000 population

               100                                                                                  year long with varying
                80                                                                                  intensity from month
                60                                                                                  to month. The inci-
                40
                                                                                                    dence of DHF usually
                                                                                                    increased in January
                                                                                                    with a peak around
                20

                 0
                      01 01 02 l 02 03 l 03 04 l 04 05 l 05 06 l 06 07 l 07 08 l 08 09 l 09 10 l 10
                                                                                                    March or April, and
                                                                                                    then a gradual decrease
                     n ul  n Ju an Ju an Ju an Ju             n Ju an Ju        n Ju an Ju an Ju
                   Ja J Ja        J       J        J       Ja      J         Ja       J        J
                                                      Time (monthly)
                                                                                                    until the end of the
                               Incidence in municipalities          Incidence in Jakarta Province
                                                                                                    year. The epidemic cy-
             Fig 2–Monthly DHF incidence in five endemic municipalities (thin line) cle was unclear during
                    and Jakarta Province (thick line), 2001-2010.                                   the 10-year period. The
                                                                                                    highest peak was ob-
             municipality during the past decade.                                served in 2004, suggesting an epidemic,
             Jakarta Pusat and Jakarta Timur both                                after which the seasonal wave widened
             had a median incidence of more than 300                             during the past five years with a slight
             per 100,000 during this period, while the                           increase in baseline incidence. In 2005
             median incidence was lowest in Jakarta                              and 2006, a high DHF incidence was ob-
             Barat (171 per 100,000 population).                                 served throughout the year, almost free
                   The trend of the annual DHF inci-                             of seasonality.
             dence was increased significantly during                                  The presence of seasonal patterns is
             the study period. Trend analysis shows                              illustrated on Fig 3. During the past ten
             the overall incidence of DHF in Jakarta                             years, the transmission tended to start in
             increased by approximately 13% yearly.                              December. A high monthly incidence was
             The greatest increase was seen in Jakarta                           usually seen between January and June,
             Utara with a 17% increase in incidence per                          when peak incidences were observed
             year (IRR 1.17) (Table 2).                                          from March to April with a gradual de-
                   The monthly incidence of DHF had                              crease during the following months. The
             a similar seasonal pattern for each of the                          incidence during the high season months

             210                                                                                 Vol 44 No. 2 March 2013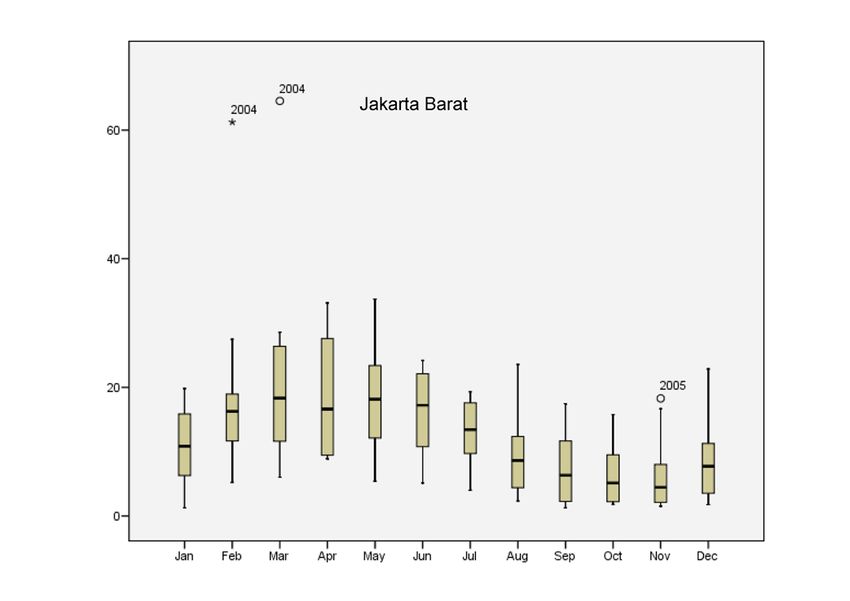
Temporal Patterns of Dengue Transmission in Jakarta

                                   100
Incidence per 100,000 population

                                                                                               Incidence per 100,000 population
                                                                                                                                  60
                                    80

                                    60
                                                                                                                                  40

                                    40

                                                                                                                                  20
                                    20

                                     0                                                                                             0

                                             Jan Feb Mar Apr May Jun Jul Aug Sep Oct Nov Dec                                           Jan Feb Mar Apr May Jun Jul Aug Sep Oct Nov Dec
                                                           Month of the year                                                                        Month of the year

                                    80                                                                                            80
Incidence per 100,000 population

                                                                                               Incidence per 100,000 population

                                    60                                                                                            60

                                    40                                                                                            40

                                    20                                                                                            20

                                     0                                                                                             0

                                             Jan Feb Mar Apr May Jun Jul Aug Sep Oct Nov Dec                                           Jan Feb Mar Apr May Jun Jul Aug Sep Oct Nov Dec
                                                           Month of the year                                                                        Month of the year

                                    120                                                                                    120
Incidence per 100,000 population

                                                                                               Incidence per 100,000 population

                                    100                                                                                    100

                                     80                                                                                           80

                                     60                                                                                           60

                                     40                                                                                           40

                                     20                                                                                           20

                                         0                                                                                         0
                                             Jan Feb Mar Apr May Jun Jul Aug Sep Oct Nov Dec                                           Jan Feb Mar Apr May Jun Jul Aug Sep Oct Nov Dec
                                                           Month of the year                                                                        Month of the year

                                   Fig 3–Seasonal boxplot for monthly incidence in five endemic municipalities and Jakarta Province.
                                         Dot represents outliers of incidence for particular years.

                                   Vol 44 No. 2 March 2013                                                                                                                        211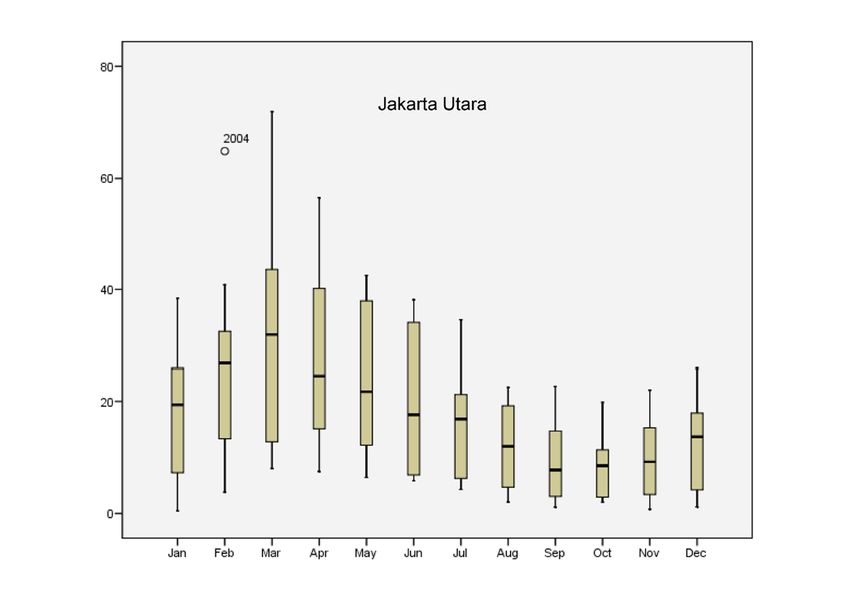
Southeast Asian J Trop Med Public Health
Jakarta Province
areas in February and
Incidence per 100,000 population
100
90
80
R2 = 74.99% MAPE : 18.33% March 2004 indicating
the outbreaks occurred
MAE : 4.73
70
in 2004.
60
50
Jakarta Selatan had
40
30
20
10
outliers in March 2007
0 without upper whiskers,
01 l 01 02 l 02 03 l 03 04 l 04 05 l 05 06 06 07 l 07 08 l 08 09 l 09 10 l 10
Ja
n Ju Jan Ju Jan Ju Jan Ju Jan Ju Ja
n Jul an
J Ju Jan Ju Jan Ju Jan Ju suggesting the outbreak
Time (month-year) was characterized by a
rapid increase in inci-
Actual incidence Predicted incidence Forecasted incidence
dence in March compared
Jakarta Utara
to the same month in
other years. Outliers were
Incidence per 100,000 population
MAPE : 28.99%
80
MAE : 6.4
also seen during the low
70 R2 = 72.19%
60
50 season in most study ar-
40
eas and in the overall
Jakarta Province, except
30
20
10 in Jakarta Utara. These
0
01 l 01 02 l 02 03 l 03 04 l 04 05 l 05 06 06 07 l 07 08 l 08 09 l 09 10 l 10
outliers were observed
between September and
n Ju Jan Ju Jan Ju Jan Ju Jan Ju n Jul an Ju Jan Ju Jan Ju Jan Ju
Ja Ja J
December in both 2005
Time (month-year)
Actual incidence Predicted incidence Forecasted incidence
and 2010, which suggests
sustained high transmis-
sion during both those
Jakarta Pusat years.
Incidence per 100,000 population
120
100 R2 = 70.97% MAPE : 22.99%
MAE : 6.85
Time series analysis
80
The best fitting model
was obtained after estima-
60
tion, diagnostic checking,
40
and model selection for
20
the individual and overall
0
01 l 01 02 l 02 03 l 03 04 l 04 05 l 05 06 06 07 l 07 08 l 08 09 l 09 10 l 10
n Ju Jan Ju Jan Ju Jan Ju Jan Ju n Jul an Ju Jan Ju Jan Ju Jan
municipalities. The struc-
Ja Ja J Ju
Time (month-year)
Actual incidence Predicted incidence Forecasted incidence ture of the best model for
each municipality and
Fig 4–Plot series for monthly incidence of DHF in Jakarta Province overall for Jakarta Prov-
and five endemic municipalities: actual incidence (grey line), ince is shown in Table 3.
predicted incidence from the seasonal ARIMA model (dash
A c c o rd i n g t o t h e
line), and forecasted incidence (black line).
model selection, most of
the selected Box-Jenkins
was widely distributed compared to low models are SARIMA (1,0,1)(0,1,1) 12 ,
season months, which indicates more except for Jakarta Selatan and Jakarta
inter-annual fluctuations in transmission Timur which are SARIMA (0,0,2)(0,1,1)12
during the high season months. and SARIMA (2,0,0)(0,1,1)12, respectively.
Outliers of DHF were seen in all study The most commonly identified model,
212 Vol 44 No. 2 March 2013Temporal Patterns of Dengue Transmission in Jakarta
in Jakarta Selatan only the
Incidence per 100,000 population
Jakarta Barat
70
60 R2 = 75.62% MAPE : 22.59% random shock for the pre-
vious two months and the
MAE : 3.49
50
seasonal trend should be
40
considered when predict-
30
20
10 ing the current incidence
0
01 l 01 02 l 02 03 l 03 04 l 04 05 l 05 06 06 07 l 07 08 l 08 09 l 09 10 l 10
but in Jakarta Timur, the in-
Ja
n Ju Jan Ju Jan Ju Jan Ju Jan Ju Ja
n Jul an
J Ju Jan Ju Jan Ju Jan Ju
cidence in the previous two
months and the seasonal
Time (month-year)
Actual incidence Predicted incidence Forecasted incidence
trend during the previous
year influence the predic-
tion of the current value.
Forecasting
Jakarta Selatan
Incidence per 100,000 population
80
70
The best models were
R2 = 73.55% MAPE : 20.57%
60 MAE : 5.13
50 fitted to a validation seg-
ment for the period of
40
30
20 January 2009 to December
10 2010. Fig 4 shows the ac-
tual and predicted monthly
0
01 l 01 02 l 02 03 l 03 04 l 04 05 l 05 06 06 07 l 07 08 l 08 09 l 09 10 l 10
n Ju Jan Ju Jan Ju Jan Ju Jan Ju n Jul an Ju Jan Ju Jan Ju Jan
incidences in the five mu-
Ja Ja J Ju
Time (month-year)
Actual incidence Predicted incidence Forecasted incidence nicipalities and for Jakarta
Province. The actual line
was close to the predicted
line and followed the ac-
tual pattern with a R2 from
Incidence per 100,000 population
Jakarta Timur
140
120 R2 = 72.66% MAPE : 24.26% 70.97% to 75.62%, which
suggests the model may
MAE : 7.12
100
be used for disease fore-
80
casting.
60
40
20 The forecasting accu-
0
01 01 02 02 03 03 04 04 05 05
racy
06
is given by the Mean
06 07 07 08 08 09 09 10 10
n Jul an l l l l n Jul an l l l l
Ja J Ju Jan Ju Jan Ju Jan Ju Ja
Time (month-year)
J Ju Jan Ju Jan Ju Jan Ju
Absolute Percentage Error
Actual incidence Predicted incidence Forecasted incidence (MAPE) and Mean Ab-
solute Error (MAE). The
Fig 4–(Continued). MAPE for each municipal-
ity and Jakarta Province
SARIMA (1,0,1)(0,1,1) 12 , indicates the ranged from 18.33% to 28.99% and the
current incidence can be estimated by MAE ranged from 3.49 to 7.12. The MAPE
the incidence and random shock (error) and MAE suggest the fitted model is ap-
for the previous month, and the seasonal propriate for forecasting.
trend for the previous year. The best mod-
els for Jakarta Selatan and Jakarta Timur DISCUSSION
municipalities were ARIMA (0,0,2)(0,1,1)12
and (2,0,0)(0,1,1)12, respectively. Therefore, In addition to data collection, data
Vol 44 No. 2 March 2013 213Southeast Asian J Trop Med Public Health
Table 3
Model, parameter estimation, and model selection diagnostics without constants.
Municipality SARIMA modela Parameter estimatesb p-value
± standard errors (Ljung-Box test)
Jakarta Utara (1,0,1)(0,1,1)12 AR(1) : 0.703 ± 0.055 0.986
MA(1) : 0.418 ± 0.119
SMA(1) : -0.712 ± 0.172
Jakarta Pusat (1,0,1)(0,1,1)12 AR(1) : 0.593 ± 0.066 0.688
MA(1) : 0.470 ± 0.096
SMA(1) : -0.752 ± 0.197
Jakarta Barat (1,0,1)(0,1,1)12c AR(1) : 0.737 ± 0.068 0.819
MA(1) : 0.316 ± 0.117
SMA(1) : -0.775 ± 0.225
Jakarta Selatan (0,0,2)(0,1,1)12 MA(1) : 1.156 ± 0.110 0.451
MA(2) : 0.530 ± 0.126
SMA(1) : -0.576 ± 0.149
Jakarta Timur (2,0,0)(0,1,1)12 AR(1) : 1.074 ± 0.149 0.857
AR(2) : -0.347 ± 0.14
SMA(1) : -0.827 ± 0.226
Jakarta Province (1,0,1)(0,1,1)12 AR(1) : 0.664 ± 0.062 0.917
MA(1) : 0.534 ± 0.082
SMA(1) : -0.813 ± 0.257
a
Seasonal ARIMA model fitted to the square root monthly incidence.
b
Parameter estimates, p < 0.05.
c
Seasonal ARIMA model fitted to natural log monthly incidence.
analysis to describe and predict disease after 2006, which is consistent with the
is an important component of the sur- country-wide transmission pattern (Setiati
veillance system. Longitudinal data is et al, 2006). Climatic and socio-ecological
useful for understanding the temporal conditions in Jakarta may have contribut-
pattern of disease transmission. DHF in ed to the persistently high transmission in
Jakarta fluctuated but remained at a high this province. Trend analysis showed DHF
level over the past decade. The seasonal incidence in Jakarta Province increased
pattern of DHF incidence was observed by about 13% per year. Without addi-
over the past decade. Even though DHF tional control efforts, DHF incidence may
cases were seen all year long, transmission further increase at a similar rate. High
increased significantly during the rainy temperature and humidity throughout
season and reached a peak during March the year makes virus transmission more
and April. An increase in rainfall led to an efficient by increasing the lifespan of adult
increase in DF/DHF incidence in one to mosquitoes, increasing biting activity and
two months later. This is probably due to shortening the extrinsic incubation and
the increasing in breeding sites during the gonadotrophic periods (Halstead, 2007).
rainy season (Arcari et al, 2007). A cyclical Socio-economic changes, such as popula-
pattern was not clearly seen, particularly tion growth, unplanned urbanization and
214 Vol 44 No. 2 March 2013Temporal Patterns of Dengue Transmission in Jakarta
modern transportation in Jakarta may at different health centers and hospitals.
play a role in the persistence of dengue This may lead to misclassification bias,
transmission (Gubler, 2002). Circulation of where non-DHF cases are included in the
multiple dengue virus serotypes in Jakarta DHF database. However, the number of
may have contributed to the increase pre- DF cases is expected to be relatively small
existing immunity in the susceptible host, compared to the number of DHF cases,
which is a risk factor for increasing the and should not significantly skew the data
incidence of DHF (Gubler, 1997; Guzman or change disease patterns.
and Kouri, 2002). In this study, we were only interested
There is a growing interest in inte- in predicting DHF incidence, not DF in-
grating the disease-forecasting method cidence, because DHF is a major cause of
into the surveillance system. Studies have morbidity and mortality in this country.
shown the SARIMA model can produce a Forecasting DHF cases may help allocate
reliable model to forecast DHF incidence appropriate control activities in a timely
(Choudhurya et al, 2008; Luz et al, 2008; Si- manner. However, to understand overall
lawan et al, 2008; Gharbi et al, 2011; Marti- disease transmission, both DHF and DF
nez and Silva, 2011). In our study, the best cases should be considered, because DF
fitting SARIMA models for each endemic cases can play a role in dengue transmis-
municipality and Jakarta Province as a sion in the community (Endy et al, 2002).
whole were parsimonious. The model for Besides clinical diagnosis, laboratory con-
a non-seasonal structure (p,d,q) varied by firmation and serotype identification are
municipality suggesting specific patterns necessary for inclusion in the surveillance
exist in each municipality, defining which system to enhance the use of surveillance
components influence the occurrence data, to understand the patterns of disease
of dengue. The same order for seasonal transmission and to develop an early
components (P,D,Q) was seen in all mu- warning system.
nicipalities and in overall Jakarta Province Finally, this forecasting model was
in the form of SARIMA (0,1,1) 12. This based on DHF incidence over the years
Seasonal Random Trend (SRT) indicates with the assumption that all other condi-
the dengue cases may be determined by tions, such as meteorological factors, DHF
the trend the previous year. The adjacent prevention and control programs, and
municipalities of Jakarta Utara, Jakarta socio-ecological factors remain constant.
Pusat, and Jakarta Barat had similar sta- Hence, results from the forecasting should
tistical structures for both seasonal and be carefully considered, especially when
non-seasonal components, which may these conditions vary. Since a forecast
be in part due to geographically linked in this study was based on univariate
similarities, such as environmental and analysis, forecasting is less accurate dur-
socio-economic factors. ing epidemic years. Several studies have
However, some limitations should be been conducted highlighting the various
considered when using data from routine climatic factors associated with dengue
passive surveillance for disease forecast- transmission during epidemic years in
ing. Even though DHF cases in Indonesia Indonesia (Corwin et al, 2001; Bangs et al,
are diagnosed using WHO guidelines, the 2006; Arcari et al, 2007). Incorporating a
data may include DF cases due to various climate variable into the SARIMA model
diagnostic criteria applied by physicians might improve the accuracy of prediction
Vol 44 No. 2 March 2013 215Southeast Asian J Trop Med Public Health
as shown in previous studies (Wu et al, on virus transmission. Southeast Asian J
2007; Gharbi et al, 2011). However, this Trop Med Public 2006; 37: 1103-16.
study revealed the Box-Jenkins ARIMA Box GEP, Jenkins GM, Reinsel GC. Time series
model may be useful for public health analysis forecasting and control. 3rd ed.
authorities to understand trends and fore- New Jersey: Prentice-Hall, 1994.
cast incidence in dengue endemic areas. BPS-Statistics Indonesia. Statistical yearbook of
The ARIMA model is a practical tool for Indonesia. Jakarta: BPS, 2010.
developing a forecasting system based on Choudhurya MAHZ, Banu S, Islam MA.
routine data collection within the existing Forecasting dengue incidence in Dhaka,
surveillance system, which can strengthen Bangladesh: A time series analysis.Dengue
an early warning system and can be used Bull 2008; 32: 29-37.
to initiate rapid response activities to an- Corwin AL, Larasati RP, Bangs MJ, et al. Epi-
ticipate future dengue epidemics. demic dengue transmission in southern
Sumatra, Indonesia. Trans R Soc Trop Med
Hyg 2001; 95: 257-65.
ACKNOWLEDGEMENTS
Endy TP, Chunsuttiwat S, Nisalak A, et al. Epi-
This study was supported by the demiology of inapparent and symptomatic
Thailand International Development Co- acute dengue virus infection: a prospec-
operation Agency (TICA). We would like tive study of primary school children in
Kamphaeng Phet, Thailand. Am J Epidemiol
to thank the Head of the Jakarta Province
2002; 156: 40-51.
Health Office, Dien Emmawati, for al-
Gharbi M, Quenel P, Gustave J, et al. Time series
lowing us to use the surveillance data.
analysis of dengue incidence in Guade-
We are also grateful to all the staff at the
loupe, French West Indies: forecasting
Health Control Unit, Jakarta Provincial models using climate variables as predic-
Health Office, and our colleagues from the tors. BMC Infect Dis 2011; 11: 166.
Sub-directorate of Arbovirosis, MOH, for
Gibbons RV, Vaughn DW. Dengue: an escalating
providing necessary information. Thanks problem. BMJ 2002; 324: 1563-6.
to Mr Irwin F Chavez for editing the final
Governor Decree of Jakarta in 2007, No.171
manuscript. SL and JK were supported by [Indonesian Language].
the Office of Higher Education Commis-
Gubler DJ. Dengue and dengue hemorrhagic
sion and Mahidol University under the fever. Semin Pediatr Infect Dis 1997; 8: 3-9.
National Research Universities Initiative.
Gubler DJ. Dengue and dengue hemorrhagic
fever. Clin Microbiol Rev 1998; 11: 480-96.
REFERENCES Gubler DJ. Epidemic dengue/dengue hemor-
Allard R. Use of time-series analysis in infec- rhagic fever as a public health, social and
tious disease surveillance. Bull World economic problem in the 21 st century.
Health Organ 1998; 76: 327-33. Trends Microbiol 2002; 10: 100-3.
Arcari P, Tapper N, Pfueller S. Regional vari- Guzman MG, Kouri G. Dengue: an update.
ability in relationships between climate Lancet Infect Dis 2002; 2: 33-42.
and dengue/DHF in Indonesia. Singapore Halstead SB. Dengue. Lancet 2007; 370: 1644-52.
J Trop Geogr 2007; 28: 251-72. Helfenstein U. Box-jenkins modelling of some
Bangs MJ, Larasati RP, Corwin AL, Wuryadi S. viral infectious diseases. Stat Med 1986;
Climatic factors associated with epidemic 5: 37-47.
dengue in Palembang, Indonesia: Implica- Kusriastuti R, Sutomo S. Evolution of dengue
tions of short-term meteorological events prevention and control programme in
216 Vol 44 No. 2 March 2013Temporal Patterns of Dengue Transmission in Jakarta
Indonesia. Dengue Bull 2005; 29: 1-7. poolsri S, White NJ, Kaewkungwal J.
Luz PM, Mendes BV, Codeco CT, Struchiner CJ, Development of temporal modelling for
Galvani AP. Time series analysis of dengue forecasting and prediction of malaria in-
incidence in Rio de Janeiro, Brazil. Am J fections using time-series and ARIMAX
Trop Med Hyg 2008; 79: 933-9. analyses: a case study in endemic districts
Martinez EZ, Silva EA. Predicting the number of Bhutan. Malar J 2010; 9: 251.
of cases of dengue infection in Ribeirao World Health Organization (WHO). Dengue:
Preto, Sao Paulo State, Brazil, using a Guidelines for diagnosis, treatment, pre-
SARIMA model. Cad Saude Publica 2011; vention and control. Geneva: WHO, 2009.
27: 1809-18. World Health Organization (WHO). Dengue.
Ministry of Health (MOH) Republic of Indone- Geneva: WHO, 2011. [Cited 2012 Feb 2].
sia. Indonesia health profile 2009. Jakarta: Available from: URL: http://www.who.int/
MOH, 2010. denguecontrol/en/index.html
Monath TP. Dengue: the risk to developed and World Health Organization. Dengue haemor-
developing countries. Proc Natl Acad Sci rhagic fever: diagnosis, treatment, preven-
USA 1994; 29; 91: 2395-400. tion and control. Geneva: WHO, 1997.
Setiati TE, Wagenaarb JFP, de Kruifb MD, World Health Organization Regional Office for
Mairuhub ATA, van Gorpb ECM, Soeman- South-East Asia (WHO SEARO). Preven-
tria A. Changing epidemiology of dengue tion and control of dengue and dengue
haemorrhagic fever in Indonesia. Dengue haemorrhagic fever. Comprehensive
Bull 2006; 30: 1-14. guidelines. New Delhi: WHO SEARO,
Silawan T, Singhasivanon P, Kaewkungwal J, 1999.
Nimmanitya S, Suwonkerd W. Temporal World Health Organization Reginal Office for
patterns and forecast of dengue infection South-East Asia (WHO SEARO). Reported
in northeastern Thailand. Southeast Asian J cases of DF/DHF in selected countries in
Trop Med Public Health 2008; 39: 90-8. SEA Region (1985-2005). New Delhi: WHO
Suwandono A, Kosasih H, Nurhayati, et al. Four SEARO, 2006. [Cited 2011 Feb 2]. Available
dengue virus serotype found circulating from: URL: http://www.searo.who.int/en/
during an outbreak of dengue fever and Section10/Section332_1101.htm
dengue haemorrhagic fever in Jakarta, Wu PC, Guo HR, Lung SC, Lin CY, Su HJ.
Indonesia, during 2004. Trans R Soc Trop Weather as an effective predictor for oc-
Med Hyg 2006; 100: 855-62 currence of dengue fever in Taiwan. Acta
Wangdi K, Singhasivanon P, Silawan T, Law- Trop 2007; 103: 50-7.
Vol 44 No. 2 March 2013 217You can also read