SWMM-CAT User's Guide - photo
←
→
Page content transcription
If your browser does not render page correctly, please read the page content below
EPA/600/R-- 14/428 | September 2014 | www.epa.gov/research

 n
                    t

            SWMM-CAT User’s Guide

                                            photo                                 photo

Office of Research and Development
Water Supply and Water Resources Division
EPA 600-R-14-428

                                                  September 2014

SWMM-CAT User’s Guide

                       by

                Lewis Rossman

     U.S. Environmental Protection Agency

      Office of Research and Development

 National Risk Management Research Laboratory

          26 Martin Luther King Drive

             Cincinnati, OH 45268

                 September 2014
DISCLAIMER
The information in this document has been funded wholly by the U.S. Environmental Protection Agency
(EPA). It has been subjected to the Agency’s peer and administrative review, and has been approved for
publication as an EPA document. Mention of trade names or commercial products does not constitute
endorsement or recommendation for use.
Although a reasonable effort has been made to assure that the results obtained are correct, the computer
programs described in this manual are experimental. Therefore the author and the U.S. Environmental
Protection Agency are not responsible and assume no liability whatsoever for any results or any use made
of the results obtained from these programs, nor for any damages or litigation that result from the use of
these programs for any purpose.
iiABSTRACT
The Storm Water Management Model Climate Adjustment Tool (SWMM-CAT) is a simple to use
software utility that allows future climate change projections to be incorporated into the Storm Water
Management Model (SWMM). SWMM was recently updated to accept a set of monthly adjustment
factors for each of these time series that could represent the impact of future changes in climatic
conditions. SWMM-CAT provides a set of location-specific adjustments that were derived from global
climate change models run as part of the World Climate Research Programme (WCRP) Coupled Model
Intercomparison Project Phase 3 (CMIP3) archive.
iiiACKNOWLEDGEMENTS
This report was written by Lewis A. Rossman, Environmental Scientist Emeritus, U.S.
Environmental Protection Agency, Cincinnati, OH. We would like to thank Dr. Rossman for his
exemplary dedication to service.
The author would like to acknowledge the assistance provided by EPA’s CREAT project team
(http://water.epa.gov/infrastructure/watersecurity/climate/creat.cfm) and Aqua Terra
Consultants (under Work Assignment 5-38 of EPA Contract #EP-C-06-029) in assembling the
climate change data used in this project.
ivACRONYMS AND ABBREVIATIONS
CAT = Climate Adjustment Tool
CMIP3 = Coupled Model Intercomparison Project Phase 3
CREAT = Climate Resilience Evaluation and Analysis Tool
EPA = United States Environmental Protection Agency
GCM = General Circulation Model
GEV = Generalized Extreme Value
IPCC = Intergovernmental Panel on Climate Change
NCDC = National Climatic Data Center
NOAA = National Oceanic and Atmospheric Administration
NWS = National Weather Service
PRISM = Parameter-elevation Regressions on Independent Slopes Model
SWAT = Soil and Water Assessment Tool
SWMM = Storm Water Management Model
WCRP = World Climate Research Programme
vTABLE OF CONTENTS
DISCLAIMER.................................................................................................................................................. ii
ABSTRACT................................................................................................................................................... iii
ACKNOWLEDGEMENTS ............................................................................................................................... iv
ACRONYMS AND ABBREVIATIONS ............................................................................................................... v
TABLE OF CONTENTS .................................................................................................................................. vi
TABLE OF FIGURES ...................................................................................................................................... vi
1. Introduction .............................................................................................................................................. 7
2. Installing SWMM-CAT .............................................................................................................................. 8
3. Running SWMM-CAT ............................................................................................................................... 9
4. Source of Climate Adjustments.............................................................................................................. 14
5. References ............................................................................................................................................. 16
TABLE OF FIGURES
Figure 1 Dialog for Registering SWMM-CAT as a SWMM Add-In Tool. ...................................................... 8
Figure 2 SWMM-CAT’s Main Window......................................................................................................... 9
Figure 3 Example of Monthly Temperature Adjustments. ....................................................................... 10
Figure 4 Example of 24-Hour Design Storm Adjustments .................................................................... .... 11
Figure 5 Dialog Box Used to Save Adjustments to SWMM ....................................................................... 12
Figure 6 SWMM’s Climatology Editor ....................................................................................................... 13
vi1. Introduction
The Storm Water Management Model Climate Adjustment Tool (SWMM-CAT) is a simple to use software
utility that allows future climate change projections to be incorporated into the Storm Water
Management Model (SWMM). SWMM is a dynamic rainfall-runoff-routing simulation model used for
single event or long-term (continuous) simulation of stormwater runoff quantity and quality from
primarily urban areas. Various versions of SWMM have been in existence since 1971 and it has been used
in thousands of hydrology and drainage system design projects.
SWMM uses externally supplied time series of the following climate-related variables in its hydrologic
calculations:
• precipitation is the primary driving force in a SWMM simulation
• evaporation determines how quickly surfaces and soils dry out between storm events
• air temperature is used to model snow melt routines and can also be used to estimate
evaporation rates.
SWMM was recently updated to accept a set of monthly adjustment factors for each of these time series
that could represent the impact of future changes in climatic conditions. Each monthly factor is used to
modify all of the user-supplied climate data for a given month. As an example, if the June adjustment
factor for precipitation was 1.3, then all June rainfall values supplied to SWMM would be multiplied by
1.3.
Although SWMM users are free to use any set of adjustment factors they want, SWMM-CAT provides a
set of location-specific adjustments that were derived from global climate change models run as part of
the World Climate Research Programme (WCRP) Coupled Model Intercomparison Project Phase 3 (CMIP3)
archive. These are the same climate change simulations that helped inform the United Nations
Intergovernmental Panel on Climate Change in preparing its Fourth Assessment report (IPCC, 2007).
Downscaled results from this archive were generated and converted into changes with respect to
historical values by another EPA project called CREAT 2.0 (Climate Resilience Evaluation and Analysis Tool)
(EPA, 2012). SWMM-CAT provides the linkage between CREAT 2.0’s downscaled climate change
estimates and the monthly adjustment factors used by SWMM.
You don’t have to run or have knowledge of SWMM to run SWMM-CAT if all you want to see are the
projected future changes in monthly air temperature and rainfall at any specific location. However if
you do want to run the two together then you must use SWMM version 5.1.007 or higher for it to
recognize the climate adjustments that SWMM-CAT passes on to it.
72. Installing SWMM-CAT
SWMM-CAT runs as a desktop application on the Windows 7 or higher operating system. It is distributed
as a zipped file named swmm-cat_001.zip (the 001 label will be updated as newer releases are made). It
can be downloaded from the following web site:
http://www2.epa.gov/water-research/swmm-cat
The zip file contains three files, swmm-cat.exe, ZedGraph.dll, and this document that should be extracted
into any folder of your choosing. You can launch SWMM-CAT independently of SWMM by double-clicking
swmm-cat.exe in Windows Explorer or by creating a shortcut to it for your Start Menu.
If you wish to run SWMM-CAT from within SWMM itself, you have to register it as an add-in tool with
SWMM. This can be done using the following steps:
1. Launch SWMM and select Tools | Configure Tools from the main menu bar.
2. Click the Add button in the Tool Options dialog that appears.
3. Fill in the Tool Properties dialog as shown in Figure 1 below. Note that this example has the
SWMM-CAT program located in the folder C:\SWMM-CAT. You can click the button to
bring up a file dialog to find its location on your machine.
Figure 1 Dialog for Registering SWMM-CAT as a SWMM Add-In Tool.
84. Click OK to close the Tool Properties dialog and then click Close on the Tool Options dialog to
close it as well.
5. SWMM-CAT is now registered with SWMM. It appears as a separate option named “Climate
Adjustment Tool” on the Tools menu which you would select to launch it from within SWMM.
3. Running SWMM-CAT
After SWMM-CAT is launched you are presented with the program’s main window shown in Figure 2. You
can find concise instructions on how to proceed on the Help tab, but we will cover these in more detail
here.
Figure 2 SWMM-CAT’s Main Window.
The first step is to identify the location you are interested in viewing adjustments for. You can either enter
its latitude and longitude coordinates (in decimal degrees separated by a comma) or its five-digit zip code.
You would then hit the Enter key or click the button to load in the CMIP3-CREAT 2.0 adjustments
that are closest to your site. Figure 3 is a screenshot showing how SWMM-CAT looks after a location has
been supplied to it:
9Bing Maps (www.bing.com/maps) is a convenient way to find the coordinates of any specific address
which can be copied and pasted into SWMM-CAT.
Figure 3 Example of Monthly Temperature Adjustments.
The Monthly Temperature tab shows the change in average air temperature by month of the year over a
future projection period. These changes are relative to the historical average monthly air temperatures
from 1971 to 2000. A choice of two future 30-year projection periods is available: a near term projection
from 2020 to 2049 and a far term projection from 2045 to 2074.
Note that for each month three different values are displayed. These reflect the variability in the outputs
of the different global climate models from which the changes were derived. The Hot/Dry values reflect
outcomes from the model that was close to both the highest annual average temperature and lowest
annual rainfall, the Warm/Wet values represent the model close to the lowest annual temperature and
highest annual rainfall, while the Median values come from the model whose results fell most closely to
the median annual temperature and rainfall. More information on how the outcomes were selected from
the CMIP3 model runs is presented in section 4 of this manual.
The Monthly Evaporation and Monthly Rainfall tabs display changes in potential monthly evaporation
rate and monthly precipitation, respectively. Changes in potential evaporation rates are expressed as
differences between the average monthly evaporation rate for bare soil computed from the Penman-
10Monteith equation for the selected projection period as compared to the historical period. The rainfall
changes are expressed as a percentage change from historical values. E.g, a 20 percent change for August
means that the average total rainfall in August over the future projection period is 20 percent higher than
over the historical record at the location being considered. A -10 percent change would mean that
average rainfall was 10 percent lower than that from the historical record.
The 24-Hour Design Storm tab shows the percent change in the highest annual 24-hour rainfall that occurs
at a given return period. Looking at Figure 4, we see that for the near term projection period under the
Warm/Wet outcome, the largest 24-hour rainfall that occurs on average once every 5 years increases by
6 percent relative to the historical value. The once in 50 year rainfall for this scenario increases by only 2
percent.
Figure 4 Example of 24-Hour Design Storm Adjustments
You can observe the numerical value of a point plotted on any of SWMM-CAT’s graphs by holding the
mouse over the point.
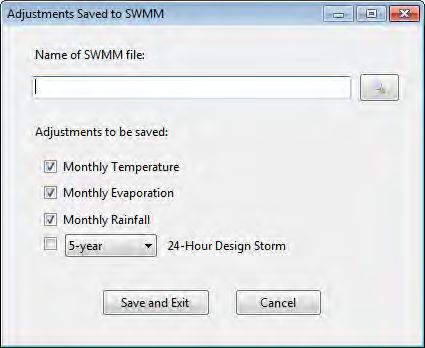
11Once you have selected a future projection period and a climate change outcome (Hot/Dry, Median or
Warm/Wet) to use, you can click the Save Adjustments to SWMM and Exit label to save the adjustments
associated with those choices to a SWMM input file. Figure 5 shows the dialog box that appears asking
for the name of an existing SWMM input file and which type of adjustments to save to it. You can click
the button to open a file selection dialog to locate your SWMM input file.
If you launched SWMM-CAT from within SWMM then the SWMM file name box will be disabled since
SWMM has created and passed in to SWMM-CAT a temporary file containing the project data you
were working on in SWMM. After SWMM-CAT closes, control is passed back to SWMM which reads
the climate adjustments from the updated input file and makes them available for editing in its
Climatology Editor (see below).
Figure 5 Dialog Box Used to Save Adjustments to SWMM
Since only one set of rainfall adjustments can be used in a SWMM project, the Monthly Rainfall and 24-
Hour Design Storm options are mutually exclusive. If you select the Design Storm option then you should
also select a return period for the adjusted storm’s magnitude from the drop down list box next to it.
12SWMM-CAT always displays temperature changes in degrees Celsius and evaporation changes in
inches/day. When saving these adjustments to a SWMM file it will automatically detect the unit
system used in the file and convert temperature to degrees Fahrenheit for US units and convert
evaporation to mm/day for SI units.
Once you click the Save and Exit button SWMM-CAT will terminate with your selected set of adjustments
saved to your SWMM input file. If you launched SWMM-CAT from within SWMM, then the SWMM
window will appear once again. At this point you can verify that the adjustments were made (or edit them
if you wish) by opening SWMM’s Climatology Editor and selecting its Adjustments tab. (To open the
editor, select Climatology from the Project Browser list box and click the button below it.) The
Climatology Editor is pictured in Figure 6 below.
Figure 6 SWMM’s Climatology Editor
134. Source of Climate Adjustments
As stated earlier, SWMM-CAT obtains its climate change scenarios and their effect on local precipitation
and temperature from another EPA project called CREAT 2.0 (Climate Resilience Evaluation and Analysis
Tool) (EPA, 2012). CREAT is a decision support tool to assist drinking water and wastewater utility owners
in understanding, evaluating and addressing climate change risks. It contains a database of climate change
effects across the US localized to a grid of 0.5 degrees in latitude and longitude (about 30 by 30 miles).
These effects include changes in monthly average precipitation, monthly average temperature, and
extreme event 24-hour rainfall amounts for each of three different climate change scenarios in two
different future time periods.
CREAT uses statistically downscaled General Circulation Model (GCM) projections from the World Climate
Research Programme (WCRP) Coupled Model Intercomparison Project Phase 3 (CMIP3) archive (Meehl et
al., 2007) as the source of its climate change data. The CMIP3 archive was chosen by CREAT because:
• it contains 112 runs from 16 internationally recognized models using several emission scenarios;
• it supported model-based analyses presented in the IPCC Fourth Assessment Report (IPCC, 2007);
• it facilitates the comparison and diagnosis of model outputs by standardizing many of the
assumptions and boundary conditions used;
• it is downscaled to appropriate spatial (regional, watershed) and temporal (monthly) scales using
a proven downscaling technique;
• it contains well-documented model output that is widely available to researchers; and
• it has a high degree of scientific credibility and the archive encompasses a broad range of
assumptions concerning demography, economic integration, technological advance, energy use,
and greenhouse gas emissions.
CREAT limited its use of CMIP3 results to the nine GCM models that were most representative of US
climate conditions and used the IPCC’s “middle of the road” projection of future economic growth. The
latter is characterized by (1) rapid economic growth, (2) global population that peaks in mid-century, (3)
the quick spread of new and efficient technologies, (4) the global convergence of income and ways of life,
and (5) a balance of both fossil fuel and non-fossil energy sources (IPCC, 2007).
Each of the nine models produces a different set of monthly results for each future year within each
downscaled ½ degree grid cell. To represent this type of uncertainty inherent in predicting future climate
conditions, CREAT defined three scenarios that span the range of results produced by the models for any
given projection year. The Warm/Wet scenario used the model that came closest to the 5th percentile of
annual temperature change and 95th percentile of annual rainfall change. The Median scenario selected
the model that was closest to the median temperature and rainfall changes. The Hot/Dry scenario used
the model that was closest to the 95th percentile temperature change and 5th percentile rainfall change.
Two different projection periods were selected: 2020 to 2049 and 2045 to 2074. The terms “warm and
hot” and “dry and wet” are used here relative to the range on overall average temperature and
14precipitation for the future forecast period. For example, dry does not always indicate a reduction in total
precipitation relative to today; it simply indicates a projected total precipitation that lies on the lower end
of the distribution of projected precipitation.
Once the model output to use for each scenario in each projection year in each grid cell was identified,
CREAT extracted its CMIP3 results to produce a database of percent changes in monthly average
precipitation and absolute changes in monthly average temperature for each scenario for each of the two
projection periods in each grid cell across the US. The historical average temperatures and precipitation
amounts that were used as a baseline to compute changes for each of these variables were obtained from
the Parameter-elevation Regressions on Independent Slopes Model (PRISM) dataset (Daly et al., 2008).
These data provided 30-year historical annual and monthly averages for each grid cell from 1971–2000.
Since it was not feasible to port the entire CREAT grid into SWMM-CAT, monthly temperature and
precipitation changes were instead associated with the National Weather Service’s (NWS) national
network of weather stations and rain gages. For each of 5,236 weather stations, average monthly
temperature changes for each future climate scenario were obtained from the CREAT grid cell nearest to
the station. Likewise, for each of 8,159 rain gages, average monthly precipitation changes were taken
from the nearest CREAT grid cell. This resulted in a set of six temperature change files, one for each
combination of projection period and climate model outcome (warm/wet, median, and hot/dry), with
5,236 records in each file and 12 fields in each record (i.e., the twelve monthly temperature changes). A
similar set of six data files for monthly precipitation changes, each with 8,159 records, was created. Thus
whenever SWMM-CAT needs to look up a set of monthly changes for a particular location it uses the
results from the nearest weather station or rain gage location stored in these files.
Changes in evaporation rate, which were not part of the CREAT database, were developed in a slightly
different manner. The Penman-Monteith algorithm was extracted from the SWAT model (Neitsch et al.,
2005), and used to compute daily potential evaporation rates for bare soil from twenty years or more of
historically recorded daily min/max air temperature at each weather station. The other meteorological
variables in the algorithm, solar radiation, relative humidity, and wind speed, were generated from data
contained in the closest SWAT reference weather station. Additional details of this calculation can be
found in the Quality Assurance Report produced for the EPA’s National Stormwater Calculator project by
Aqua Terra Consultants (Aqua Terra Consultants, 2011). From this historical time series of daily
evaporation rates monthly averages were then computed. This calculation was then repeated, after first
adjusting each historical daily max/min temperature by the CREAT temperature change for the month in
which it fell. The difference between the temperature adjusted monthly average evaporation rates and
the historical monthly average rates serve as the evaporation adjustments used by SWMM-CAT. This
process was repeated six different times for each combination of future projection period and climate
model outcome, resulting in another set of six files, each containing 5,236 records of twelve average
monthly changes in evaporation rate.
The final climate related outcome that SWMM-CAT includes is the change in the size and frequency of
intense precipitation events. CREAT considered this effect of climate change by fitting Generalized
Extreme Value (GEV) probability distributions to the collection of annual maximum daily rainfall amounts
15simulated over each future projection period by each of the three CMIP3 models selected in each grid cell.
A GEV distribution was also fit to historical daily rainfall data from 4800 stations archived by NOAA’s
National Climatic Data Center that had 30 or more years of data. From the GEV distributions, the annual
maximum 24-hour rainfall depths for return periods of 5, 10, 15, 30, 50, and 100 years were easily
calculated. These values were placed in a set of seven files, one for the historical values at each recording
station and six for the future forecasts under each climate change scenario for the CREAT grid cells nearest
to each precipitation station. SWMM-CAT uses these files to look up the station closest to the location
being analyzed to return the relative difference between the historical and future extreme value rainfall
at each return period.
5. References
Aqua Terra Consultants (2011). “Quality Assurance Project Plan – Stormwater Calculator Technical
Support.”EPA Contract #EP-C-06-029, Work Assignments #4-38 and 5-38.
Daly, C., Halbleib, M., Smith, J.I., Gibson, W.P., Doggett, M.K., Taylor, G.H., Curtis, J., and Pasteris, P.P.
(2008). “Physiographically sensitive mapping of climatological temperature and precipitation across the
conterminous United States”, Int. J. Climatol., Published online in Wiley InterScience
(www.interscience.wiley.com) DOI: 10.1002/joc.1688.
IPCC (Intergovernmental Panel on Climate Change) (2007). Climate Change 2007: Synthesis Report -
Summary for Policymakers. Available online at:
http://www.ipcc.ch/pdf/assessment-report/ar4/syr/ar4_syr.pdf
Meehl, G. A., C. Covey, T. Delworth, M. Latif, B. McAvaney, J. F. B. Mitchell, R. J. Stouffer, and K. E. Taylor.
(2007). “The WCRP CMIP3 multi-model dataset: A new era in climate change research”, Bulletin of the
American Meteorological Society, 88, 1383-1394.
Neitsch S.L., J.G. Arnold, J.R. Kiniry, and J.R. Williams (2005). “Soil and Water Assessment Tool Theoretical
Documentation.” Version 2005, Agricultural Research Service and Texas Agricultural Experiment Station,
January 2005.
U.S. Environmental Protection Agency (EPA) (2012). Climate Resilience Evaluation and Awareness Tool
Version 2 Methodology Guide, part of the CREAT Version 2.0 software available at:
http://water.epa.gov/infrastructure/watersecurity/climate/creat.cfm
16You can also read