Understanding Gender and Racial Disparities in Image Recognition Models
←
→
Page content transcription
If your browser does not render page correctly, please read the page content below
Understanding Gender and Racial Disparities in
                                                       Image Recognition Models

                                                          Rohan Mahadev                              Anindya Chakravarti
                                                   Department of Computer Science                Department of Computer Science
                                                        New York University                           New York University
                                                           New York, NY                                 New York, NY
arXiv:2107.09211v1 [cs.CV] 20 Jul 2021

                                                       rm5310@cs.nyu.edu                               ac8184@nyu.edu

                                         1   Introduction and Background

                                         Modern computer vision has been one of the most widely used and significant applications of Deep
                                         Learning, which is predicated on the availability of two essential resources: 1: Clearly annotated
                                         large sets of data, and 2: Compute power capable of processing these large datasets in a relatively
                                         fast manner. With the advent of GPUs and subsequent advancements in being able to train deep
                                         neural networks on these GPUs, the second resource was in place. Thanks to the work by [13], the
                                         ImageNet dataset proved to be the final piece of the puzzle which led to the first successful use
                                         of Deep Learning to perform image classification [1]. Since then, systems performing tasks such
                                         as image classification and face recognition have been used widely to create employee attendance
                                         tracking systems to identifying suspects. Misidentification of people due to these systems can hence
                                         have adverse effects, such as being wrongly accused of a crime.
                                         Large scale datasets such as ImageNet and Open Images [8] are costly to create. In practice, using
                                         models pretrained on these datasets often perform better [10] than training a model from scratch on a
                                         custom, smaller dataset. However, these datasets do not represent the real world scenario as can be
                                         seen from Fig. 1.

                                         Figure 1: Geographical distribution of the Open Images dataset (a), and the evaluation sets for the
                                         Inclusive Images Challenge, (b) and (c)

                                         An Automated Decision System (ADS) includes any technology that assists or replaces the judgement
                                         of human decision makers. In this report, we study and evaluate the 4th ranked solution of the
                                         Inclusive Images challenge on Kaggle. The main idea of the challenge is to develop models that do
                                         well at image classification tasks even when the data on which they are evaluated is drawn from a
                                         very different set of geographical locations than the data on which they are trained.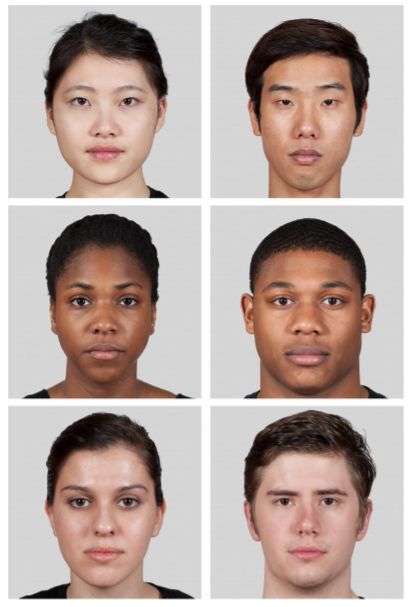
The Kaggle competition aims to reduce this disparity by using models which do well in the challenging
area of distributional skew. Developing models and methods that are robust to distributional skew is
one way to help develop models that may be more inclusive and fairer in real-world settings.
The data on which this fairer model is evaluated can be found at [11] and the model can be found at
[4].

2   Related Work

The Gender Shades study [5], shows the disparity in the classification of three commercial gender
classification algorithms tested on four subgroups of darker females, darker males, lighter females
and lighter males. The datasets which are used to train these models are overwhelmingly composed
of lighter-skinned subjects. The study finds that the classifiers perform best for lighter individuals
and males with up to 34% disparity in misclassification between lighter and darker persons. The
findings from this study provides the evidence for a need of increased demographic transparency in
automated decision systems.
The study by Zou et al [17] gives an overview of a few AI applications that systematically discriminate
against specific groups of population. Chen et al [2] argue that the fairness of predictions should be
evaluated in context of the data, and that unfairness induced by inadequate samples sizes should be
addressed through data collection, rather than by constraining the model.
The Pew Research center conducted a study [16] which shows the challenges of using machine
learning to identify gender in images. Again, they found that every model was at least somewhat
more accurate at identifying one gender than it was at the other – even though every model was
trained on equal numbers of images of women and men. Crawford and Paglen [3] also show the
inherent biases in the machine learning training sets.

3   Data Profiling

The ADS was trained on the Google Open Images V6 dataset. Open Images is a dataset of 9M
images annotated with image-level labels. These images were collected by user submissions and
manual labeling of images conducted by Google [8].
As per the holistic view of looking at data science, it is necessary to know where the data used in the
ADS comes from. The geo-diversity analysis done by [14] shows that over 32% of the data in the
Open Images dataset originates from the United States and over 60% of data originates from the six
biggest countries in North America and Europe. On the flipside, China and India contribute to only
3% of the dataset combined. The ImageNet dataset paints a similar picture.

Figure 2: Countrywise geographical distribution of the Open Images dataset (a), and the ImageNet
dataset (b)

In our view, it is therefore essential to see how fair these models are, as these models may be used in
regions of the world which have close to no representation in the dataset.

                                                  2
Figure 3: Images from the evaluation set of the Inclusive Images Challenge. These aren’t useful to
understand the fairness characteristics of the ADS.
3.1 Input, Output and Interpretation
Studying the of the evaluation set of the Inclusive Images challenge, we found it to contain more
noise than signal to be able to understand the fairness characteristics of the ADS, which can be seen
from Figure 3.
Hence, to understand the characteristics of this ADS, we chose to evaluate it over a sub-task of gender
classification. The ADS takes in an image as an input and predicts categories to which the image may
belong to, along with a confidence value. These categories could be one of 18 thousand different
labels, so we only compare the confidence levels of the predictions of the labels "Man", "Woman",
"Girl" and "Boy". For brevity, we combine the labels "Man" and "Boy" into "Male", and "Woman"
and "Girl" to "Female".
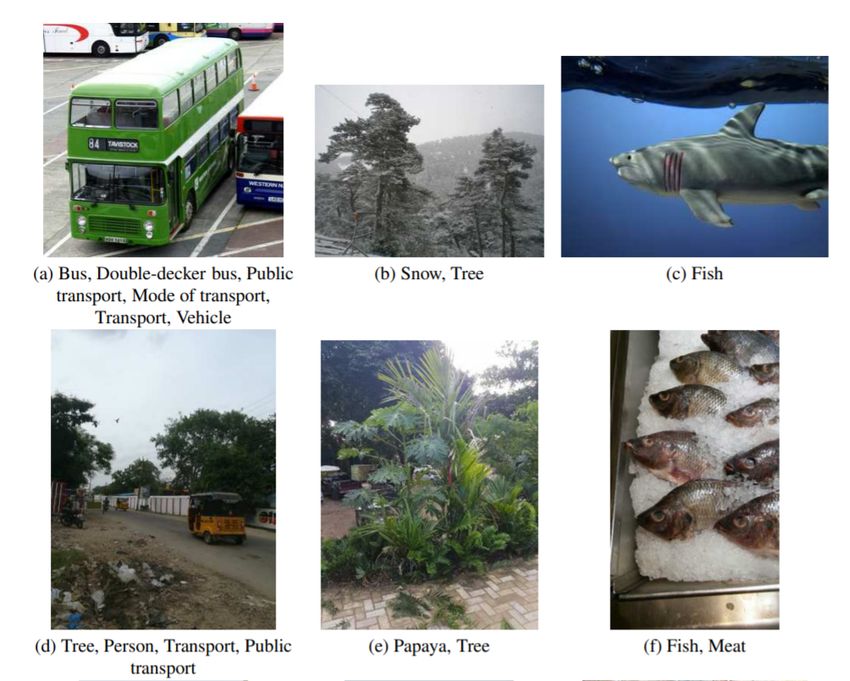
So instead of using the Kaggle evaluation set, we use the MR2 dataset, [15] which contains 74 images
of men and women of European, African and East Asian descent to predict the gender of the people
from the images. Using the race and gender of the subject in the image as protected attributes, we can
understand the fairness metrics for the ADS. It is to be noted that the gender and race in the MR2
dataset are self-identified and are not crowd-sourced.
Sex Race N Age
Female African 18 27.51(5.25)
Asian 12 25.17(4.73)
European 11 25.00(3.97)
Male African 14 27.20(5.27)
Asian 8 27.25(5.10)
European 11 26.69(3.78)
Table 1: Distribution of the MR2 dataset per sex and gender of subjects in the images
3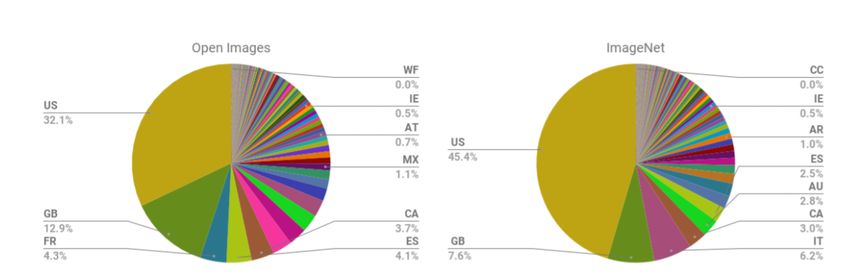
Figure 4: Sample images from each of the gender/race categories available in the MR2 database.

4     Implementation and Validation

4.1   ADS

Since the data we are dealing with are images, the pre-processing required is resizing of the images
to make them compatible with the model and normalizing the image based on the std and mean of the
training dataset.
The ADS uses a Squeeze and Excitation Resnet (se_resnet101) [6] which is a type of a Convolutional
Neural Network. In order to mitigate the problem of distributional skew, the model uses a general-
ization of softmax with cross-entropy loss as opposed to the usual binary cross-entropy loss used
in multi-label classification tasks. Further, the ADS uses the entirety of the Open Images dataset to
train this model from scratch and uses random horizontal flips and crops to augment the dataset and
provide regularization.
This ADS originally was tested on a test set provided on Kaggle which contained images from several
geographical locations. Each image has multiple ground truth labels. We will use Mean F2 score to
measure the algorithm quality. The metric is also known as the example based F-score with a beta of
2.
We however use the entirety of the MR2 dataset to predict the gender of the subjects in the image. We
call a prediction to be a misclassification if the prediction gender does not match the self-identified
gender in the dataset.

                                                  4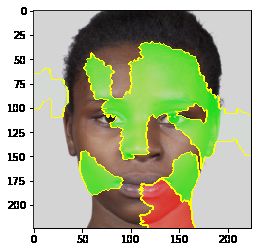
4.2     Baseline Model

To compare the difference made by the ADS model and to put the metrics into perspective, we tuned
a baseline ResNet-18 model [7] pretrained on ImageNet on CelebA [9] dataset. The CelebA dataset
contains more than 200K images of movie stars with 40 tagged attributes along with gender of the
celebrity. This model achieves around 97% accuracy on the test set of this dataset.

5     Outcomes

5.1     Accuracy and Performance

We look at Accuracy metrics and performance of the baseline model and the ADS by considering the
following protected attributes : race and sex.

5.1.1    Protected Attribute : Sex

In this section, we discuss the inclusiveness of the models when predicting the Gender of a given
image. We look at the entire dataset as a single group and look at the disparity in each of the subgroups
(based on descent).

Figure 5: FPR Difference (top-left) and Disparate Impact(top-right) for ADS and Baseline model.
Incorrect predictions for ADS and Baseline Model

The two metrics that we used to compare the models were False Positive Rate (FPR) difference and
Disparate Impact where true positive was considered when the gender was predicted correctly. The
protected gender in this case was "Female".
We can see from Fig. 5 that the baseline model performs poorly across all the groups that we
considered when compared to the ADS. Especially for "European" females where the baseline model
predicted all of the images as males and therefore the higher FPR Difference and absence from
Disparate Impact graph on the right. We can also see the ADS makes incorrect predictions for 23
images tagged female while it makes zero incorrect predictions for male images. On the other hand,
the baseline model performs poorly for both the sexes as well for the group on the whole.
Now, when looking at the performance of the ADS, we can see that it performs considerably well for
"European" images while the performance on images tagged as "African" is worse than the overall
group. This is conforming with the fact that the Open Images dataset on which the model was trained
and validated contains images taken primarily from North American and European countries.

                                                   5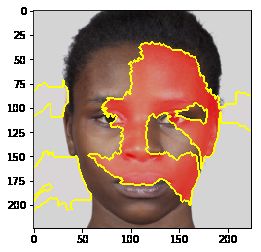
5.1.2   Protected Attribute : Race
Based on the analysis in the previous section, we know the ADS performs well for Male subset of the
data while it has poor performance for the female subset of the data. Now, we look how the model
performs for different races and look at the same fairness metrics for each.
For this analysis, we use our knowledge of the Open Images dataset distribution to define "European"
class as the privileged class and look at the other two races (Asian and African) in the dataset as
protected groups one at a time. The figure below shows the performance measures.

        Figure 6: FPR Difference with protected attribute, race, for ADS and Baseline model.

We define True Positive as the number of correct predictions for a given race. We can clearly see
form Fig. 6 that Baseline model performs poorly for the privileged class as compared to the protected
classes. But the ADS still performs worse for protected classes when compared to the privileged
class. In addition to this, the ADS also performs poorly for images tagged as "African" while it works
comparatively well on "Asian" images where the FPR difference is 0.238 for the former and 0.064
for the latter.

Figure 7: FPR Difference with protected attribute, race, for ADS and Baseline model. Female Data
only.

Deriving from the conclusions of the previous two discussions, we now consider a subset of the data
containing only images tagged as Female and measure fairness for different protected races. The
expectation is that the fairness metrics would follow the explanation from the section above and the
ADS would perform worse for images tagged to race "African". This is because the other subset of
the data (containing the Male images) has 100% accuracy for all the races. The figure below supports
this hypothesis.

                                                  6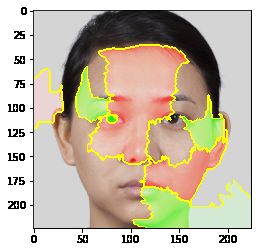
We do not compare the Disparate Impact in this section because FPR for privileged class is 1 and
hence the DI value is ∞.

5.2   Interpreting the ADS

Understanding the reasons behind why a machine learning model is important in assessing trust,
which is of the essence if a model is to be deployed for public use. To do so, we use the LIME
technique which explains the predictions of our classifier by learning an interpretable model locally
around the prediction [12]. LIME highlights pixels in an image to give an intuition as to why the
model thinks that a certain class may be present in the image.

Figure 8: LIME explanations for the ADS for females belonging to different races from the MR2
dataset. Explanation for prediction of the "Female" class (left) and explanation for prediction for the
"Male" class (right). Correct prediction : row 2.

                                                  7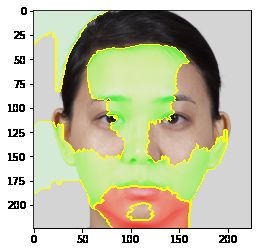
We try to interpret the explanation generated by LIME for the predictions done by the ADS. The
only correct prediction in Fig. 8 is in the second row where a European female is correctly classified.
By look at the other explanations of similar correct predictions, we believe that the classifier is
learning very general female attributes around the eyes and chin. At the same time, it seems that the
classifier is looking at the cheekbones and the background in the images (see the green patch in the
background of row 1 and 3 Male prediction explanation) to classify as image as a Male. This green
patch was present as contributing to Male classification in many of the images (correct and incorrect
predictions). It was also observed that the classifier was trying to use the hair texture to classify an
image but we couldn’t be sure of what and how it was using this.

6   Summary
There is certainly a long way to go for general image classifiers to do Image Inclusiveness across all
genders (more than binary) across all races. For this, we certainly need more balanced and robust
datasets. The stakeholders who would benefit the most with the current set of fairness metrics would
be commercial face recognition services such as the ones from IBM and Face++. Having said that,
we believe that the ADS improved certain aspects of the classification as is evident from the study
of the metrics and it’s comparison with a naive base model (with respect to the task) trained to
classify mundane objects. This is surely a good step towards more generic, accurate and fair models.
Challenges like this, from large corporations like Google certainly help in this regard and we can
hope that the models will become more robust in the future.

7   Clarifications
We would like to state we present these findings not as a criticism of the ADS but as a case-study in
the difficulty of solving the problem of distributional skew. The Inclusive Images Challenge clearly
states that the winning solutions are not necessarily fair in all aspects. There are a wide variety of
definitions of fairness and we chose one such measure based on gender identities.

                                                   8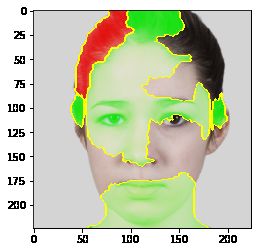
References
 [1] Krizhevsky Alex, Sutskever Ilya, and Geoffrey E Hinton. Imagenet classification with deep
     convolutional neural networks. In Advances in neural information processing systems, pages
     1097–1105, 2012.
 [2] Irene Chen, Fredrik D Johansson, and David Sontag. Why is my classifier discriminatory? In
     Advances in Neural Information Processing Systems, pages 3539–3550, 2018.
 [3] Kate Crawford and Trevor Paglen. The politics of images in machine learning training sets.
     https://www.excavating.ai/. Accessed: 2020-03-30.
 [4] Azat Davletshin. 4th place solution - inclusive-images-challenge. https://github.com/
     azat-d/inclusive-images-challenge, 2019.
 [5] Buolamwini J. Gebru T. Gender shades: Intersectional accuracy disparities in commercial
     gender classification. MIT Media Lab, 2018.
 [6] Jie Hu, Li Shen, and Gang Sun. Squeeze-and-excitation networks. In Proceedings of the IEEE
     conference on computer vision and pattern recognition, pages 7132–7141, 2018.
 [7] He Kaiming, Zhang Xiangyu, Ren Shaoqing, and Jian Sun. Deep residual learning for image
     recognition. In Proceedings of the IEEE conference on computer vision and pattern recognition,
     pages 770–778, 2016.
 [8] Alina Kuznetsova, Hassan Rom, Neil Alldrin, Jasper Uijlings, Ivan Krasin, Jordi Pont-Tuset,
     Shahab Kamali, Stefan Popov, Matteo Malloci, Alexander Kolesnikov, Tom Duerig, and Vittorio
     Ferrari. The open images dataset v4: Unified image classification, object detection, and visual
     relationship detection at scale. IJCV, 2020.
 [9] Ziwei Liu, Ping Luo, Xiaogang Wang, and Xiaoou Tang. Large-scale celebfaces attributes
     (celeba) dataset. Retrieved August, 15:2018, 2018.
[10] Maithra Raghu, Chiyuan Zhang, Jon Kleinberg, and Samy Bengio. Transfusion: Understanding
     transfer learning for medical imaging. In Advances in Neural Information Processing Systems,
     pages 3342–3352, 2019.
[11] Google Research.          Inclusive images challenge.        https://www.kaggle.com/c/
     inclusive-images-challenge/.
[12] Marco Tulio Ribeiro, Sameer Singh, and Carlos Guestrin. "why should I trust you?": Explaining
     the predictions of any classifier. In Proceedings of the 22nd ACM SIGKDD International
     Conference on Knowledge Discovery and Data Mining, San Francisco, CA, USA, August 13-17,
     2016, pages 1135–1144, 2016.
[13] Olga Russakovsky, Jia Deng, Hao Su, Jonathan Krause, Sanjeev Satheesh, Sean Ma, Zhiheng
     Huang, Andrej Karpathy, Aditya Khosla, Michael Bernstein, Alexander C. Berg, and Li Fei-Fei.
     ImageNet Large Scale Visual Recognition Challenge. International Journal of Computer Vision
     (IJCV), 115(3):211–252, 2015.
[14] Shreya Shankar, Yoni Halpern, Eric Breck, James Atwood, Jimbo Wilson, and D Sculley. No
     classification without representation: Assessing geodiversity issues in open data sets for the
     developing world. arXiv preprint arXiv:1711.08536, 2017.
[15] Nina Strohminger, Kurt Gray, Vladimir Chituc, Joseph Heffner, Chelsea Schein, and Ti-
     tus Brooks Heagins. The mr2: A multi-racial, mega-resolution database of facial stimuli.
     Behavior research methods, 48(3):1197–1204, 2016.
[16] Stefan Wojcik and Emma Remy. The challenges of using machine learning to iden-
     tify gender in images.           https://www.pewresearch.org/internet/2019/09/05/
     the-challenges-of-using-machine-learning-to-identify-gender-in-images/.
     Accessed: 2020-03-30.
[17] James Zou and Londa Schiebinger. Ai can be sexist and racist—it’s time to make it fair, 2018.

                                                 9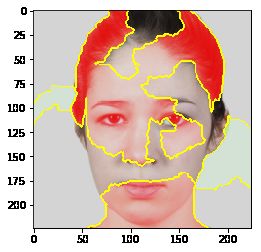
You can also read