Augmenting Adjusted Plus-Minus in Soccer with FIFA Ratings
←
→
Page content transcription
If your browser does not render page correctly, please read the page content below
Augmenting Adjusted Plus-Minus in Soccer with FIFA Ratings

                                               Francesca Matano* , Lee F. Richardson* , Taylor Pospisil* , Collin Eubanks*,** , and
                                                                                 Jining Qin*
                                                   *
                                                       Department of Statistics and Data Science, Carnegie Mellon University
arXiv:1810.08032v1 [stat.AP] 18 Oct 2018

                                                           **
                                                              Machine Learning Department, Carnegie Mellon University

                                                                                     October 19, 2018

                                                                                          Abstract
                                                      In basketball and hockey, state-of-the-art player value statistics are often variants of
                                                  Adjusted Plus-Minus (APM). But APM hasn’t had the same impact in soccer, since
                                                  soccer games are low scoring with a low number of substitutions. In soccer, perhaps
                                                  the most comprehensive player value statistics come from video games, and in particular
                                                  FIFA. FIFA ratings combine the subjective evaluations of over 9000 scouts, coaches, and
                                                  season-ticket holders into ratings for over 18,000 players. This paper combines FIFA
                                                  ratings and APM into a single metric, which we call Augmented APM. The key idea is
                                                  recasting APM into a Bayesian framework, and incorporating FIFA ratings into the prior
                                                  distribution. We show that Augmented APM predicts better than both standard APM
                                                  and a model using only FIFA ratings. We also show that Augmented APM decorrelates
                                                  players that are highly collinear.

                                           1     Introduction
                                           Decision making in sports typically requires player comparison. For example, teams decide
                                           which players to draft, who to offer a contract, etc. While not a panacea, one-number statis-
                                           tics of individual player value are useful decision making tools. With one-number statistics,
                                           teams can quickly rank free agents, evaluate trades, simulate future outcomes, and more.
                                               In basketball and hockey, the best one-number statistics are typically variants of Adjusted
                                           Plus-Minus (APM). APM is a regression technique that measures each players contribution
                                           to winning, while controlling for the quality of teammates and opponents.
                                               While unadjusted plus-minus has existed since the 1950’s, adjusted plus minus was first
                                           used by Wayne Winston and Jeff Sagarin while consulting for the Dallas Mavericks (Leon-
                                           hardt (2003)). The first public APM calculation is due to Rosenbaum (2004), followed shortly
                                           after by Ilardi and Barzilai (2008), who separated APM into offensive and defensive com-
                                           ponents. The next big advance was Sill (2010), who replaced linear regression with ridge
                                           regression, and validated the improvement through out-of-sample predictions. APM is now
                                           mainstream in basketball; ESPN produces a “Real Plus-Minus” (RPM) statistic on their
                                           website (Illardi (2014)), and the RPM co-creator Jeremias Engelmann has written a book
                                           chapter on the subject (Engelmann (2017)). Recently, APM in basketball was extended to

                                                                                               1
a “win-probability” framework (Deshpande and Jensen (2016)), which removes the effects of
“garbage time” minutes.
APM appeared in hockey shortly after basketball, with a series of papers by Brian Mac-
donald (Macdonald (2011b,a, 2012b,a)). Since then, many variants have been proposed that
adapt to the specifics of hockey. Schuckers and Curro (2013) proposed the “Total Hockey
Rating” (THoR), which models not only shots, but also events such as turnovers. Gramacy
et al. (2013) uses logistic regression to model the probability of a goal scoring event, and
Thomas et al. (2013) uses hazard functions to model separate goal scoring processes for each
team.
Compared with basketball and hockey, APM hasn’t had a substantial impact in soccer.
Since soccer has a low number of substitutions and a low number of scoring chances (see Figure
1), standard APM has issues with collinearity and a sparse response variable. Two players
who are almost always on the pitch together (consider two backs) will be indistinguishable to
the APM model, since almost all of the segments which they play have been shared. Likewise,
even for segments where one of these two backs is absent, we only observe a potentially small
goal differential.
106
15 20
Average Scoring / Game
2.8
1 3
2.6
30 40
# Substitutions / Game
Figure 1: APM in basketball, hockey, and soccer, depends on the amount of scoring and
substitutions. APM works best in basketball, which has by far the most scoring out of the
three sports. Hockey has much less scoring than basketball, but has the most substitutions.
Compared with hockey and basketball, soccer has both low scoring and low substitutions.
This is the fundamental reason why APM is difficult in soccer.
2That said, several authors have proposed versions of APM for soccer. ClimbingTheLadder
(2009) first produced unweighted plus-minus statistics for the MLS in 2009. Bohrmann (2011)
calculated adjusted plus-minus for the English Premier League in 2011, and cited Rosenbaum
(2004), further demonstrating the cross-sport impact of APM. Hamilton (2014) gives a de-
tailed calculation of APM in soccer, questions its utility, but concludes on an optimistic note,
saying “Adjusted plus/minus in football could become a valuable metric over time, but it
will require a lot of care in its formulation, implementation, and interpretation.” The first
academic article on APM in soccer was Kharrat et al. (2017), who imports some of the best
ideas from hockey and basketball into soccer.
But, APM isn’t the only way to compute one-number statistic. One popular alternative
is video game ratings, for example from FIFA. FIFA provides ratings for over 18,000 players
using the subjective evaluations of over 9,000 data-reviewers, who consist of coaches, scouts,
and season ticket holders (Lindberg (2016)). FIFA ratings are widely respected, and have
recently been used to quantify the value of positions in soccer (Pelechrinis and Winston
(2018)). In some sense, FIFA ratings are the epitome of the “Intraocular”, or “eye test”.
So, APM works well in basketball and hockey, but not soccer, and in soccer, FIFA ratings
are respected one-number statistics. Putting it together, we propose Augmented APM, a
Bayesian regression approach that combines FIFA ratings with APM.
The rest of this paper is organized as follows. Section 2 details the Augmented APM
model, Section 3 describes the data we use, Section 4 summarizes our results, and Section 5
concludes with a brief discussion.
2 Methodology
We extend the standard Adjusted Plus-Minus (APM) model, which solves the following ridge
regression problem:
β̂ = arg min ||y − Xβ||22 + λ||β||22 (1)
β
We can recast this ridge regression problem as a maximum a posterior estimate from a
Bayesian model
y|β ∼ N (Xβ, σ 2 )
β ∼ N (0, τ 2 ) (2)
for particular σ and τ values. This recasting into a Bayesian framework gives us several
advantages:
• The tuning parameters become easier to fit and interpret. Under the optimization
framework (Equation 1), we use cross-validation to select an appropriate value of λ that
minimizes prediction error. Under a Bayesian interpretation, the similar parameter τ
can be interpreted as the standard deviation of player abilities. This can either be
selected intuitively (for the following results we set the values at τ = 0.1 and σ = 1) or
given a hyperprior that specifies a wider range of plausible values.
3• We can obtain uncertainties for our estimates of β by sampling from the posterior
distribution. Many presentations of plus-minus scores neglect to publish measures of
uncertainty in the estimates. This is particularly important in the context of comparing
players as it’s desirable to know whether differences in players reflect true differences
in performance or simply a noisy estimation procedure. Likewise, we can express un-
certainty in player rankings by drawing from the joint posterior for betas.
• We can easily extend the model to accommodate further information. We discuss two
particular extensions of this model: including FIFA ratings and time-weighted segments.
However, this does not exhaust the potential flexibility of these models, which are often
easy to fit using standard Bayesian software (Carpenter et al. (2017)).
We take advantage of the last point to incorporate subjective ratings into the model. One
problem with the traditional ridge penalty for players is that it assumes all players should be
regularized towards zero: the effect of the “average” player. This is implicit in the prior which
sets the prior mean for all players β coefficients to be zero. But intuitively, priors should be
different for more or less talented players: we would expect Lionel Messi to perform better
than your typical player. Determining these prior values, however, could be difficult.
We can, however, use subjective assessments such as FIFA scores as an approximation
for this prior. The Augmented APM model has the following multi-level form:
y|β ∼ N (Xβ, σ 2 )
β|α ∼ N (α × rating, τ 2 )
α ∼ N (µα , σα2 ) (3)
Equation 3 is a hierarchical model where the “prior” for player ratings is no longer zeroed,
and is instead centered at a scaled value of their subjective ratings score. We shift the ratings
so that they have mean zero, which means that the β values can still be interpreted as an
effect compared to the “average” player (in the sense of having the average FIFA rating).
This model allows us to distinguish between players who are perfectly collinear in the
existing data set. While under a ridge regression model both players would receive the
same attribution of credit for game results, the Augmented APM model gives the higher
subjectively rated player a greater share of the credit.
We also can introduce “weights” for the time length of a segment. Intuitively a longer
segment will produce larger responses: scaling both the magnitude and variance of the dif-
ferential y. To accommodate these effects we simply introduce the time of the segment into
the model
y|β ∼ N (tXβ, tσ 2 )
β ∼ N (0, τ 2 ). (4)
This can be achieved in the standard −1
√ APM optimization problem by estimating yt and
introducing weights proportional to t.
4Figure 2: Play-by-play data, after pre-processing, for an example game between Manchester
City and Liverpool. Each row corresponds to a game segment where no substitutions take
place. The response variable is the goal differential in that game segment. Each player has
a column, which is 1 when the player plays for the home team, -1 for the away team, and 0
if the player is not playing.
3 Data
We fit and evaluate our models on three English Premier League (EPL) seasons: 2015-16,
2016-17, and 2017-18. To fit these models, need two sources of data: play-by-play and FIFA
ratings. Play-by-play data records all events (e.g. goals, substitutions) in a game. We convert
this play-by-play data into a matrix where each row corresponds to a game segment without
any substitutions. An example is shown in Figure 2.
We collect preseason FIFA ratings for each EPL season. The preseason FIFA ratings are
typically released in late August of each year, on the website sofifa.com. While FIFA rates
many player characteristics, such as speed and agility, this paper keeps things simple, and
only uses each players overall rating.
4 Results
This section compares our Augmented APM model against the models listed in Table 1. We
use a criteria similar to Sill (2010), in that we measure each models ability to predict out-
of-sample game results. Game result predictions are simply the sum of predictions for each
game segment (e.g. each row of Figure 2). Our accuracy is the mean squared error (MSE)
of the sum of predicted game segments with the actual game results.
Figure 3 compares the models in each season using 10 fold cross-validation. Our Aug-
5Model Description
Zero A naive model that predicts every game segment will
have a 0 goal differential.
Intercept A naive model that predicts every game segment will
have the average home advantage point differential
(learned on training data).
FIFA Uses the difference in teams overall FIFA ratings as predictors
APM Standard ridge regression APM (Equation 1)
Augmented APM Equation 3 of Section 2
Table 1: The five models we compare in this paper.
mented APM model has the best predictive accuracy. The FIFA only model improves on the
intercept model, which shows that FIFA ratings are a valuable predictor. We were surprised,
however, that standard APM out-predicts the FIFA only model in 2015 and 2017, due to the
limitations of APM in soccer discussed in the introduction.
Figure 3: The MSE of our models in three EPL seasons using 10 fold cross-validation.
We were also interesting in how our models performed at different times in the season.
Intuitively, we expected that FIFA would predict better in the beginning of the season, and
APM would predict better at the end of the season. To test this, we trained each model with
all data up until a particular month, then predicted game results for the next two months.
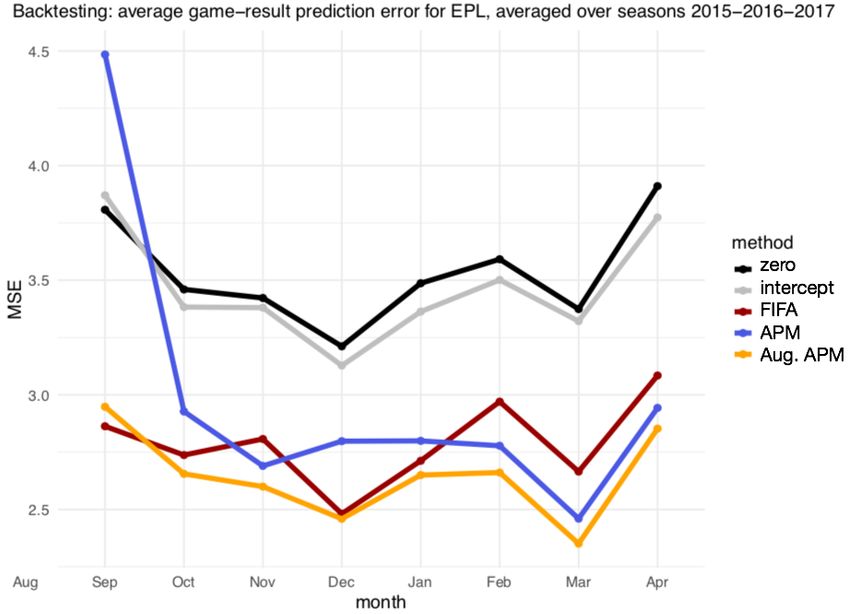
6The results of this are shown in Figure 4, which demonstrates that FIFA starts the season
as the best predictor, and both APM and Augmented APM out-predict FIFA by February.
This suggests APM picks us useful information over the course of the season.
Figure 4: The MSE of each model over the course of the season. We train our models all
data up until a month, then measure the prediction error over the next two months. The
MSE for each month is averaged across the three seasons in our dataset.
Adjusted Plus-Minus models are often validated by an “Intraocular” test, in that, it’s
better if the results make intuitive sense to soccer fans. Here, we expect the FIFA ratings to
be very helpful. Figure 5 compares the top 15 players from the APM and Augmented APM
models in the 2017-18 season. As expected, Augmented APM gives higher value to players
with higher FIFA ratings. We also see that Mohamed Salah, the EPL player of the year,
ranks first in the APM model, and fourth in the Augmented APM model. This is a good
sign for the intraocular test.
Finally, an additional benefit of Augmented APM is that it “de-correlates” players who
play most of their minutes together. To show this, Figure 5 shows that players on Manchester
City and Manchester United “cluster” together in the APM model. While some clustering
still occurs in the Augmented APM ratings, it is less pronounced, since now players on the
same team must also have similar FIFA ratings.
7Figure 5: The top 15 players from the standard APM model (Left) compared with our
Augmented APM model (Right). For the Augmented APM rankings, we color players with
higher-than-APM ratings in green, and players with lower-than-APM ratings in red.
5 Discussion
This paper introduces Augmented APM, which incorporates FIFA ratings into the standard
APM framework. The key idea was recasting APM into a Bayesian framework, then incorpo-
rating FIFA ratings into the prior distribution. We showed that Augmented APM has better
out-of-sample prediction accuracy than models using only FIFA ratings, and standard APM.
In addition, Augmented APM helps “de-correlate” players that play the majority of their
minutes together.
There are many directions for future work. One direction is simply adding more data and
seasons into our estimates. This would allow us to rank players across leagues, especially if
we used cross-league tournament data. Another direction we tried to include in this project
is using “Expected Goals” instead of goal differential as the response variable. Unfortunately,
our play-by-play data was too coarse, and our expected goals model did not boost our pre-
dictive accuracy. This is certainly an area where player tracking data would help. Finally,
nothing conceptually prevents extending Augmented APM to other sports.
We make both the software to generate the results, and the final results, available online.
The software is in two separate R-packages:
• PlusMinusModels. R-package that fits the Augmented APM and APM models.
• apm. R-package that scrapes play-by-play data, FIFA ratings, and prepares the for
modeling.
The modeling results are available as sortable tables online at www.intraocular.net/apm.
8References
Bohrmann, F. (2011). Problems with ad Adjusted Plus Minus Met-
ric in Football. http://www.soccerstatistically.com/blog/2011/12/28/
problems-with-an-adjusted-plus-minus-metric-in-football.html. [Online].
Carpenter, B., Gelman, A., Hoffman, M. D., Lee, D., Goodrich, B., Betancourt, M., Brubaker,
M., Guo, J., Li, P., and Riddell, A. (2017). Stan: A probabilistic programming language.
Journal of statistical software, 76(1).
ClimbingTheLadder (2009). MLS 2009 Plus/Minus Data. http://usasoccer.blogspot.
com/2009/12/mls-2009-plusminus-data.html. [Online].
Deshpande, S. K. and Jensen, S. T. (2016). Estimating an nba players impact on his teams
chances of winning. Journal of Quantitative Analysis in Sports, 12(2):51–72.
Engelmann, J. (2017). Possession-based player performance analysis in basketball
(adjusted+/–and related concepts). In Handbook of Statistical Methods and Analyses in
Sports, pages 231–244. Chapman and Hall/CRC.
Gramacy, R. B., Jensen, S. T., and Taddy, M. (2013). Estimating player contribution in
hockey with regularized logistic regression. Journal of Quantitative Analysis in Sports,
9(1):97–111.
Hamilton, H. (2014). Adjusted Plus/Minus in football why its hard, and
why its probably useless. http://www.soccermetrics.net/player-performance/
adjusted-plus-minus-deep-analysis. [Online].
Ilardi, S. and Barzilai, A. (2008). Adjusted plus-minus ratings: New and improved for 2007-
2008. URL http://www. 82games. com/ilardi2. htm.
Illardi, S. (2014). The next big thing: real plus-minus. http://www.espn.com/nba/story/
_/id/10740818/introducing-real-plus-minus. [Online].
Kharrat, T., Pena, J. L., and McHale, I. (2017). Plus-minus player ratings for soccer.
Leonhardt, D. (2003). PRO BASKETBALL; Mavericks’ New Math May
Be an Added Edge. https://www.nytimes.com/2003/04/27/sports/
pro-basketball-mavericks-new-math-may-be-an-added-edge.html. [Online].
Lindberg, A. (2016). FIFA 17’s player ratings system blends advanced stats and subjec-
tive scouting. http://www.espn.com/soccer/blog/espn-fc-united/68/post/2959703/
fifa-17-player-ratings-system-blends-advanced-stats-and-subjective-scouting.
[Online].
Macdonald, B. (2011a). An improved adjusted plus-minus statistic for nhl players. In Pro-
ceedings of the MIT Sloan Sports Analytics Conference, volume 3.
Macdonald, B. (2011b). A regression-based adjusted plus-minus statistic for nhl players.
Journal of Quantitative Analysis in Sports, 7(3).
9Macdonald, B. (2012a). Adjusted plus-minus for nhl players using ridge regression with goals,
shots, fenwick, and corsi. Journal of Quantitative Analysis in Sports, 8(3).
Macdonald, B. (2012b). An expected goals model for evaluating nhl teams and players.
In Proceedings of the 2012 MIT Sloan Sports Analytics Conference, http://www. sloans-
portsconference. com.
Pelechrinis, K. and Winston, W. (2018). Positional value in soccer: Expected league points
added above replacement. arXiv preprint arXiv:1807.07536.
Rosenbaum, D. T. (2004). Measuring how nba players help their teams win. 82Games. com
(http://www. 82games. com/comm30. htm), pages 4–30.
Schuckers, M. and Curro, J. (2013). Total hockey rating (thor): A comprehensive statistical
rating of national hockey league forwards and defensemen based upon all on-ice events. In
7th annual MIT sloan sports analytics conference.
Sill, J. (2010). Improved nba adjusted+/-using regularization and out-of-sample testing. In
Proceedings of the 2010 MIT Sloan Sports Analytics Conference.
Thomas, A., Ventura, S. L., Jensen, S. T., and Ma, S. (2013). Competing process hazard
function models for player ratings in ice hockey. The Annals of Applied Statistics, pages
1497–1524.
10You can also read