N E W Exciting new features Impedance Spectroscopy - LSR - Linseis ...
←
→
Page content transcription
If your browser does not render page correctly, please read the page content below
T H E R M A L   A N A L Y S I S

SEEBECK COEFFICIENT LSR
ELECTRIC RESISTANCE
   ZT-MEASUREMENT                      E  W
                                    N
                                    ew fea
                                          t u re s includi
                                                      s and
                                                           ng
                                    gn             nt
                            Excitin    m e a sureme opy
                                     n              c
                              Harma nce Spectros
                                     d a
                                Impe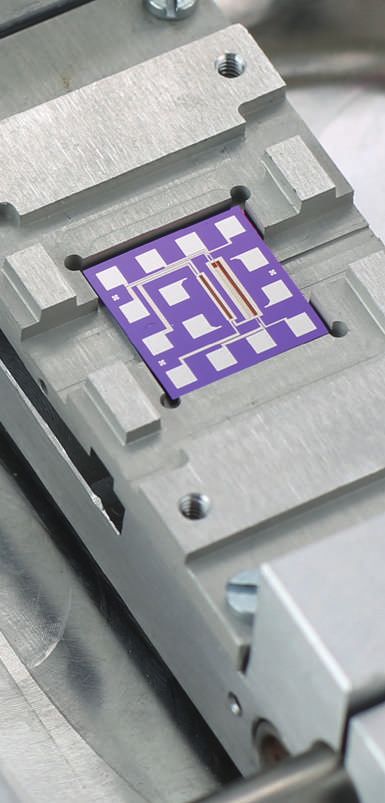
Since 1957 LINSEIS Corporation has been deliv-
ering outstanding service, know how and lead-
ing innovative products in the field of thermal
analysis and thermo physical properties.

Customer satisfaction, innovation, flexibility
and high quality are what LINSEIS represents.
Thanks to these fundamentals, our company
enjoys an exceptional reputation among the
leading scientific and industrial organizations.
LINSEIS has been offering highly innovative
benchmark products for many years.

The LINSEIS business unit of thermal analysis
is involved in the complete range of thermo
                                                     Claus Linseis
analytical equipment for R&D as well as qual-        Managing Director
ity control. We support applications in sectors
such as polymers, chemical industry, inorganic
building materials and environmental analytics.
In addition, thermo physical properties of solids,
liquids and melts can be analyzed.

LINSEIS provides technological leadership. We
develop and manufacture thermo analytic and
thermo physical testing equipment to the high-
est standards and precision. Due to our innova-
tive drive and precision, we are a leading manu-
facturer of thermal Analysis equipment.

The development of thermo analytical testing
machines requires significant research and a
high degree of precision. LINSEIS Corp. invests
in this research to the benefit of our customers.

2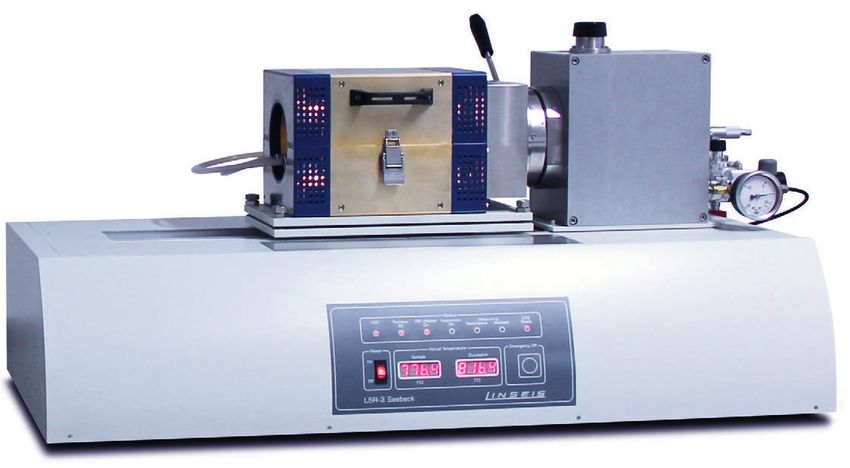
German engineering                                    Innovation
The strive for the best due diligence and ac-         We want to deliver the latest and best tech-
countability is part of our DNA. Our history is af-   nology for our customers. LINSEIS continues
fected by German engineering and strict quality       to innovate and enhance our existing thermal
control.                                              analyzers. Our goal is constantly develop new
                                                      technologies to enable continued discovery in
                                                      Science.

                                                                                                      3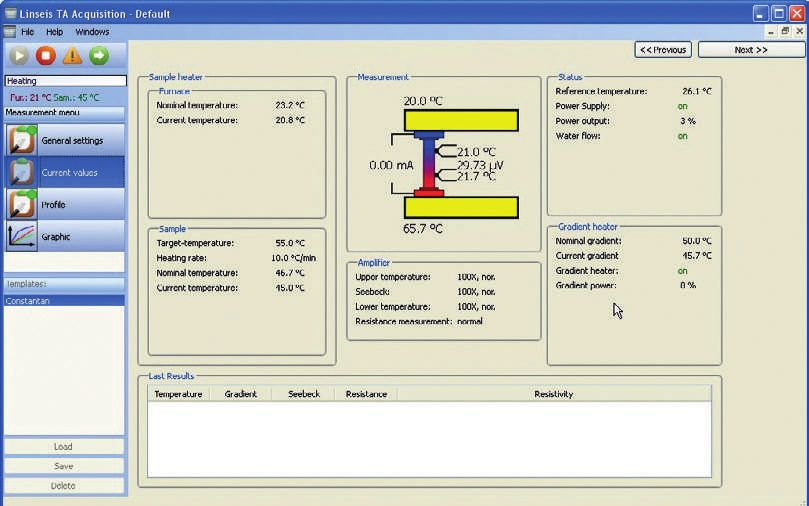
GENERAL

The thermal power, thermoelectric power or        and combustion systems could save billions of
Seebeck coefficient of a material measures the    dollars if it could be captured and converted
magnitude of an induced thermoelectric vol-       into electricity via thermoelectric devices.
tage in response to a temperature difference      For the challenging task of thermoelectric mate-
across that material. The thermal power has       rial characterization, LINSEIS has developed the
units of (V/K).                                   unique LSR-4 Seebeck and Electric Resistivity
In recent years, much interest has been shown     unit, which is an advanced version of the well
in various methods of direct conversion of heat   known LINSEIS LSR-3.
into electricity. Waste heat from hot engines

4
Electric field / Flow of charge carriers / ∆T

                   hot side                                                              cold side
                     V+                                                                     V-
                    +Q                              n-type                                 -Q

                                                       Vth

LINSEIS metrology for ther-                                  the resistivity, it can be simply calculated from the
moelectrics                                                  measured data using the formula: s=       1
                                                                                                       r   follows
To enable advanced research in the field of ther-            the electrical conductivity s.
moelectrics, LINSEIS offers a complete range of
instruments for this demanding task. The instru-             Features
ments available invole LSR 3/4 for Seebeck co-               The LSR - 3 can simultaneous measure both,
efficient and Electric Resistivity measurements,             Seebeck coefficient and electric resistance (Re-
HCS for Hall Effect determination, LFA (Laser- /             sistivity) and offers the following features:
Light Flash Analyzer) for thermal diffusivity and            • Prism, square and cylindrical samples with a
thermal conductivity measurements as well as                  length between 6 to 22mm can be analyzed
Dilatometer for thermal expansion and density                • Thin films and foils can be analyzed with a
and Differential Scanning Calorimeters (DSC) for              unique measurement adapter
Specific Heat (cp) measurement.                              • Three different exchangeable furnaces cover
                                                              the temperature range from -100 up to 1500°C
This broad range of instruments allows a com-                • The design of the sample holder guarantees
plete thermoelectric characterization of promis-              highest measurement reproducibility
ing thermoelectric materials and thus the calcu-             • State of the art 32-Bit software enables auto-
lation of the dimensionless figure of merrit ZT,              matic measurement procedures
which is mostly used for the comparison of the               • Measurement data can be easily exported
thermoelectric conversion efficiency.
ZT= S
        2
            •s•T
              l
                                                             Optional LSR 4 upgrade
Seebeck Coefficient; [S] = μV/K                              In extension to the successfull LSR-3 unit, the
Electrical Conductivity; [s] = 1/Ωm
Thermal Conductivity; [l] = W/mK
                                                             LSR-4 includes the Harman option for the direct
LINSEIS LSR                                                  determination of the dimensionless figure of
The LINSEIS LSR allows the simultaneous deter-               merit ZT. This powerful integrated setup (patent
mination of the Seebeck coefficient (S) and elec-            pending) allows not only the direct ZT measur-
trical resistivity (r) of a bulk or thin film sample         ment, but also the calculation of the thermal
material over a broad temperature range. As the              conductivity (l) with the existing system. More
electrical conductivity is the reciprocal value of           details can be found on page 8.

                                                                                                                     5
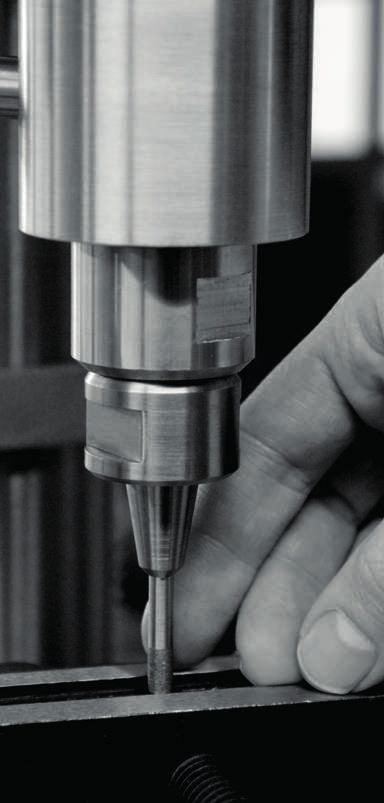
PRINCIPLES OF
MEASUREMENT
Seebeck Coefficient

A sample of cylindrical, square or prism shape                     = T2 − T1) between the hot side and the cold side
is vertically positioned between two electrodes.                   of the sample. In addition, one wire of each of
The lower electrode block (and optional also the                   the two thermocouples is used to measure the
upper electrode block for a temperature gradi-                     occuring electromotive force dE (respectively
ent inversion) contains a heater, while the entire                 Thermovoltage Vth). A unique spring based
measuring arrangement is located in a furnace,                     thermocouple mechanism permits best possi-
which heats the sample to a specified tempera-                     ble electric contacts and thus highest accuracy
ture.                                                              measurements.

At this temperature, the secondary heater in the                   From the obtained data, the Seebeck coefficient
lower electrode block creates a set temperature                    can easly be calculated with the formula:
                                                                        -Vth
gradient. Two contacting thermocouples T1 and                      S=   ∆T
                                                                               .
T2 then measure the temperature difference (∆T

    Mode: Seebeck coefficient measurement                                                               -Vth
                                                                                                     S= T -T
              upper gradient heater (optional)                                                           2 1

                                  upper
                                  probe-thermocouple measures T1

              Vth

                                  lower
                                  probe-thermocouple measures T2

                    lower gradient heater

6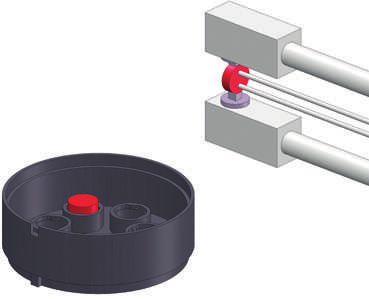
Electric Resistivity / Electric Conductivity measurement
For the determination of the samples electric From the obtained data, and with the knowl-
resistance, the dc four terminal method is used, edge of the probe distance as well as cross-sec-
which allows to neglegt parasitic effects, like tional sample area, the resistivity and conduc-
contact or wire resitances. For the measure- tivity can easily be calculated using the formula:
U A 1
ment, a constant current (IDC) is applied through r= I • L and s = r
the upper and lower electrode and the corre-
sponding voltage drop (VΩ) along the sample is
measured between one wire at each of the two
thermocouples.
Mode: resistivity measurement V A
r= IΩ • t
DC
upper
electrode
upper
probe-thermocouple
IDC VΩ t
lower
probe-thermocouple
cross-sectional
lower
area A
electrode
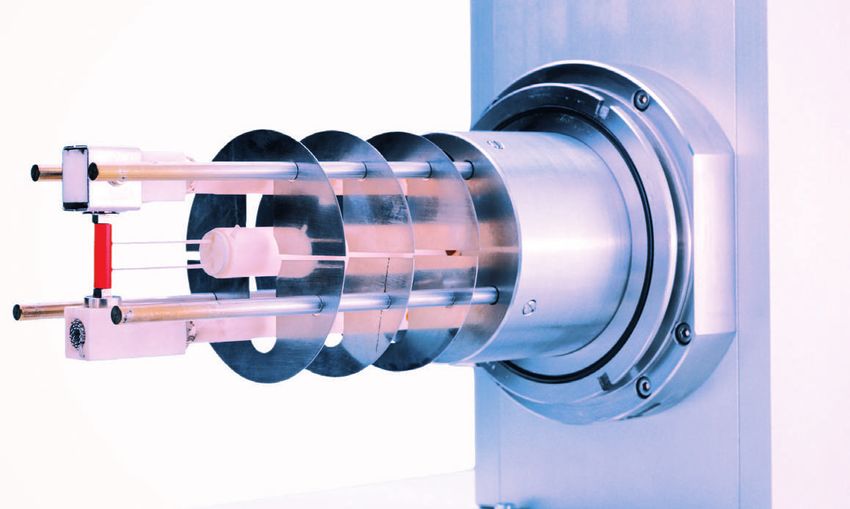
Schematic of the LINSEIS Standard LSR measurement system
7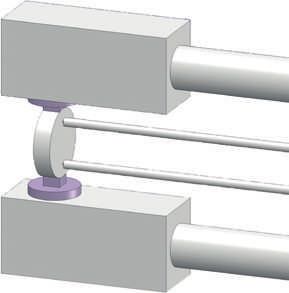
Direct ZT measurement (Harman / Impedance Spectroscopy)

The Harman method assesses the thermoelec-                    ment of the initial voltage drop (ohmic part
tric figure-of-merit ZT of a material based on                without heating) and the steady state voltage
its voltage responses to a direct current (DC)                drop (including thermovoltage) the dimension-
applied to the sample. When an external cur-                  less figure of merrit ZT (and from this also the
rent is driven through a thermoelectric sample                thermal conductivity l) can be calculated.
located between the two needle contacts, local                ZT = Vth
                                                                       VΩ
heating / cooling will occur at the intersection              Unlike the separate measurements of S, r, and
between the sample and the copper part be-                    l, the Harman method requires only a single ap-
cause of the thermoelectric peltier effect. As a              paratus and a single sample preparation, hence
consequence of this and the nearly adiabatic                  essentially involves smaller uncertainties in the
boundary conditions, a characteristic tem-                    measurements. Adversely, the possible temper-
perature profile (temperature gradient) will be               ature range of this add on is only possible until
achieved over the sample. From the measure-                   400°C.

    Mode: Harman                                                                                  V
                                                                                              ZT= Vth
                                                                                                    Ω

              upper
           electrode

                                   screw for holding the Harman part
                      upper
                  copper part   µm-voltage probe

          IDC          VΩ/th

                      lower     µm-voltage probe
                  copper part
                                   screw for fixing the Harman part

               lower
           electrode

                                                                                              Harman Method

8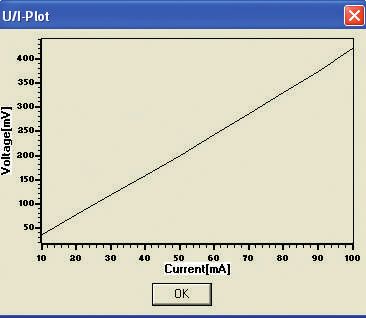
Impedance spectroscopy

In extension to the steady state Harman meth-                                    like Peltier Elements or Thermoelectric Genera-
od, the Linseis LSR-4 unite can be equipped with                                 tors (TEG). The evaluation of measurment data
our unique LSR-AC electronics, which allows the                                  if fulfilled according to the Canadas model and
implementation of a impedance spectroscopy.                                      can be adapted to a variety of different module
Thus, the direct ZT measurement is not only                                      designs.
possible for single legs, but also of modules,

Thermoelectric Leg                                                               Thermoelectric module
                     9.0                                                                         3.0                      0.4
                     8.0                                                                                                  0.3
                                                                                                 2.5
                     7.0                                                                                                  0.2

                     6.0                                                                         2.0                      0.1
          -Z“ [mΩ]

                                                                                         -Z“ [mΩ]

                     5.0                                                                                                   0
                                                                                                                            4.2       4.3         4.4         4.5
                                                                                                 1.5
                     4.0
                     3.0                                                                         1.0
                     2.0
                                                                                                 0.5
                     1.0
                       0                                                                            0
                       436        438       440        442     444                                  4.0     4.5     5.0      5.5      6.0         6.5          7.0
                                             Z´ [mΩ]                                                                       Z´ [mΩ]

                 3.0                                                                            3.0

                 2.5                                                                            2.5
                                                                                     -Z“ [mΩ]

                                                                                                2.0
      -Z“ [mΩ]

                 2.0

                 1.5                                                                            1.5

                 1.0                                                                            1.0

                 0.5                                                                            0.5

                     0                                                                              0
                      84     85     86     87     88    89   90      91                              645   646    647     648   649         650         651    652
                                            Z´ [mΩ]                                                                        Z´ [mΩ]

Fitting parameters and extracted thermal properties

Sample                     R (Ω) RTE (Ω)      wTE (rad/s) CTE (F) lTE (W/mK)     aTE (cm2/s)               CpTE (J/gK)      S (µV/K)          RC (Ω)           wC (rad/s)

Element                    0.084 0.0058 2.0                  86.21        1.27   0.013                     0.13             —                 —                —
module                     4.292 2.585 0.24                  1.61         1.60   0.0013                    1.56             191.5             0.149            6.08

* García-Cañadas, Jorge, and Gao Min. „Impedance spectroscopy models for the complete characterization of thermoelectric mate-
rials.“ Journal of Applied Physics 116.17 (2014): 174510.

                                                                                                                                                                            9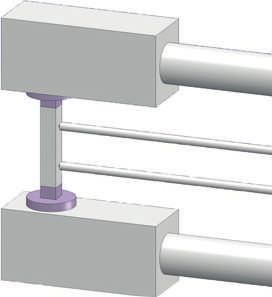
POSSIBLE SAMPLE
GEOMETRIES
The LSR instrument can handle 3 different sam-     While rod and bar shaped samples are the typi-
ple geometries, rod shaped, (up to ø 6 mm x 23     cal configuration for thermoelectric legs in gen-
mm height) bar shaped (square footprint up to      erators (TEG), the disc shaped samples can not
6 mm and 23 mm height) or disc shaped (10          only be characterized in the LSR Seebeck & Elec-
mm, 12.7 mm or 25.4 mm). The samples foot-         tric Resistivity Analyzer, but also in the Linseis
print should ideally be smaller than or equal to   LFA Laser/Light Flash System for the thermal
the electrodes surface size, as a 1-dimensional    conductivity measurement without further pro-
current flow and heat flux through the sample is   cessing necessary.
required for an accurate measurement.

                                                                          LSR

                                                                                LFA

10
THIN FILM ADAPTER
Free Standing Films and Foils
gradient heater 1 gradient heater 1
upper
electrode
upper
electrode
flexible thinfilm thinfilm on substrate
upper probe-thermocouple upper probe-thermocouple
thinfilm adapter thinfilm adapter
lower probe-thermocouple lower probe-thermocouple
lower
electrode
lower
electrode
gradient heater 2 gradient heater 2
In recent years, there has been increasing inter- and foils or coatings on a substrate. Thanks to
est in research on nanostructered samples like the unique design of the sample holders, sam-
thin films or nanowires due to their considerable ple preparation restrictions could be limited
different properties compared to bulk material. to an absolute minimum and a broad range
In order to meet the requirements of todays re- of samples, respectively smaples on substrate
search, LINSEIS developed two different sample combinations, can be characterized.
holder dedicated for either free standing films
11HIGH RESISTANCE The unique LINSEIS LSR-3 high resistance op- S/cm and below. This unique feature offers a tion in combination with the adjustable ther- substential benefit for research and quality con- mocouples placement for minimum probe trol applications only the LINSEIS LSR plattform disctance allows the characterization of challen- can provide. ging samples with conductivities as low as 0.01 THERMOCOUPLE OPTIONS Unsheated thermocouples (Standard) for highest precision measurements Sheated thermocouples for challenging samples Type K/S/C thermocouples Type K for low temperature applications Type S thermocouples for high temperature applications Type C thermocouples for special applications like Pt poisoning samples CAMERA OPTIONS • camera option for probe distance measurements • allows high accuracy resistivity measurements • including software package 12
HIGH SPEED
IR FURNACE
The LFA unit is equipped with a high speed                                                                         the infrared technology provides unmatched
IR furnace. This technology enables unmatched                                                                      temperature control, homogenity and preci-
heating and cooling speed of the system, pro-                                                                      sion, which is the basis for a highly accurate
viding highest sample throughput. In addition                                                                      measurement.

Because Time Matters
                    350
                                                                                                                                       500
                                                                                                                                                      Infrared/Micro-Heater               Resistance Furnace
                                          Necessary time for

                    300                                                                                                                450
                                                                                                                                                      Furnace
                                          measurement

                                                                                                                                       400
                    250
                                                               Infrared/                                                               350
                                                               Micro-Heater Furnace                                                    300
                                                                                                                    Temperature [°C]

                    200
 Temperature [°C]

                                                                                                                                                                                                               ~ 100min

                                                                                                                                       250
                                                                                                                                                           ~ 30min

                    150
                                                               Resistance                                                              200
                                                               Furnace
                    100                                                                                                                150

                                                                                                                                       100
                     50
                                                                                                                                        50

                      0                                                                                                                  0
                          0   1.0   2.0              3.0           4.0      5.0     6.0   7.0   8.0   9.0   10.0                             0   10   20       30    40      50      60   70    80    90       100
                                                                         Time [min]                                                                                       Time [min]

                                                                                                                   Ellapsed time for temperature dependent measure-
                                                                                                                   ment run

                          High speed                                                                                                         Superior tempera-
                          heating / cooling                                                                                                  ture stability
                                                                                                                                               best measure-
                                                                                                                                             ment accuracy
                          High sample
                          throughput

                                                                                                                                                                                                                          13
SOFTWARE
All LINSEIS thermo analytical instruments are General Features
PC controlled. The individual software modules • Program capable of text editing
exclusively run under Microsoft® Windows® • Repetition measurements with minimum pa-
operating systems. The complete software con- rameter input
sists of 3 modules: temperature control, data • Evaluation of current measurement
acquisition and data evaluation. The software • Curve comparison up to 32 curves
incorporates all essential features for measure- • Curve subtraction
ment preparation, execution, and evaluation of • Multi-methods analysis (DSC TG, TMA, DIL, etc.)
a LSR-3 measurement. Thanks to our specialists • Zoom function
and application experts, LINSEIS was able to de- • 1. and 2. Derivative
velop comprehensive easy to understand user • Complex peak evaluation
friendly application software. • Multipoint calibration for sample temperature
• Storage and export of evaluations
• Export and import of data ASCII
• Data export to MS Excel
• Signal-steered measuring procedures
• Zoom in function
14U/I-PLOT
For an accurate measurement of the resistivity,
the electrical contact of the current contacts
and voltage probes must be ensured. An easy
and comfortable way is the Linseis U/I plot. If
the correlation between applied current and
occuring voltage is linear, the electric contact
shows ohmic behaviour and thus is good for an
accurate measurement. If the correlation shows
500
non linear behaviour, the samples connection
should400
be reviewed.
Bad contact
Voltage [mV]
300
500
200 Bad contact
400
Voltage [mV]
100
300
0 10 20 30 40 50 60 70 80 90 100
Current [mA]
200
100
0 10 20 30 40 50 60 70 80 90 100
Current [mA]
500
Good contact
400
Voltage [mV]
300
500
200
Good contact
400
Voltage [mV]
100
300
0 10 20 30 40 50 60 70 80 90 100
Current [mA]
200
15
100SPECIAL FEATURES
Nearly perfect 1-dimensional heat flux through the sample
High resistance option in combination with flexible probe
distance provides most accurate results for challenging
samples
Direct ZT measurement is possible using Harman (legs) or
Impedance spectroscopy (legs and modules) upgrades
High speed infrared furnace for superior temperature con-
trol and higher sample throughput
Felixibility of thermocouples (Type, Sheathed or unshea-
thed)
Camera option for superior resistivity measurement accu-
racy
Thermal conductivity of legs and/or modules can be calcu-
lated using the Harman or impedance spectroscopy tech-
nique, respectively.
16SPECIFICATIONS
LSR 3
Temperature Range -100 up to 500°C; RT up to 800/1100/1500°C
Measurement method Seebeck coefficient: Static gradient / Slope method
Electric resistance: four-terminal method
Specimen holder sandwiched between two electrodes
Unique thin film and foil adapter
Atmosphere inert, oxid., red., vac.
Sample size (bar/zylinder) 2 to 5 mm width and depth / ø 6 mm and 6 to 23 mm height
Sample size round (Disc shape) 10, 12.7, 25.4 mm
Lead interval 4, 6, 8 mm
Cooling water required
Measuring range Seebeck 1 up to 2500 μV/K
Accuracy: ±7 % / Repeatability: ±3%
Measuring range 0.01 up to 2 • 105 S/cm
Electrical conductivty Accuracy: ±5-8 %* / Repeatability: ±3 %
Current source 0 to 160 mA
Electrode material Nickel (-100 to 500°C) / Platinum (-100 to 1500°C)
Thermocouples Type K/S/C
LSR 4 upgrade
DC Harman method Direct ZT determination of TE legs
AC Impedance Spectroscopy Direct ZT determination of Legs and Modules (Canadas model)
Temperature Range -100 up to +400°C
RT up tp 400°C
Specimen holder (LSR-4) Needle contacts for adiabatic measurment conditions
Sample size 2 to 5 mm width and depth / ø 6 mm and 6 to 23 mm height
Modules of various dimensions
17APPLICATIONS
Measurement of the Constantan reference sample
In contrast to the Bi2Te3 refe-
rence sample provided by NIST
(SRM 3451)™, which is only
lower limit (CONSTRES)
0.60 useable in the low temperature
-20 range until 390K, our Constan-
-25
resistivity constantan
0.50 tan reference sample can be
Absolute Seebeck coefficient [µV/K]
used as a high temperature re-
-30 upper limit (CONSTRES)
ference sample until 800°C. The
0.40
measurement shows a typical
Resistivity [µΩ•m]
-35
evaluation measurement which
-40
0.30 fits nicely in the specified tole-
-45 rances.
-50 upper limit (CONSTASC)
0.20
absolute
-55 Seebeck
coefficient
constantan
0.10
-60
lower limit (CONSTASC)
-65
0
0 100 200 300 400 500 600 700 800
Temperature [°C]
Electrical conductivity measurement of a highly conductive copper
As copper is highly conduc-
tive, the measurement of the
materials electrical resistivity
can get very challenging. Ne-
706.3°C
0.08 0.0776µΩ•m vertheless, due to the flexible
measurement configuration,
0.07 including adjustable probe di-
0.06 stance and sample geometry,
and the highly capable LINSEIS
Resistivity [µΩ•m]
0.05 measurement electronic with
a maximum measurement cur-
0.04
rent of 160 mA, it was possible
0.03 to measure even these challen-
23.9°C
0.0285µΩ•m ging samples.
0.02
0.01
0
0 100 200 300 400 500 600 700
Temperature smoothed [°C]
18Electrical conductivity measurement of a SiGe alloy
Silicon Germanium alloys are
high temperature stable ther-
moelectric materials and thus
220 40.0 are often used under challen-
ging environmental conditions,
200 35.0
like space missions or high tem-
Absolute Seebeck coefficient [µV/K]
180 perature waste heat recovery.
30.0
The measurement has been
160 performed in order to check the
Resistivity [µΩ•m]
25.0
low temperature behaviour of a
140
20.0 new developed alloy.
120
15.0
100
10.0
80
5.0
60
0
50 100 150 200 250 300
Temperature [°C]
Direct ZT measurement of the NIST Bi2Te3 reference sample
The NIST (SRM 3451)™ Bi2Te3
reference sample has been
measured using the Harman
1.00 6 min
method in combination with
0.97 V
25.226°C
our LINSEIS LSR platform. The
0.75 measurement clearly shows the
1 min ZT=0.501935
0.65 V
typical voltage distribution at
0.50 a single temperature measur-
6 min
0.32 V ment point. In this case, the
0.25
Voltage [mV]
ZT value at room temperature
1 min 12 min can be simply calculated by
0 0.00 V 0.00 V
setting the ohmic voltage drop
-0.25 and the thermoelectric voltage
17 min
-0.32 V
drop in relation.
-0.50 ZT=0.494129
12 min
-0.64 V
-0.75
22.920°C
17 min
-1.00 -0.96 V
0 2.0 4.0 6.0 8.0 10.0 12.0 14.0 16.0 18.0 20.0 22.0
Time [min]
19LINSEIS GmbH Germany LINSEIS Inc. USA
Vielitzerstr. 43 109 North Gold Drive
95100 Selb Robbinsville, NJ 08691
Tel.: (+49) 9287 880 0 Tel.: (+1) 609 223 2070
E-mail: info@linseis.de E-mail: info@linseis.de
LINSEIS China LINSEIS France
Kaige Scientific Park 2653 Hunan Road 2A Chemin des Eglantines
201315 Shanghai 69580 Sathonay Village
Tel.: (+86) 21 5055 0642 Tel.: (+33) 6.24.72.33.31
Tel.: (+86) 10 6223 7812 E-mail: contact@ribori-instrumentation.com
E-mail: info@linseis.de
LINSEIS Poland
ul. Dabrowskiego 1
05-800 Pruszków
Tel.: (+48) 692 773 795
E-mail: info@linseis.de
www.linseis.com
Products: DIL, TG, STA, DSC, HDSC, DTA, TMA, MS/FTIR, In-Situ EGA, Laser Flash, Seebeck Effect, Thin Film Analyzer, Hall-Effect
Services: Service Lab, Calibration Service
04/19You can also read