Analysis of the agriculture drought severity and spatial extent using Vegetation Health Index (VHI) in Manganga watershed of Maharashtra, India
←
→
Page content transcription
If your browser does not render page correctly, please read the page content below
Disaster Advances                                                                                 Vol. 14 (2) February (2021)

 Analysis of the agriculture drought severity and spatial
extent using Vegetation Health Index (VHI) in Manganga
            watershed of Maharashtra, India
            Patil Abhijit S.*, Patil Akshay A., Patil Somnath P., Saundade Sushant D., Chugule Kusum A.,
                                       Katavare Shital B. and Panhalkar Sachin S.
                               Department of Geography, Shivaji University, Kolhapur, Maharashtra, INDIA
                                                    *abhijit.patil8893@gmail.com

Abstract                                                              remote sensing drought indices which include duration,
Drought is a major environmental problem that causes                  intensity, severity and spatial extent.19 Several vegetative
severe losses in agricultural production, water                       drought indices have been implemented based on remote
supplies, livestock and ultimately, the environment as a              sensing data. Vegetation Health Index (VHI)13,16 revealed
                                                                      the higher potential and showed better suitability for
whole. The monitoring of drought is essential to
                                                                      detecting drought.3,6
prevent and mitigate the effects of drought. Drought
assessment using remote sensing-based indices of                      VHI considers the vegetation condition index (VCI) and the
drought has been widely conducted for monitoring                      temperature condition index (TCI) within one observation
droughts. The main objective of this study is to analyze              period. Thus, VHI evaluates the drought in the vegetation
the intensity of agricultural drought and its spatial                 affected by temperature.3,12 The VHI has also been widely
extent using the VHI that includes NDVI, VCI, LST and                 used for agricultural purposes such as predicting crop
TCI in the Manganga watershed.                                        yields.4,14,24 The prime objective of this study is to analyze
                                                                      the intensity of agricultural drought and its spatial extent
According to the results, mild and moderate drought                   using the VHI that includes NDVI, VCI, LST and TCI in the
                                                                      Manganga watershed of Maharashtra, India. The temporal
types are observed throughout the study area's
                                                                      analysis of drought is conducted as per the availability of
agricultural fields except for the adjacent area along                relatively clear Landsat satellite data of the study area.
the river. The analysis also indicates that the
relationship between NDVI-LST and LST-VHI is                          Study Area
negative while the relationship between NDVI-VHI is                   Maharashtra is one of the most well-developed and
positive.                                                             industrialized Indian States. It is the third-largest State with
                                                                      a total area of 307713 sq. km, with a population of 112.3
Keywords: NDVI, LST, TCI, VCI, VHI, Manganga                          million.22 The region in which drought frequently occurs is
Watershed.                                                            the Manganga watershed in Maharashtra. In the present
                                                                      investigation, the Manganga river tributary of Bhima River
Introduction                                                          is considered for the drought analysis which originates from
Drought is a prolonged occurrence of an abnormally dry                the hills lying in the eastern part of the Satara district at
period and inadequate rainfall to satisfy usual requirements          Kulakjai village and flows through Sangali and Solapur
resulting in massive damage to human beings, agriculture,             districts and finally meets Bhima river in Sarkoli. The
livestock and decreased yields.1,9,29 Drought is one of the           latitudinal and longitudinal extent of Manganga river
hydro-meteorological disasters most frequent in many parts            watershed are between 170 27'N to 170 44'N and 740 95'E to
of India, which leads to an enormous threat to the national           750 14'E.
economy and agricultural development. It is a major
environmental threat that causes significant losses in crop           The watershed catchment area is 4757 square km and the
production, water supply and livestock.23 The most                    river's main channel length is 151.35 km (Fig. 1).
vulnerable shock is realized in dry areas, where the rainfall         Agriculture is a significant occupation that supports more
pattern is highly variable.18 In India, the geographical area         than 80 percent of the population living in the basin. The
of 28 percent is vulnerable to mild to extreme drought.25             climatic condition of the study area is tropical. The annual
                                                                      average rainfall in the study area is about 1094 mm and the
Managing drought is also a big problem and dealing with               average annual temperature is around 240C.
this natural phenomenon requires extensive water resource
and agricultural management. Therefore, the monitoring of             Database and Methodology
drought is essential to prevent and mitigate the effects of           In this study, the Vegetation Health Index is analyzed using
drought events. The drought can be easily monitored by the            long-term sequence data for 2001, 2010, 2015, 2017 and
use of remote sensing equipment over large areas. The                 2019 dry season using Landsat data. The satellite data is
remote sensing data acquired by satellite provides a synoptic         being used in the analysis to precisely measure how
view of the earth's surface and can be used to assess drought         normalized difference vegetation index (NDVI), land
spatially.7 The monitoring of drought can be assessed using

                                                                 36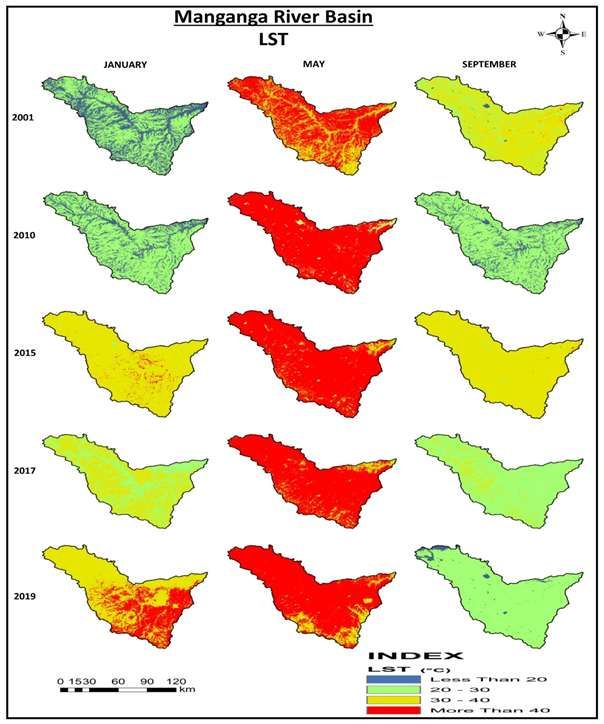
Disaster Advances                                                                           Vol. 14 (2) February (2021)

surface temperature (LST) and the VHI are affected by                the spectral representation of the vegetation leaves defined
changes in the drought analysis.                                     NDVI.20 This is commonly used to determine both global
                                                                     and local vegetation conditions and climate impacts on
Multi-temporal smoothed quarter-month Landsat satellite              vegetation. The NDVI is produced by Landsat images using
images from 2001 to 2019 at a spatial resolution of 30 m are         the ratio of bands 4 (red) and 5 (near-infrared) eq. 1:
taken from USGS. For this study, three Landsat satellite
images (January, May and September) are acquired yearly              NDVI = (NIR − RED)/(NIR + RED)                          (1)
(Table 1). In order to derive VHI, it is necessary to process
various indices that are carried in the following manner.            where NIR=near-infrared reflectance and RED= visible red
Figure 2 gives a brief and standardized flow of complete             reflectance.
analysis.
                                                                     NDVI is computed for three months (January, May and
Normalized Difference Vegetation Index (NDVI):                       September) for the years 2001, 2010, 2015, 2017 and 2019.
Drought analysis of applied vegetation indices method using

                                     Fig. 1: Geographical Location of the Study Area

                                                          Table 1
                                         Satellite database for drought assessment
                 S.N.        Satellite & Sensor Name            Resolution         Year            Month
                  1                Landsat (TM)                                    2001
                  2                                                                2010
                  3               Landsat (ETM+)                     30m           2015       January, May and
                  4                                                                2017          September
                  5                Landsat (OLI)                                   2019

                                                                37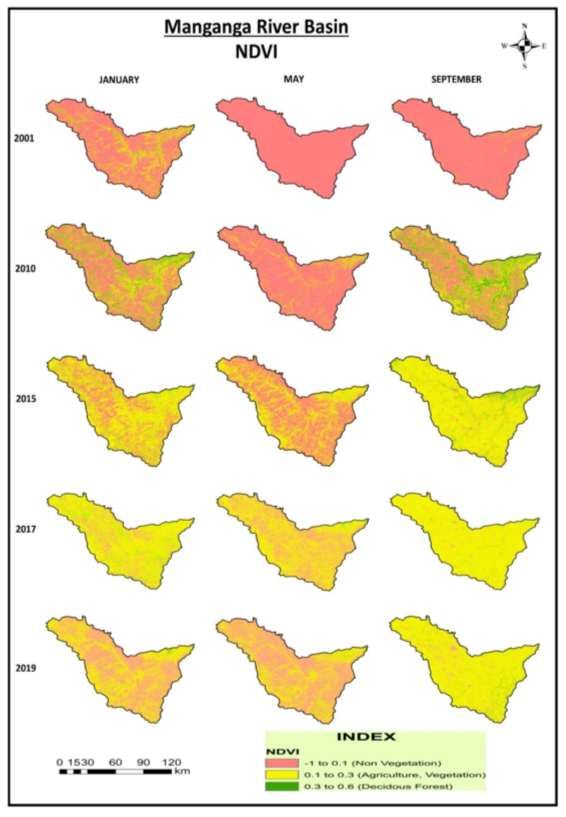
Disaster Advances                                                                           Vol. 14 (2) February (2021)

                                              Fig. 2: Research Methodology

Land Surface Temperature (LST): LST is defined as the               Vegetation Condition Index (VCI): The index is widely
surface radiometric temperature corresponding to the                applicable for the assessment of vegetation stress and for the
instantaneous field of view of the sensor. Information about        analysis of vegetation response.10 In this study, the s NDVI
land surface temperature is obtained using Landsat data from        data are used as input to compute the VCI model. Vegetation
the following formula (Eq. 2). These data are being used as         Condition Index values indicate how much vegetation has
input for the TCI and VHI computation, an advanced and              improved or degraded about environmental conditions.
optimized model of agricultural drought monitoring.                 According to Kogan12, the VCI value is expressed in the
                                                                    percentile ranged from 0 to 100. A high VCI value indicates
LST= BT/1+w*(BT/p)*In (e)                                (2)        a healthy and unstressed condition of vegetation. The VCI
                                                                    value of 50–100% indicates above normal or wet conditions.
where BT = At satellite temperature, W = wavelength if              In this study, the VCI model is used to examine the
emitted radiance, P = h*c/s (1.438*10^-23 m k), h = Plank’s         agricultural drought condition of the study area as follows
constant (1.38*10^-23 j/k), s = Boltzmann constant and c =          eq. 3:
velocity of type (2.998*10^8 m/s).

                                                               38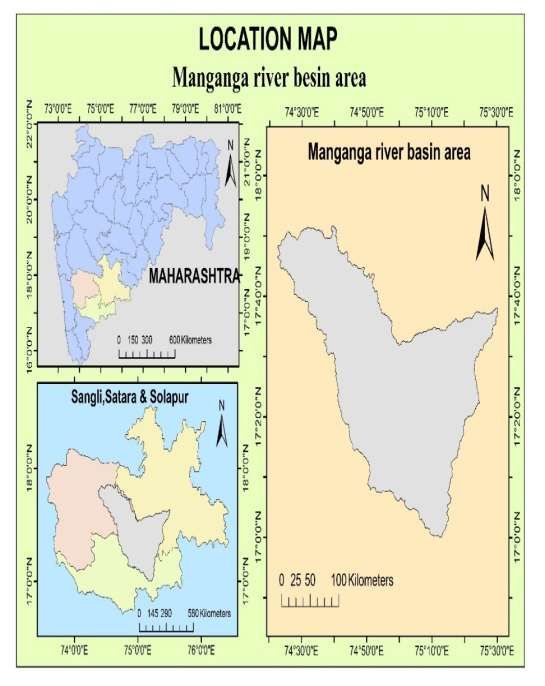
Disaster Advances Vol. 14 (2) February (2021)
VCI = 100 × NDVIi − NDVImin - / NDVImax − NDVImin (3) of the Manganga river basin area for 2001, 2010, 2015, 2017
and 2019 is shown in figure 3.
where NDVIi= the current smoothed NDVI value of ith
month, NDVImin and NDVImax, are multi-year (2001– 2019) After January's observation month (2001 and 2010), most of
absolute minimum and maximum NDVI values for every the area has been covered by non-vegetation, but for January
pixel at a particular period. 2015 and 2017 months, vegetation cover has decreased and
the 2019 non-vegetation area has decreased. May is a very
Temperature Condition Index (TCI): The LST data is hot month in this month. The temperature is also high in
used as an indicator of the energy balance at the earth’s Maharashtra. High temperature affects vegetation as well.
surface called the greenhouse effect in climate change The vegetation is scarce in May 2001 and 2010, although
studies.7 The TCI has proposed that higher temperatures some increase in greenery in 2015 and 2017.
appear to cause deterioration or drought during the
vegetative growth cycle whereas low temperatures are However, there is less vegetation in May 2019. September
generally beneficial to vegetation during its production. The 2001 is a very critical condition for vegetation because this
model has improved considerably in order to determine the year, the bulk of the vegetation cover is almost lost as per
vegetation response to temperature. In this study, the LST the observation. However, in September 2010, 2015, 2017
data are rescaled and converted into °C (degree Celsius) unit. and 2019, vegetation condition changed and vegetation
The TCI is estimated using the following mathematical cover increased. Overall, if we consider all the years, the
expression eq. 4: year 2001 is not ideal for vegetation in the non-vegetation
areas in general. Afterward, vegetation increased (2010,
TCI = 100 × (LSTmax − LSTi)/(LSTmax − LSTmin) (4) 2015 and 2017), yet another negative vegetation change was
in 2019.
where LSTi=LST value of ith-month, LSTmax and LSTmin are
the smoothed multi-year maximum and minimum LST. LST: The LST of the Manganga river watershed highlights
the spatial distributions of the hot areas based on 2001, 2010,
Vegetation Health Index (VHI): The VHI show the 2015, 2017 and 2019 images (Fig. 4). The land surface
availability of moisture and temperature or thermal temperature has been classified into four classes, the first
condition in vegetation.13 The VHI has been used for various less than 20, 20 to 30, 30 to 40 and the last greater than 40°C.
applications such as prediction of drought, extent and In January 2001 and 2010, the temperature is decreased
duration of drought, early warning of drought.27 The VHI below the first two categories, while in 2015 the temperature
model has been described as a comprehensive agricultural increases. Some regions indicated more than 40° C in 2019.
drought-monitoring index and has strong effectiveness in The LST marginally decreased in 2017 while the LST
exploring the spatial scale of extreme agricultural drought. increased significantly in 2019. May is a very hot month.
VHI depends on the weather and environmental factors of Temperature is pretty high everywhere. With findings in
the area.28 May 2001, 2010, 2015, 2017 and 2019, only May 2001 is
generally below 40 + C. In September 2001, variability in
Seiler27 has shown that the VHI combination of TCI and VCI temperature is everywhere. It implies all four categories in
is significant in classifying the spatial area, frequency and temperature in the study area.
intensity of agricultural droughts in a manner consistent with
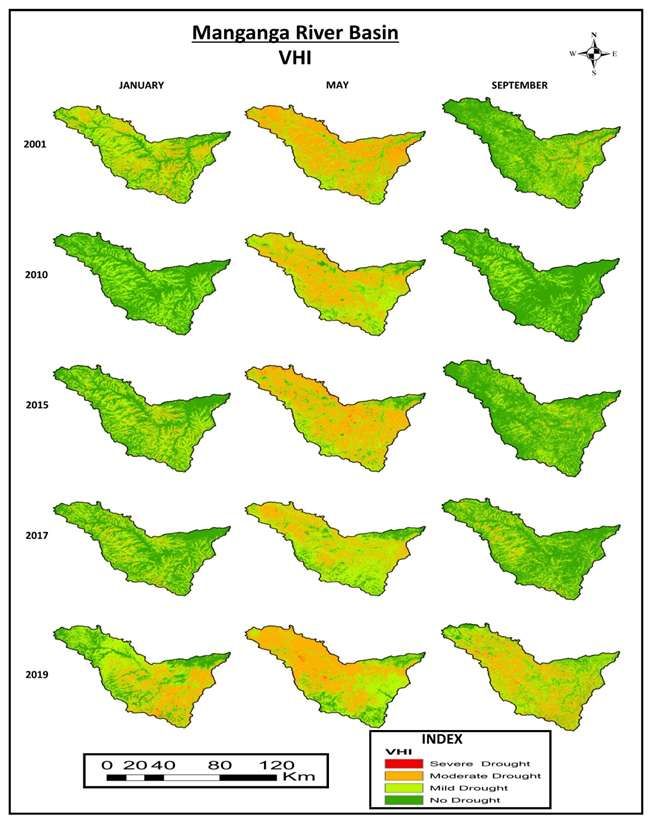
precipitation patterns. This drought index has improved VHI: The classification scheme for drought monitoring
performance for monitoring agricultural drought.21 Marufah based on VHI is divided into five groups as extreme drought
et al17 stated that VHI had been used to consider the duration, (VHI < 10), severe drought (10 < VHI < 20), moderate
spatial distribution and intensity, or type of agricultural drought (20 < VHI < 30), mild drought (30 < VHI < 40) and
drought. The VHI is mathematically computed as follows no drought (VHI > 40).15 As per the observation, many areas
eq. 5: fell under the medium drought and mild drought in January
2001. No Drought condition around the river is due to the
VHI = a × VCI + (1 − a) × TCI (5) availability of a sufficient amount of water of the river. As
the distance from the stream increases, the various
where VHI=Vegetation Health Index, a=0.5 (contribution of conditions of drought can be observed. Year 2010 is better
VCI and TCI), VCI=Vegetation Condition Index, for vegetation health condition as much of the region is
TCI=Temperature Condition Index. contained within the area without drought. However, the
VHI decreases in 2015 and 2017 (Fig. 5).
Results and Discussion
NDVI: Theoretically, NDVI values are represented as a ratio Thus the drought levels begin to increase. May is a very hot
ranging in value from -1 to 1, but in practice, extreme month and high temperatures do have a big effect on
negative values represent water, values around zero Vegetation Health; therefore, vegetation health condition is
represent bare soil and values close to one represent dense not likely to be good during this period. May 2001, 2010,
green vegetation. The spatial distribution of NDVI over part 2015, 2017 and 2019 are main regions of the mild drought,
39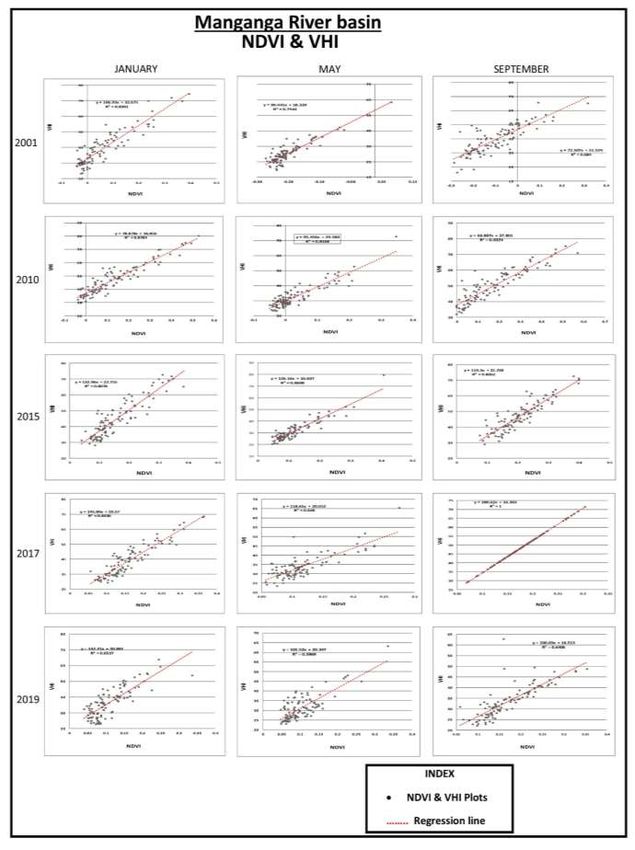
Disaster Advances                                                                           Vol. 14 (2) February (2021)

medium drought and some portion are in severe drought. As            vegetation is found in September 2001, 2010, 2015 and
per the investigation, the only adjacent area along the river        2017, although it was poor in 2019. According to the result,
basin is observed as without drought condition. The month            the mild and moderate type of drought are observed in the
of September contains rainy days and this time is well               study area.
balanced for vegetation health. The healthy condition of

                                                        Fig. 3: NDVI

                                                                40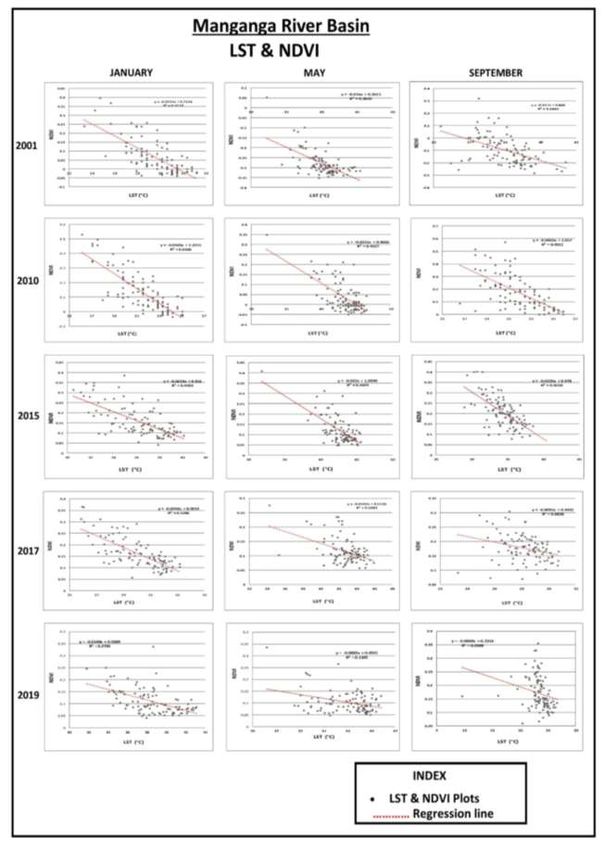
Disaster Advances                 Vol. 14 (2) February (2021)

                    Fig. 4: LST

                        41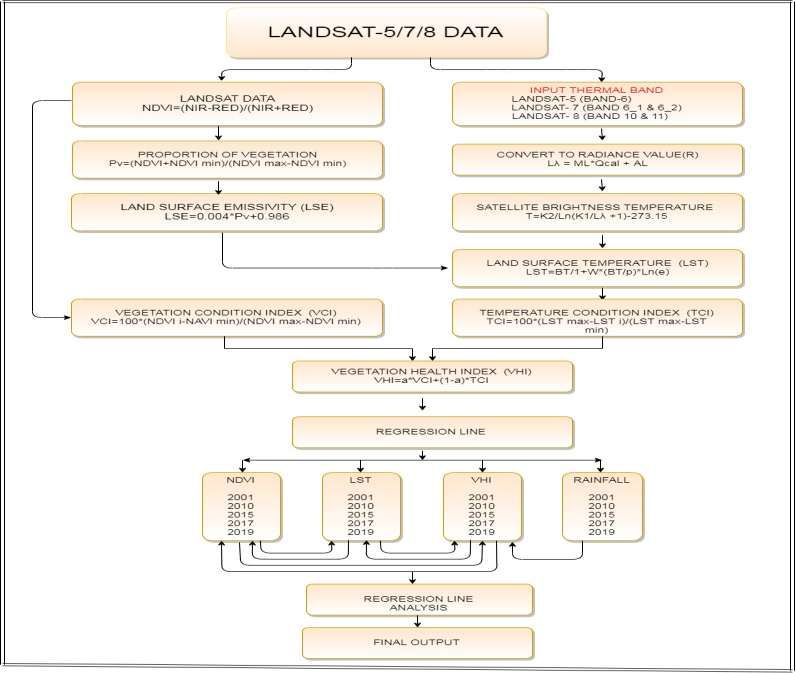
Disaster Advances                                                                            Vol. 14 (2) February (2021)

                                                         Fig. 5: VHI

Correlations between indices                                         area (Fig. 6, 7, 8). LST is related to NDVI. Empirically, the
The goal of regression analysis is to construct a statistical        temperature decreases as NDVI increases over a
model that can be used to measure dependent variable's               landscape.2,5,11,26 It is observed that the nature of the
values based on an independent variable’s value. The                 relationship between LST and NDVI is linear and negative
analysis reveals that the land surface temperature (LST) and         (Fig. 6). The same conditions which are observed in the case
NDVI change over time depending on the changes in the                of LST and VHI are negative relationships (Fig. 7).
vegetation health and, ultimately, drought categories of the         However, high NDVI means strong vegetation health in the
study area. Therefore, a comparison of concern indices has           case of NDVI and the VHI relationship between both of
been carried out by using 100 sampling points in the study           these is positive (Fig. 8).

                                                                42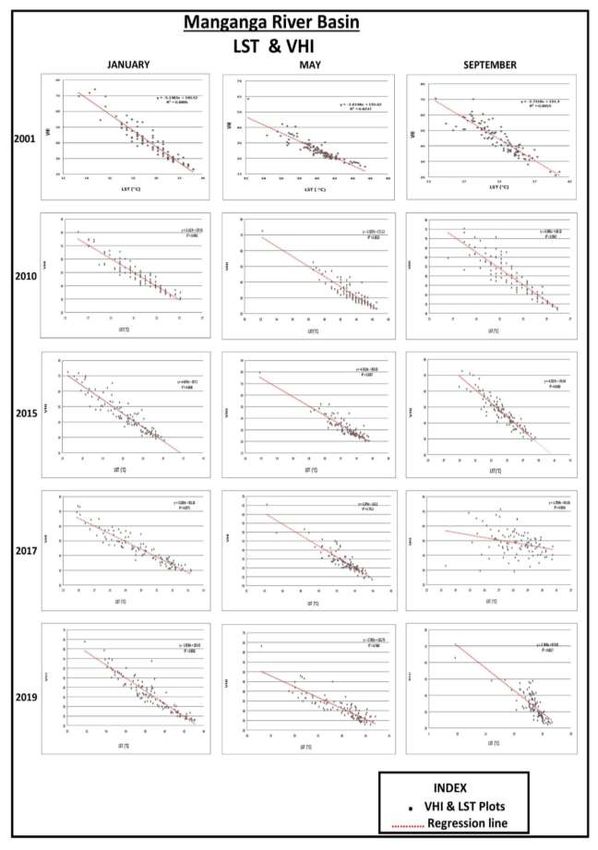
Disaster Advances                                              Vol. 14 (2) February (2021)

                    Fig. 6: Correlation between LST and NDVI

                                      43
Disaster Advances Vol. 14 (2) February (2021)
Fig. 7: Correlation between LST and VHI
44Disaster Advances Vol. 14 (2) February (2021)
Fig. 8: Correlation between NDVI and VHI
45Disaster Advances Vol. 14 (2) February (2021)
Conclusion 11. Karnieli A., Bayasgalan M., Bayarjargal Y., Agam N.,
This study attempts to analyze the intensity of agricultural Khudulmur S. and Tucker C.J., Comments on the use of the
vegetation health index over Mongolia, Int. J. Remote Sens., 27,
drought and its spatial extent using the VHI that includes
2017– 2024 (2006)
NDVI, VCI, LST and TCI in the Manganga watershed of
Maharashtra, India. The VHI is successfully used to 12. Kogan F.N., Application of vegetation index and brightness
determine the spatiotemporal extent of agricultural drought. temperature for drought detection, Adv Space Res, 15(11), 91–100
(1995)
As per the outcomes, mild and moderate type of drought is
observed throughout agriculture fields of the study area 13. Kogan F.N., Operational space technology for global
excepting only the adjacent area along the river. The study vegetation assessment, Bull Am Meteor Soc, 82(9), 1949 (2001)
also shows that the relationship between NDVI-LST and
LST-VHI is negative whereas NDVI-VHI has a positive 14. Kogan F., Salazar L. and Roytman L., Forecasting crop
production using satellite-based vegetation health indices in
relationship. The outcomes of this study could be helpful for
Kansas, USA, Int. J. Remote Sens., 33, 2798–2814 (2012)
future decision-making processes on drought management.
15. Kogan F.N., World droughts in the new millenium from
References AVHRR-based Vegetation Health Indices, Eos Trans. Am.
1. Al-Riffai Perrihan et al, Droughts in Syria: an assessment of Geophys. Union, 83, 562–563 (2002)
impacts and options for improving the resilience of the poor,
Quarterly Journal of International Agriculture, 51(1), 21 (2012) 16. Kogan F.N., Global drought watch from space, Bull. Am.
Meteorol. Soc., 78, 621–636 (1997)
2. Badeck F.W., Bondeau A., Bottcher K., Doktor D., Lucht W.,
Schaber J. and Sitch S., Responses of spring phenology to climate 17. Marufah U., Hidayat R. and Prasasti I., Analysis of relationship
change, New Phytol., 162, 295–309 (2004) between meteorological and agricultural drought using
standardized precipitation index and vegetation health index, In
3. Bhuiyan C., Singh R.P. and Kogan F.N., Monitoring drought IOP Conference Series: Earth and Environmental Science, IOP
dynamics in the Aravalli region (India) using different indices Publishing, Bristol, 012008 (2017)
based on ground and remote sensing data, International Journal of
Applied Earth Observation and Geoinformation, 8, 289-302 18. Maybank J., Bonsai B., Jones K., Lawford R., O’brien E.G.,
(2006) Ripley E.A. and Wheaton E., Drought as a natural disaster, Atmos
Ocean, 33(2), 195–222 (1995)
4. Bokusheva R., Kogan F., Vitkovskaya I., Conradt S. and
Batyrbayeva M., Satellite-based vegetation health indices as a 19. Mishra A.K., Ines A.V.M., Das N.N., Khedun C.P., Singh V.P.,
criteria for insuring against drought-related yield losses, Agric. Sivakumar B. and Hansen J.W., Anatomy of a local-scale drought:
For. Meteorol., 220, 200–206 (2016) Application of assimilated remote sensing products, crop model
and statistical methods to an agricultural drought study, Journal of
5. Carlson T.N., Gillies R.R. and Perry E.M., A method to make Hydrology, 526, 15-29 (2015)
use of thermal infrared temperature and NDVI measurements to
infer soil water content and fractional vegetation cover, Remote 20. Myneni R.B., Hall F.G., Sellers P.J. and Marshak A.L., The
Sens. Rev., 52, 45–59 (1994) interpretation of spectral vegetation indexes, IEEE Trans. Geosci.
Remote Sens., http://dx.doi.org/10.1109/36.377948, 33, 481–486
6. Choi M., Jacobs J.M., Anderson M.C. and Bosch D.D., (2015)
Evaluation of drought indices via remote sensed data with
hydrological variables, Journal of Hydrology, 476, 265-73 (2013) 21. Parviz L., Determination of effective indices in the drought
monitoring through analysis of satellite images, Agric Forest
7. Frey C.M., Kuenzer C. and Dech S., Quantitative comparison of Poljoprivreda I Sumarstvo, 62(1), 305–324 (2016)
the operational NOAA-AVHRR LST product of DLR and the
MODIS LST product V005, Int J Remote Sens, 33(22), 7165–7183 22. Registrar General, India, Census of India 2011: provisional
(2012) population totals-India data sheet, Office of the Registrar General
Census Commissioner, India, Indian Census Bureau (2011)
8. Gu Y., Brown J.F., Verdin J.P. and Wardlow B., A five-years
analysis of MODIS NDVI and NDWI for grassland drought 23. Rojas O., Vrieling A. and Rembold F., Assessing drought
assessment over the central Great Plains of the United States, probability for agricultural areas in Africa with coarse resolution
Geophysical Research Letters, doi:10.1029/2006GL02912, 34, remote sensing imagery, Remote sensing of Environment, 115,
L06407 (2007) 343-52 (2011)
9. Gupta Anil Kumar et al, Bundelkhand Drought: Retrospective 24. Salazar L., Kogan F. and Roytman L., Using vegetation health
Analysis and Way Ahead, National Institute of Disaster indices and partial least squares method for estimation of corn
Management, New Delhi 148 (2014) yield, Int. J. Remote Sens., 29, 175–189 (2008)
10. Karnieli A., Agam N., Pinker R.T., Anderson M., Imhof M.L., 25. Samra J.S., Review and analysis of drought monitoring,
Gutman G.G. and Goldberg A., Use of NDVI and land surface declaration and impact management in India, IWMI Working
temperature for drought assessment: merits and limitations, J Clim Paper 84, Drought Series Paper 2, International Water
23(3), 618–633 (2010) Management Institute, Colombo, Sri Lanka (2004)
46Disaster Advances Vol. 14 (2) February (2021)
26. Sandholt I., Rasmussen K. and Andersen J., A simple 28. Singh R.P., Roy S. and Kogan F., Vegetation and temperature
interpretation of the surface temperature/vegetation index space for condition indices from NOAA AVHRR data for drought
assessment of surface moisture status, Remote Sens. Environ., 79, monitoring over India, Int J Remote Sens, 24(22), 4393–4402
213–224 (2002) (2003)
27. Seiler R.A., Kogan F. and Sullivan J., AVHRR-based 29. Wilhite Donald A., eds., Drought and water crises: science,
vegetation and temperature condition indices for drought detection technology and management issues, CRC Press (2005).
in Argentina, Adv Space Res, 21(3), 481–484 (1998)
(Received 12th August 2020, accepted 02nd November 2020)
47You can also read