Impact of corneal parameters, refractive error and age on density and morphology of the subbasal nerve plexus fibers in healthy adults - Nature
←
→
Page content transcription
If your browser does not render page correctly, please read the page content below
www.nature.com/scientificreports
OPEN Impact of corneal parameters,
refractive error and age on density
and morphology of the subbasal
nerve plexus fibers in healthy
adults
Anna M. Roszkowska1*, Adam Wylęgała2, Romana Gargano3, Rosaria Spinella1,
Leandro Inferrera1, Bogusława Orzechowska‑Wylęgała4 & Pasquale Aragona1
The purpose of this study was to analyze corneal sub-basal nerve plexus (SBNP) density and
morphology and their relationships with corneal parameters and refractive status. In this single center
study, in vivo confocal microscopy (IVCM) was performed in 76 eyes of 38 healthy subjects aged
19–87 (mean age 34.987 ± 1.148). Nerve fiber analysis was performed using Confoscan 4 microscope
with semi-automated software (Nidek Technologies, Italy) The nerve fiber length (NFL) µm/mm2,
nerve fiber density (NFD) no./mm2, tortuosity coefficient (TC), and nerve beadings density (NBD)
no./mm were considered. Relationship between SBNP parameters and corneal curvature, thickness,
diameter, and refraction were analyzed. Additionally, the association with gender, laterality and age
were determined. NFL was inversely correlated with age (r = − 0.528, p < 0.001), myopic refractive
error (spherical value) (r = − 0.423, p < 0.001), and cylindrical power (r = − 0.340, p = 0.003). NFD was
inversely correlated with age (r = − 0.420, p < 0.001) and myopic refractive error (r = − 0.341, p = 0.003).
NBD showed a low inverse correlation with cylindrical power (r = − 0.287, p = 0.012) and a slight
positive correlation with K (r = 0.230, p = 0.047). TC showed a significant negative correlation between
age (r = − 0.500, p < 0.001) and myopic refractive error (r = − 0.351, p = 0.002). Additionally, there
were strong positive correlations between NFL and NFD (r = 0.523, p < 0.001), NFL and TI (r = 0.603,
p < 0.001), and NFD and TC (r = 0.758, p < 0.001). Multiple regression analysis revealed age to be
the most significant factor affecting SBNP density (B = − 0.467, p = 0.013) and length (B = − 61.446,
p < 0.001); myopic refractive error reduced both SBNP density (B = − 2.119, p = 0.011) and length
(B = − 158.433, p = 0.016), while gender and laterality had no significant effects (p > 0.005). SBNP fiber
length decreases with age, myopic refractive error and cylindrical power. SBNP fiber density reduces
with age and myopic refractive error. Corneal nerve parameters are not influenced by gender or
laterality.
The cornea is the most densely innervated tissue in the human body. Corneal sensory innervation derives from
the ophthalmic branch of the trigeminal nerve and reaches the corneoscleral limbus with the anterior ciliary
nerves. The nerves enter the mid-corneal stroma from the corneal limbus. Below the basal epithelium, the corneal
nerves form the sub-basal plexus (SBNP) that runs parallel to the corneal surface below the epithelial layer. SBNP
fibers in the healthy human cornea show a whorled pattern pointed at the lower nasal q uadrant1–3. In vivo confo-
cal microscopy (IVCM) is a method that allows the depiction of the cornea on a histological scale and is valuable
in assessing corneal properties. Using IVCM, it is possible to analyze all corneal layers, to measure the corneal
thickness, endothelial cell density, depth of lesions, and r eflectance2–7. With IVCM the SBNP can be examined
1
Ophthalmology Clinic, Department of Biomedical Sciences, University Hospital of Messina, Via Consolare Valeria,
98100 Messina, Italy. 2Health Promotion and Obesity Management Unit, Pathophysiology Department, School
of Medicine, Medical University of Silesia, Katowice, Poland. 3Department of Economics, University of Messina,
Messina, Italy. 4Clinic of Otolaryngology, Head, Neck Surgery, Department of Pediatric Surgery, Medical University
of Silesia, Katowice, Poland. *email: aroszkowska@unime.it
Scientific Reports | (2021) 11:6076 | https://doi.org/10.1038/s41598-021-85597-5 1
Vol.:(0123456789)www.nature.com/scientificreports/
and the corneal confocal microscopy (CCM) parameters such as nerve fiber density (NFD), nerve fiber length
(NFL), nerve beading density (NBD), and tortuosity coefficient (TC) can be m easured2,3,7–10.
Nerve fibres length (NFL) is defined as the total length of all nerve fibres within the area and represented in
mm/mm2. Nerve fibres density (NFD) is the total number of major nerves per millimeter squared and represented
in no./mm211–14. Some authors considered nerve fibers density (CNFD) which represents the fibers length density
per area using the unit mm/mm2 that differs from the previously defined N FD4,5,15,16. The NFL is considered as a
2,3,7–10
more stable parameter and it is diminished in different corneal c onditions . It was determined as the optimal
and the most reliable parameter for the detection of diabetic sensorimotor p olyneuropathy17–19.
Nerve beading density (NBD) expressed in no./mm represents the total number of nerve beadings divided
by the total length of nerve trunks in millimeter. Beadings are efferent to the axons and sensory terminals, and
consist of accumulations of mitochondria and g lycogen8–10,20.
Nerve fibers tortuosity is expressed by the unitless measure representing the degree of twistedness of fibers
and calculated according to the Kallinikos’ tortuosity coefficient (TC), and its higher number indicates the more
tortuous nerves. Tortuosity increment, sign of nerve damage, indicates the regeneration occurring in damaged
nerves with active fibers g rowth21,22. Both higher tortuosity and beading density are considered signs of higher
metabolic activity of the SBNP responding to epithelial changes21–23.
Different studies investigated SBNP parameters in healthy cornea and considerable differences in normal
values of the SBNP parameters reported by investigators could be attributed to variations in study design, dif-
ferent devices used to perform IVCM, and different methods of nerve assessment (manual, semi-automated, or
automated)2,5–9,20,22,24,25.
Previous studies reported NFD, NFL, NBD, and TC in health and disease, but there have been no reports
investigating whether corneal parameters might influence SBNP density and m orphology2,7,8,10,22,23. Here, we
aimed to investigate whether SBNP parameters in the healthy cornea, are related to the corneal parameters
such as central corneal thickness (CCT), corneal curvature (K), corneal diameter (CD), and refractive status.
Furthermore, we analyzed the impact of demographics such as gender and age on changes in SBNP parameters.
Subjects and methods
The study was performed on 76 eyes of 38 healthy subjects (22 F and 16 M) aged from 19 to 87 years (mean
34.987 ± 1.484). The patients were recruited from candidates for laser refractive surgery and from the general
ophthalmology ambulatory where they presented for the periodic ocular examination. The refractive errors
were measured with both subjective evaluation and autorefractive readings (Topcon, Japan) and the values
were determined by assessment of the best corrected visual acuity. Individuals with any systemic diseases were
excluded and only subjects with no ocular disease or history of ocular surgery were enrolled. The patients were
not contact lenses wearers and had a best-corrected visual acuity of 20/20. The informed consent was obtained
from all participants. The study was approved by the Ethical Committee of the University Hospital of Messina
and adhered to the tenets of the Helsinki Declaration.
Corneal parameters measurement. Slit lamp examination was performed prior to the instrumental
examinations. Corneal curvature was measured with corneal topography (Antares, C SO®, Scandicci, Italy) and
Average K readings were considered. The corneal horizontal diameter was determined on videokeratography
images. Three measurements of the central corneal thickness (CCT) were performed with ultrasound pachym-
eter (Optikon 2 000®, Italy), by the same observer after topical instillation of unpreserved 0.4% oxybuprocaine
(Novesina; Novartis Farma, Origgio, Italy) and the mean value was calculated and expressed in microns. IVCM
was performed using the slit scanning confocal microscope (Confoscan 4, Nidek Technologies®, Vigonza, Italy)
after topical instillation of unpreserved 0.4% oxybuprocaine (Novesina; Novartis Farma, Origgio, Italy). The
examination was performed using the 40 × contact objective, provided with Z-Ring probe to allow precise posi-
tioning of the lens over the central corneal area. An ophthalmic gel 0.2% carbomer (Viscotears; Novartis Farma,
Italy) was used to improve the adhesion of the objective to the cornea. Complete scanning of the cornea was
carried out three times for each eye.
Sub‑basal Nerve Plexus analysis. The nerve fiber analysis was performed on images obtained from the
subepithelial layers, where the sub-basal nerve plexus is present. Only well focused, clear images (460 × 345 mm)
were considered with three images per each corneal scan for a total of nine photographs for single eye.
The selected images were evaluated by one experienced operator using the semi-automated nerve analysis
software program (Nidek Technologies, Italy). The software traces automatically nerve fibers, evidences beadings,
provides CCM parameters and calculates tortuosity coefficient (Fig. 1). We define NFL as the total length of all
nerve fibres within the area and expressed in mm/mm2, NFD as the total number of major nerves per millimeter
squared represented in no./mm2 and NBD as the total number of nerve beadings divided by the total length of
nerve fibres in millimeter reported in no./mm. The operator was enabled to trace the fibers undetected by the pro-
gram that were successively incorporated into analysis. In this study the values obtained for NFL, NFD, NBD and
the TC were considered and the correlation with corneal parameters, age and refractive status was investigated.
Statistical analysis. Preliminary, the data were assessed for normality using the Shapiro–Wilk normality
test. In order to determine any significant differences between gender and laterality for all corneal parameters
Student t test for independent sample was applied. Bravais–Pearson correlation test was performed to measure
the type and intensity of the linear relationship between the variables. The multiple linear regression model was
applied to study the effects of independent variables (corneal parameters and age) on the dependent variable
(corneal nerve parameters) as a function of a given theoretical model, as well as to identify a linear combination
Scientific Reports | (2021) 11:6076 | https://doi.org/10.1038/s41598-021-85597-5 2
Vol:.(1234567890)www.nature.com/scientificreports/
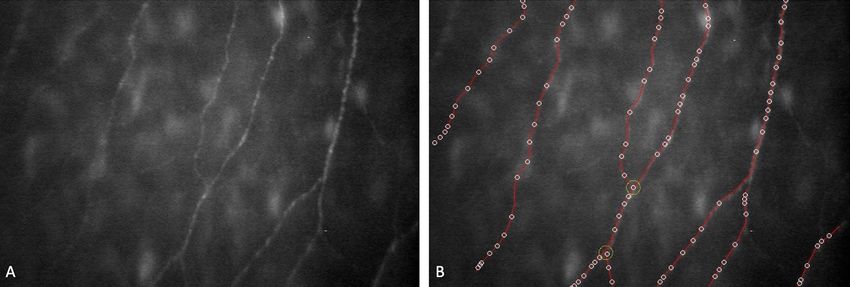
Figure 1. The source image of the SBNP fibers (A) and the segmentation sample (B). The software traces nerve
fibers and detects the beadings and automatically provides CCM values.
Min Max Mean S error S deviation
NFL (µm/mm2) 1385.540 12,082.350 8515.546 206.899 1791.799
NFD (no./mm2) 21.940 124.310 68.076 2.327 20.291
NBD (no./mm) 15.230 57.660 36.958 1.104 9.564
TC 2.520 38.380 21.536 0.833 7.218
Age (years) 19.000 87.000 34.987 1.484 12.937
K (D) 40.990 46.850 43.932 0.159 1.387
CD (mm) 11.040 12.830 12.051 0.044 0.377
CCT (mm) 482.000 634.000 563.027 3.716 32.181
Sph (D) − 11.250 0.000 − 4.125 0.321 2.795
Cyl (D) − 3.500 0.000 − 0.694 0.092 0.806
Table 1. Statistical summary of the collected eye data*. *NFL nerve fiber length (µm/mm2), NFD nerve fiber
density (no./mm2), NBD nerve beadings density (no./mm), TC tortuosity coefficient, K corneal curvature (D
diopters), CD corneal diameter (mm), CCT corneal thickness (µm), Sph sphere (D diopters), Cyl cylinder (D
diopters).
of independent variables to optimally predict the value assumed by the dependent variable. The multicollinearity
absence between variables was verified by tolerance and variance inflation factor (VIF). The assumptions of a
linear regression model were tested on residual plots.
Stata 15.1 (StataCorp, College Station, TX, USA) was used to perform statistical analyses.
Ethics approval. This study was approved by the Ethical Committee of the University Hospital of Messina
and adhered to the tenets of the Helsinki Declaration.
Consent for publication. All authors consented to publication of this manuscript.
Results
Table 1 reports the descriptive statistics for all quantitative variables. Most of the participants presented myopic
refractive error that ranged from − 0.5 to − 11.25 diopters, with an average sphere value of − 4.125 ± 0.321 D, and
an average astigmatism of − 0.694 ± 0.092 D (range − 0.5 to − 3.5 D). The distribution of refractive error is repre-
sented in the Fig. 2. The average K was 43.932 ± 0.159 D, while mean corneal diameter equaled 12.050 ± 0.044 mm.
The mean central corneal thickness across all individuals was 563.027 ± 3.716 µm.
Laterality. No corneal parameters were significantly different between right and left eyes (Table 2): aver-
age K (p = 0.544), corneal diameter (p = 0.521), CCT (p = 0.634), spherical power (p = 0.737), cylindrical power
(p = 0.608), NFL (p = 0.495), NFD (p = 0.445), NBD (p = 0.583), and TC (p = 0.901) (Fig. 3).
Corneal parameters and refraction between genders. Corneal nerves parameters were not signifi-
cantly different between genders: NFL (p = 0.211), NFD (p = 0.512), NBD (p = 0.933), TC (p = 0.284). However,
significant differences were observed in average K (p = 0.009), corneal diameter (p = 0.035) and spherical power
(p < 0.001) (Table 3). Specifically, the mean K value was 43.452 ± 0.223 D and 44.281 ± 0.208 D, the mean diam-
Scientific Reports | (2021) 11:6076 | https://doi.org/10.1038/s41598-021-85597-5 3
Vol.:(0123456789)www.nature.com/scientificreports/
Refracve error distribuon
35
30 32
25
Number of eyes
20
15 17
16
10
11
5
0
0 to -0.50 Dwww.nature.com/scientificreports/
Figure 3. The example of the SBNP fibers from the left eye (A) and the right eye (B) of the same subject with
low myopia.
Gender Mean S deviation S error p-value**
M 8205.988 2126.351 381.904
NFL (µm/mm2) 0.211
F 8733.644 1500.973 226.280
M 66.272 23.271 4.114
NFD (no./mm2) 0.512
F 69.387 17.987 2.712
M 37.067 10.105 1.786
NBD (no./mm) 0.933
F 36.876 9.261 1.412
M 20.494 8.489 1.501
TC 0.284
F 22.312 6.096 0.930
M 36.031 16.370 2.894
Age (years) 0.552
F 34.227 9.866 1.487
M 43.452 1.263 0.223
K (D) 0.009
F 44.281 1.382 0.208
M 12.162 0.295 0.054
CD (mm) 0.035
F 11.975 0.410 0.062
M 565.161 32.464 5.831
CCT(mm) 0.633
F 561.523 32.270 4.865
M − 2.797 2.020 0.357
Sph (D) < 0.001
F − 5.091 2.901 0.437
M − 0.664 0.834 0.147
Cyl (D) 0.784
F − 0.716 0.793 0.120
Table 3. Descriptive statistics for gender (16 M = male; 22 F = female) and test t p-value*. *M male, F female,
NFL nerve fiber length (µm/mm2), NFD nerve fiber density (no./mm2), NBD nerve beadings density (no./
mm), TC tortuosity coefficient, K corneal curvature (D diopters), CD corneal diameter (mm), CCT corneal
thickness (µm), Sph sphere (D diopters), Cyl cylinder (D diopters). **Bold values denote statistical significance
at the p value < 0.05.
p < 0.001) followed by cylindrical power (B = − 0.297, p = 0.003) and spherical power (B = − 0.249, p = 0.016). The
results show that a decrease of 61.446 µm/mm2 can be expected with an age increase of 1 year, assuming that all
other variables in the models are held constant. Similarly, NFL decreases on average by − 158.433 µm/mm2 for
each increase in the spherical power and decreases by − 656.134 µm/mm2 when the cylindrical power increases
by one unit, when all other variables are constant (Fig. 4).
The information in the table allows us to check multicollinearity absence in the model; the tolerance was > 0.1
and VIF < 10 for all variables.
Nerve fibers density. The mean NFD was 68.076 ± 2.327 no./mm2 and was significantly negatively correlated
with age (r = − 0.420, p < 0.001) and spherical power (r = − 0.341, p = 0.003), but not with average K (r = − 0.121,
p = 0.298), corneal diameter (r = 0.187, p = 0.110), CCT (− 0.190, p = 0.103), or cylindrical power (r = − 0.165,
p = 0.0155). Mean NFD was strong positively correlated with mean NFL (r = 0.523, p < 0.001) and mean tortuos-
ity (r = 0.758, p < 0.001).
NFD was statistically dependent only on age (p = 0.013) and spherical power (p = 0.011). The two corneal
parameters had a similar negative influence; the standardized coefficients were B = − 0.298 (age) and B = − 0.292
(spherical power). Results showed a mean decrease of NFD of 0.467 mm2 could be expected with an increase
Scientific Reports | (2021) 11:6076 | https://doi.org/10.1038/s41598-021-85597-5 5
Vol.:(0123456789)www.nature.com/scientificreports/
NFL (µm/mm2) NFD (no./mm2) NBD (no./mm) TC Age (years) K (D) CD (mm) CCT (mm) Sph (D) Cyl (D)
R 1 0.523 0.190 0.603 − 0.528 − 0.053 − 0.024 − 0.058 − 0.423 − 0.340
NFL (µm/mm2)
p-value* 0.000 0.105 0.000 0.000 0.655 0.836 0.625 0.000 0.003
R 0.523 1 − 0.093 0.758 − 0.420 − 0.121 0.187 − 0.190 − 0.341 − 0.165
NFD (no./mm2)
p-value* 0.000 0.426 0.000 0.000 0.298 0.110 0.103 0.003 0.155
R 0.190 − 0.093 1 − 0.051 − 0.107 0.230 0.008 − 0.013 − 0.151 − 0.287
NBD (no./mm)
p-value* 0.105 0.426 0.666 0.362 0.047 0.944 0.909 0.197 0.012
R 0.603 0.758 − 0.051 1 − 0.500 − 0.047 0.125 − 0.132 − 0.351 − 0.155
TC
p-value* 0.000 0.000 0.666 0.000 0.691 0.293 0.262 0.002 0.183
R − 0.528 − 0.420 − 0.107 − 0.500 1 − 0.059 − 0.321 0.174 0.275 0.076
Age (years)
p-value* 0.000 0.000 0.362 0.000 0.616 0.005 0.136 0.016 0.511
R − 0.053 − 0.121 0.230 − 0.047 − 0.059 1 − 0.463 0.102 − 0.067 0.208
K (D)
p-value* 0.655 0.298 0.047 0.691 0.616 0.000 0.386 0.566 0.072
R − 0.024 0.187 0.008 0.125 − 0.321 − 0.463 1 − 0.035 0.123 − 0.150
CD
p-value* 0.836 0.110 0.944 0.293 0.005 0.000 0.770 0.296 0.201
R − 0.058 − 0.190 − 0.013 − 0.132 0.174 0.102 − 0.035 1 − 0.142 0.193
CCT (mm)
p-value* 0.625 0.103 0.909 0.262 0.136 0.386 0.770 0.225 0.096
R − 0.423 − 0.341 − 0.151 − 0.351 0.275 − 0.067 0.123 − 0.142 1 0.077
Sph (D)
p-value* 0.000 0.003 0.197 0.002 0.016 0.566 0.296 0.225 0.510
R − 0.340 − 0.165 − 0.287 − 0.155 0.076 0.208 − 0.150 0.193 0.077 1
Cyl (D)
p-value* 0.003 0.155 0.012 0.183 0.511 0.072 0.201 0.096 0.510
Table 4. Pearson correlation matrix. *NFL nerve fiber length (µm/mm2), NFD nerve fiber density (no./mm2),
NBD nerve beadings density (no./mm), TC tortuosity coefficient, K corneal curvature (D diopters), CD corneal
diameter (mm), CCT corneal thickness (µm), Sph sphere (D diopters), Cyl cylinder (D diopters). **Bold values
denote statistical significance at the p value < 0.05.
of one year in age, assuming that all other variables in the models are held constant. A mean NFD reduction
of − 2.119 fibers/mm2 can be expected for every unit increase of spherical power, assuming all other variables
are constant (Table 5). There was not multicollinearity between variables (tolerance > 0.1 and VIF < 10 for all
variables).
Nerve beadings density. The mean NBD was 36.958 ± 1.104/mm and had a low correlation with cylindrical
power (r = − 0.287, p = 0.012) and K (0.230, p = 0.047). There was no correlation between NBD and all variables
considered here: age (r = − 0.107, p = 0.362), corneal diameter (r = 0.008, p = 0.944), CCT (r = − 0.013, p = 0.909),
spherical power (r = − 0.151, p = 0.197). Nerves beadings density was not correlated with any corneal nerve
parameter: NFL (r = 0.190, p = 0.105), NFD (r = − 0.093, r = 0.426), mean TC (r = − 0.051, p = 0.666).
NBD was statistically dependent by average K (p = 0.007) and cylindrical power (p = 0.005) with more impact
of average K (standardized coefficient B = 0.354, p = 0.007) respect to cylindrical power (B = − 0.332, p = 0.005).
We could expect mean increase NBD of 2.432 beadings/mm when K increases one unit, assuming that all other
variables in the model are held constant and a decrease of − 3.991 beadings/mm in NBD mean for every unit
increase of cylindrical power, always assuming other variables as constants (Table 5).
Nerves tortuosity coefficient. The mean nerve tortuosity index was 21.536 ± 0.833. There was a significant nega-
tive correlation between tortuosity and age (r = − 0.500, p < 0.001) and spherical value (r = − 0.351, p = 0.002).
There was no significant correlation with average K (r = − 0.047, p = 0.691), corneal diameter (r = 0.125, p = 0.293),
CCT (− 0.132, p = 0.262) and cylindrical power (− 0.155, p = 0.183). Additionally, nerve tortuosity was strongly
positively correlated with mean NFL (r = 0.603, p < 0.001) and mean NFD (r = 0.758, p < 0.001). Table 5 shows
that age (p < 0.001) and spherical value (p = 0.032) contributed significantly to mean tortuosity and that age
had the greatest impact (standardized coefficient B = − 0.427 and B = − 0.239, respectively). Moreover, it can be
expected that an increase by one year of age will decreases tortuosity in mean of 0.237 and that a decrease in one
unit of spherical power will increases tortuosity in mean of 0.673, when all other variables are constant.
Discussion
IVCM, is a minimally invasive method that does not require complex infrastructure and allows the visualiza-
tion of corneal nerves in clinic. Since the confocal examination became possible in the clinic, several reports
on corneal nerve fibres structure in health and disease were published showing alterations in both systemic and
ocular conditions and after corneal refractive s urgery2,6–8,10,21–23,25. Particularly the IVCM proved to be effective
in monitoring small fibres diabetic neuropathy with conventional CCM morphometry and novel imaging and
analysis techniques10,21,26.
Different studies were performed to investigate normal SBNP parameters with different confocal microscopy
devices.
Scientific Reports | (2021) 11:6076 | https://doi.org/10.1038/s41598-021-85597-5 6
Vol:.(1234567890)www.nature.com/scientificreports/
SNP parameter Variables B non standardized SD B standardized P value* Tolerance VIF
Constant 28,349.19 11,070.01 0.013
Age (years) − 61.446 14.505 − 0.447 < 0.001 0.753 1.328
K (D) − 176.681 138.564 − 0.138 0.207 0.718 1.392
NFL (µm/mm2) CD (mm) − 1030.58 539.281 − 0.215 0.060 0.660 1.516
CCT (mm) 2.466 5.415 0.044 0.650 0.885 1.129
Sph (D) − 158.433 63.866 − 0.249 0.016 0.832 1.201
Cyl (D) − 656.134 212.06 − 0.297 0.003 0.908 1.101
Constant 145.537 140.073 0.042
Age (years) − 0.467 0.184 − 0.298 0.013 0.753 1.328
K (D) − 1.407 1.753 − 0.096 0.425 0.718 1.392
NFD (no./mm2) CD (mm) 3.959 6.824 0.073 0.564 0.660 1.516
CCT (mm) − 0.101 0.069 − 0.159 0.146 0.885 1.129
Sph (D) − 2.119 0.808 − 0.292 0.011 0.832 1.201
Cyl (D) − 1.464 2.683 − 0.058 0.587 0.908 1.101
Constant − 117.051 69.774 0.048
Age (years) 0.012 0.091 0.009 0.845 0.753 1.328
K (D) 2.423 0.873 0.354 0.007 0.718 1.392
NBD (no./mm) CD (mm) 3.548 3.399 0.139 0.300 0.660 1.516
CCT(mm) 0.01 0.034 0.001 0.902 0.885 1.129
Sph (D) − 0.407 0.403 − 0.12 0.315 0.832 1.201
Cyl (D) − 3.911 1.337 − 0.332 0.005 0.908 1.101
(Constant) 57.13 48.439 0.242
Age − 0.237 0.063 − 0.427 < 0.001 0.753 1.328
K (D) − 0.375 0.606 − 0.073 0.538 0.718 1.392
TC CD (mm) − 0.393 2.36 − 0.02 0.868 0.660 1.516
CCT(mm) − 0.016 0.024 − 0.072 0.498 0.885 1.129
Sph (D) − 0.612 0.279 − 0.239 0.032 0.832 1.201
Cyl (D) − 0.673 0.928 − 0.076 0.471 0.908 1.101
Table 5. Multiple regression model—dependent variable NFL, NFD, NBD and TC*. *NFL nerve fiber
length (µm/mm2), NFD nerve fiber density (no./mm2), NBD nerve beadings density (no./mm), TC tortuosity
coefficient, K corneal curvature (D diopter), CD corneal diameter (mm), CCT corneal thickness (µm), Sph
sphere (D diopter), Cyl cylinder (D diopter). **Bold values denote statistical significance at the p-value < 0.05.
Figure 4. The SBNP fibers picture of the eye with emmetropia (A) and with a high myopia (B).
As to the NFL, the scanning confocal microscope (SSCM) studies report values that range from 6.1 ± 1.2 to
13.5 ± 0.3 mm/mm2 and those obtained with laser scanning confocal microscope (LSCM) showed the range
from 16.1 to 26.4 mm/mm2.
The normal values of NFD obtained with the SSCM ranges from 26.5 ± 7.5 to 45.6 ± 4.5 fibers/mm2. The data
related to the normal beadings frequency range from 90 ± 18 to 222 ± 43 beads/mm2 and tortuosity coefficient
from 1.09 ± 0.54 to 2.2 ± 0.95–8,11,21,22,27.
Scientific Reports | (2021) 11:6076 | https://doi.org/10.1038/s41598-021-85597-5 7
Vol.:(0123456789)www.nature.com/scientificreports/
These wide ranges of normality result from the use of different devices and adoption of different modali-
ties of analysis. The devices used in these studies were the tandem scanning, scanning slit and laser scanning
confocal microscopes28. Tandem scanning is no longer used due to its poor resolution, which provides inferior
values. The SCCM and the LSCM are currently still in use, and both provide a high quality of nerve imaging8.
However, to perform a comparative analysis of nerve characteristics in different groups, the same device must
be used to avoid erroneous interpretation1–3. Nevertheless numerous studies on normal corneal SBNP nerves
were conducted to the best of our knowledge there are no reports on the relation between SBNP morphology and
density and corneal parameters and refraction in healthy eyes. In this study we performed analysis of the SBNP
nerve parameters such as NFD, NFL, NBD, and TC in healthy subjects, aiming to investigate their relationship
with corneal parameters and refractive status of the eye. Additionally, the laterality and correlation with gender
and age were assessed.
In the present study we found negative correlations between NFL, NFD and age. Some studies have shown no
correlation between age and nerve density in healthy participants3,29. However, these studies were cross-sectional
in their character. Deghani et al., who reported NFL in mm/mm2, in their 3 year-long study, showed an effect of
age on NFL with a linear decrease of 0.05 mm/mm2 per y ear12. And Gruptcheva et al. showed a significant dif-
ference in nerves fibers density between two groups with mean ages of 25 and 7030. Tavakoli et al., in the study
on 343 healthy participants, showed a decrease in NFD of − 0.164 no./mm2 per year for man and − 0.161 no./
mm2 per year for woman and decrease in NFL of − 0.045 mm/mm2 and − 0.060 mm/mm2 per year respectively.
As in our study, they found increased tortuosity in aged corneas31.
Our results show that a decrease of 61.446 µm/mm2 can be expected with an age increase of 1 year, assuming
that all other variables in the models are held constant. Similarly, NFL decreases on average by − 158.433 µm/
mm2 for each increase in the spherical power and decreases by − 656.134 µm/mm2 when the cylindrical power
increases by one unit, when all other variables are constant.
Our results show a greater decrement of NFD (0.467 mm2/year) confirming that aging has a significant effect
on corneal nerves fibres leading to the reduction of both density and length. Batawi et al. showed a negative
correlation of NFD, NFL, and beadings with age with r = − 0.471, − 0.461, and − 0.310, respectively, while the TC
was not a ffected20. Similarly to our study, the authors found that NFL correlated with other parameters (NFD,
NBD, TI) with r > 0.52. The correlations between the assessed parameters can be explained by the nature of the
parameters. For instance, an increase in NFL and tortuosity will naturally lead to an increase in NFD; such cor-
relations can be seen as strength of the analysis.
Although we cannot fully explain the correlations between NBD, cylindrical power and total corneal power,
we hypothesize that the correlation between K and cylindrical power is an effect of the different appearance of
nerves in cylindrically shaped corneas. Alternatively, this correlation is subtle, and although statistically sig-
nificant, it does not represent a real difference. We showed that an increase of 1 D in K leads to a 2.432 no./mm
increase in NBD, and a 1-D increase in cylindrical power leads to a decrease of − 3.991 no./mm. Surprisingly,
neither CCT nor corneal diameter showed any effect on the studied parameters. The lack of correlation may be
explained by the nature of the SBNP and its location in particular part of the cornea.
Harrison et al. using the same confocal system but different software, showed a negative correlation between
myopia and nerve density but they did not perform regression analysis between other corneal parameters32. In
this study we measured spherical power and not axial length, but as Harrison et al. showed, the spherical power
is a much better predictor of SBNP density.
Finally, we found, accordingly to other reports, that there were no differences between the left and right eye
nor between genders in the IVCM parameters2,3,7–13,20,21,30,31.
So, it can be concluded that the multiple regression analysis confirmed that the age is the most significant
factor affecting SBNP nerves density, length and tortuosity. Myopic refractive error (spherical power) reduces
both the SBNP density and length and NFL, NFD, NBD and TC are not affected by gender or eye laterality. We
believe that further studies including eyes with hyperopia and small corneal diameter are necessary to evidence
furthermore the relationship between the refractive status of the eye, corneal morphology and SBNP parameters.
Data availability
Data is available from the corresponding author upon request.
Received: 28 December 2020; Accepted: 2 March 2021
References
1. Marfurt, C. F., Cox, J., Deek, S. & Dvorscak, L. Anatomy of the human corneal innervation. Exp. Eye Res. 90, 478–492 (2010).
2. Al-Aqaba, M. A., Dhillon, V. K., Mohammed, I., Said, D. G. & Dua, H. Corneal nerves in health and disease. Prog. Retin. Eye Res.
73, 100762 (2019).
3. Kokot, J. et al. Corneal confocal sub-basal nerve plexus evaluation: A review. Acta Ophthalmol. 96, 232–242 (2018).
4. Erie, J. C., McLaren, J. W. & Patel, S. V. Confocal microscopy in ophthalmology. Am. J. Ophthalmol. 148, 639–646 (2009).
5. Patel, D. V. & McGhee, C. N. Contemporary in vivo confocal microscopy of the living human cornea using white light and laser
scanning techniques: A major review. Clin. Exp. Ophthalmol. 35(1), 71–88 (2007).
6. Guthoff, R. F., Stachs, O. & Stave, J. From bench to bedside—In vivo confocal imaging on its way to a clinical decision-making
tool. Clin. Exp. Ophthalmol. 35, 1–2 (2007).
7. Cruzat, A., Qazi, Y. & Hamrah, P. In vivo confocal microscopy of corneal nerves in health and disease. Ocul. Surf. 15(1), 15–47
(2017).
8. Shaheen, B. S., Bakir, M. & Jain, S. Corneal nerves in health and disease. Surv. Ophthalmol. 59(3), 263–285 (2014).
Scientific Reports | (2021) 11:6076 | https://doi.org/10.1038/s41598-021-85597-5 8
Vol:.(1234567890)www.nature.com/scientificreports/
9. Patel, D. V. & McGhee, C. N. J. Mapping of the normal human corneal sub-basal nerve plexus by in vivo laser scanning confocal
microscopy. Investig. Ophthalmol. Vis. Sci. 46(12), 4485–4488 (2005).
10. Roszkowska, A. M. et al. Corneal nerves in diabetes. The role of the in vivo corneal confocal microscopy of the subasal nerve
plexus in the assessment of peripheral small fiber neuropathy. Surv. Ophthalmol. https: //doi.org/10.1016/j.survop hthal .2020.09.003
(2020).
11. Tavakoli, M., Petropoulos, I. N. & Malik, R. A. Assessing corneal nerve structure and function in diabetic neuropathy. Clin. Exp.
Optom. 95(3), 338–347 (2012).
12. Dehghani, C. et al. Fully automated, semiautomated, and manual morphometric analysis of corneal subbasal nerve plexus in
individuals with and without diabetes. Cornea 33(7), 696–702 (2014).
13. Dehghani, C. et al. Morphometric stability of the corneal subbasal nerve plexus in healthy individuals: A 3-year longitudinal study
using corneal confocal microscopy. Investig. Opthalmol. Vis. Sci. 55, 3195 (2014).
14. Kalteniece, A. et al. Corneal confocal microscopy is a rapid reproducible ophthalmic technique for quantifying corneal nerve
abnormalities. PLoS ONE 12(8), e0183040 (2017).
15. Niederer, R. L., Perumal, D., Sherwin, T. & McGhee, C. N. J. Age-related differences in the normal human cornea: A laser scanning
in vivo confocal microscopy study. Br. J. Ophthalmol. 91, 1165–1169 (2007).
16. Parissi, M. et al. Standardized baseline human corneal subbasal nerve density for clinical investigations with laser-scanning in vivo
confocal microscopy. Investig. Ophthalmol. Vis. Sci. 54, 7091–7102 (2013).
17. Efron, N. et al. Repeatability of measuring corneal subbasal nerve fiber length in individuals with type 2 diabetes. Eye Contact Lens
36, 245–248 (2010).
18. Hertz, P., Bril, V. & Orszag, A. Reproducibility of in vivo corneal confocal microscopy as a novel screening test for early diabetic
sensorimotor polyneuropathy. Diabet. Med. 28(10), 1253–1260 (2011).
19. Ahmed, A. et al. Detection of diabetic sensorimotor polyneuropathy by corneal confocal microscopy in type 1 diabetes: A concur-
rent validity study. Diabetes Care 35(4), 821–828 (2012).
20. Batawi, H. et al. Sub-basal corneal nerve plexus analysis using a new software technology. Eye Contact Lens 44, S199–S205 (2018).
21. Kallinikos, P., Berhanu, M. & O’Donnell, C. Corneal nerve tortuosity in diabetic patients with neuropathy. Investig. Ophthalmol.
Vis. Sci. 45(2), 418–422 (2004).
22. Patel, D. V. & McGhee, C. N. In vivo confocal microscopy of human corneal nerves in health, in ocular and systemic disease, and
following corneal surgery: A review. Br. J. Ophthalmol. 93(7), 853–860 (2009).
23. Labetoulle, M. et al. Role of corneal nerves in ocular surface homeostasis and disease. Acta Ophthalmol. 97(2), 137–145 (2019).
24. Kim, J. & Markoulli, M. Automatic analysis of corneal nerves imaged using in vivo confocal microscopy. Clin. Exp. Optom. 101(2),
147–161 (2018).
25. Eguchi, H., Hiura, A., Nakagawa, H., Kusaka, S. & Shimomura, Y. Corneal nerve fiber structure, its role in corneal function, and
its changes in corneal diseases. Biomed Res. Int. 2017, 3242649 (2017).
26. Ziegler, D. et al. Spatial analysis improves the detection of early corneal nerve fiber loss in patients with recently diagnosed type
2 diabetes. PLoS ONE 12(3), e0173832 (2017).
27. Erie, J. C., McLaren, J. W. & Patel, S. V. Confocal microscopy in ophthalmology. Am. J. Ophthalmol. 148(5), 639–646 (2009).
28. Erie, E. A. et al. Corneal subbasal nerve density: A comparison of two confocal microscopes. Eye Contact Lens 34, 322–325 (2008).
29. Gambato, C. et al. Aging and corneal layers: An in vivo corneal confocal microscopy study. Graefe’s Arch. Clin. Exp. Ophthalmol.
253, 267–275 (2015).
30. Grupcheva, C. N., Wong, T., Riley, A. F. & McGhee, C. N. Assessing the sub-basal nerve plexus of the living healthy human cornea
by in vivo confocal microscopy. Clin. Exp. Ophthalmol. 30, 187–190 (2002).
31. Tavakoli, M. et al. Normative values for corneal nerve morphology assessed using corneal confocal microscopy: A multinational
normative data set. Diabetes Care 38(5), 838–843 (2015).
32. Harrison, W. W. et al. The corneal nerve density in the sub-basal plexus decreases with increasing myopia: A pilot study. Ophthalmic
Physiol. Opt. 37, 482–488 (2017).
Author contributions
A.M.R. performed the experiments, wrote the paper, designed the study; B.O.-W. analyzed data and designed
the study; R.S. performed the experiments; A.W. analyzed data and wrote the paper; L.I. prepared figures and
analyzed data, R.G. analyzed the data and wrote the paper; P.A. wrote the paper, supervised the process.
Competing interests
The authors declare no competing interests.
Additional information
Correspondence and requests for materials should be addressed to A.M.R.
Reprints and permissions information is available at www.nature.com/reprints.
Publisher’s note Springer Nature remains neutral with regard to jurisdictional claims in published maps and
institutional affiliations.
Open Access This article is licensed under a Creative Commons Attribution 4.0 International
License, which permits use, sharing, adaptation, distribution and reproduction in any medium or
format, as long as you give appropriate credit to the original author(s) and the source, provide a link to the
Creative Commons licence, and indicate if changes were made. The images or other third party material in this
article are included in the article’s Creative Commons licence, unless indicated otherwise in a credit line to the
material. If material is not included in the article’s Creative Commons licence and your intended use is not
permitted by statutory regulation or exceeds the permitted use, you will need to obtain permission directly from
the copyright holder. To view a copy of this licence, visit http://creativecommons.org/licenses/by/4.0/.
© The Author(s) 2021
Scientific Reports | (2021) 11:6076 | https://doi.org/10.1038/s41598-021-85597-5 9
Vol.:(0123456789)You can also read