Comment on Gjestland, T. A Systematic Review of the Basis for WHO's New Recommendation for Limiting Aircraft Noise Annoyance. Int. J. Env. Res ...
←
→
Page content transcription
If your browser does not render page correctly, please read the page content below
International Journal of
           Environmental Research
           and Public Health

Comment
Comment on Gjestland, T. A Systematic Review of
the Basis for WHO’s New Recommendation for
Limiting Aircraft Noise Annoyance. Int. J. Env. Res.
Pub. Health 2018, 15, 2717
Rainer Guski 1, *, Dirk Schreckenberg 2 , Rudolf Schuemer 3 , Mark Brink 4,†
and Stephen A. Stansfeld 5,†
 1    Ruhr-University Bochum, Psychology Department, 44801 Bochum, Germany
 2    ZEUS GmbH, Zentrum für Angewandte Psychologie, Umwelt- und Sozialforschung, Sennbrink 46,
      58093 Hagen, Germany; schreckenberg@zeusgmbh.de
 3    Independent Researcher, 58095 Hagen, Germany; ar-schuemer@t-online.de
 4    Federal Office for the Environment, 3003 Bern, Switzerland; Mark.Brink@bafu.admin.ch
 5    Centre for Psychiatry, Wolfson Institute of Preventive Medicine, Barts and the London School of Medicine,
      Queen Mary University of London, London EC1M 6BQ, UK; s.a.stansfeld@qmul.ac.uk
 *    Correspondence: rainer.guski@ruhr-uni-bochum.de
 †    Mark Brink and Stephen A. Stansfeld were both members of the Guideline Development Group (GDG)
      appointed by the WHO Regional Office for Europe who published the new WHO Environmental Noise
      Guidelines for the European Region.

 Received: 11 February 2019; Accepted: 18 March 2019; Published: 27 March 2019

 Abstract: In his recent discussion paper in this journal, Truls Gjestland attempts a “systematic review”,
 as he calls it, of the evidence base for aircraft noise annoyance, consolidated in a meta-analysis by
 Guski et al. that informed the recommended guideline value of 45 dB Lden in the recently published
 World Health Organization (WHO) Environmental Noise Guidelines. He questions the validity of
 the presented evidence, as “some of the referenced studies have not been conducted according to
 standardized methods, and the selection of respondents is not representative of the general airport
 population.” Gjestland maintains that the new WHO Guidelines are based on a questionable selection
 of existing aircraft noise studies. Our reply comments on the arguments of Gjestland and refutes
 most of his critique.

1. On the Selection of Original Studies
      On page 2, Gjestland [1] comments on the inclusion/exclusion of studies in the systematic review
by Guski et al. [2] (carrried out for the WHO Environmental Noise Guidelines for the European
Region [3]) as follows: “For the three excluded studies the authors could not find a regression function that they
could use to estimate % HA [Highly Annoyed].” For carrying out the meta-analysis, we asked all authors
of identified original studies to provide equations or parameter estimates of their exposure–response
relationships. Indeed, the authors of three studies did not provide the requested information, and these
studies were thus excluded from the calculation of a common exposure–response function.
      In the next paragraph, Gjestland goes on with “One of these studies [Gjestland omits giving a
reference] comprises surveys at two different airports, but Guski et al. only considered one of them for
reasons unknown.” If the study of Gelderblom et al. [4] is meant here, the two surveys in that study
in fact took place at two different airports, Trondheim and Bodo. The latter is a combined civil and
military airport, which we judged not to be comparable with the rest of the airports selected for the
meta-analysis (which so far contained only civil airports). Gjestland continues: “It is interesting to note

Int. J. Environ. Res. Public Health 2019, 16, 1088; doi:10.3390/ijerph16071088      www.mdpi.com/journal/ijerph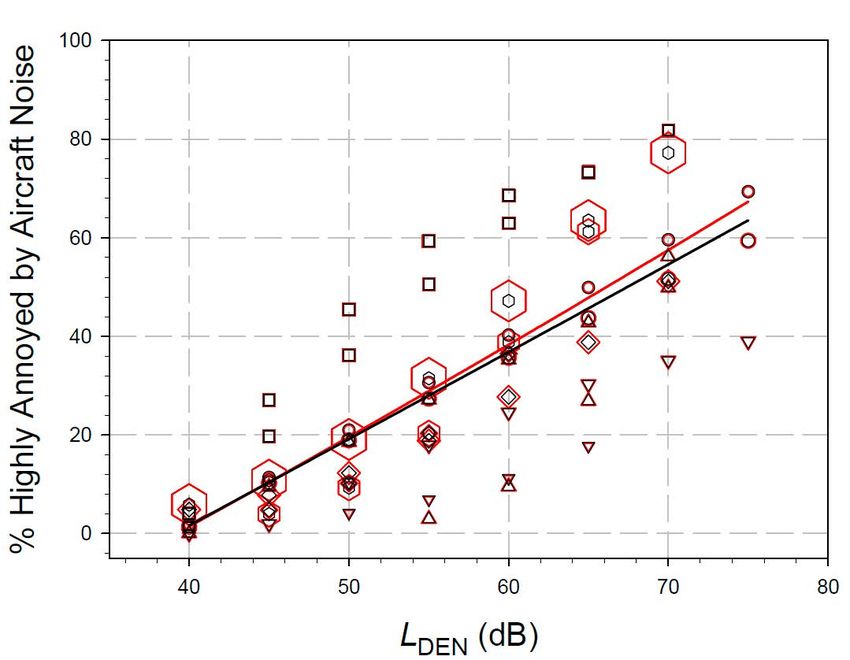
Int. J. Environ. Res. Public Health 2019, 16, 1088                                                         2 of 6

that results from previous similar surveys at both of these airports which were excluded, were included
in the analysis by Miedema & Vos for their well-known EU reference curve.” Yes, this is an astonishing
fact, given that the perception of military aircraft noise is probably difficult to describe in terms of Leq ,
because military airports are characterized by relatively few overflights and usually very high noise
levels per event. For us, this was reason enough to exclude studies involving military aircraft noise
(see Section 2.2 in our systematic review).

2. On Non-Acoustic Factors
      Later in his paper, Gjestland writes: “A procedure based on combining all responses from different
surveys in this manner represents [a] simple way of analyzing data from aircraft noise annoyance
surveys. It ignores the fact that only about one third of the variance in the response data is explained by
the cumulative noise exposure . . . and it effectively prohibits any possibility of studying the influence
of non-acoustic factors . . . .” We reject both allegations as nonsensical. First, of course, a whole range
of variables, besides Lden , are contributing to individual annoyance judgments. This is mentioned
in chapter 3.1.7. In the same chapter, it is explained that our review does not handle individual
(within-study) variability, it does handle between study characteristics, such as study quality rating,
survey type, noise level range, response rate, and rate of airport change. Second, why does our way of
analyzing secondary data “effectively prohibit any possibility of studying the influence of non-acoustic
factors”? This is nonsense, proposing a common exposure–response curve does not prohibit anything.
      On page 3, Gjestland writes “The WHO Guideline Development Group also seems to be ignorant
about the importance of non-acoustic factors. In the Guidelines publication it is stated that ‘in noise
annoyance studies non-acoustic factors may explain up to 33% of the variance’. This must be a
misunderstanding. The correct statement should be that acoustic factors (or rather Lden -based factors)
may explain up to 33% of the variance, while the other two-thirds are explained by non-acoustic
factors.” Gjestland is wrong here: acoustic factors (or rather Lden -based factors) may explain up to 33%
of the variance, while the other two-thirds are variance induced by non-acoustic factors (another 33%)
and (another 33%) remaining non-explained (error) variance.
      Later on, on page 4, Gjestland suspects that the aircraft accident at Milano Linate two years before
the HYENA (HYpertension and Exposure to Noise near Airports) survey took place, might have left
marks on residents around Malpensa airport and increased their annoyance: “High fear of accidents has
been found to shift the annoyance response equivalent to as much as 20 dB in the exposure.” Today, the scientific
evidence for this effect is rather scarce or just anecdotal. Gjestland quotes work from the late 1990s,
and most of the more recent studies do not include “fear of accidents” questions. It seems that this
variable has lost its importance for affecting annoyance responses. However, even if it would be an
important predictor, the accident at Linate airport could have affected annoyance responses at other
airports (beyond Malpensa) as well and could have also affected responses many years later. Basically,
the temporal or spatial range of the effect of an accident at one airport on responses at another airport
is unknown.

3. On Age Effects on Annoyance
     At the end of page 3 in his paper, Gjestland sets about to criticize the inclusion of the HYENA
study [5] in our meta-analysis. He starts with the observation that the HYENA study included
respondents aged 45–70 years only. He then mentions the van Gerven et al. [6] review, which reported
a nonlinear relation in the form of an inverted “U” between age and annoyance, and draws the
conclusion that the HYENA sample may be biased towards higher annoyance compared to samples
aged 20–80. Indeed, the van Gerven paper shows quite drastic effects of age on annoyance. However,
other more recent studies do not or report only small effects. For instance, the NORAH (Noise Related
Annoyance, Cognition and Health) study reports a very weak nonlinear effect of age (eta-square
between 0.01 and 0.03, see Schreckenberg et al. [7], figure A-20). Brink et al. [8] found no significant
effects of age and age squared on aircraft noise annoyance in a fully adjusted exposure–response model.
Int. J. Environ. Res. Public Health 2019, 16, 1088 3 of 6
This said, we do not see why the exclusion of respondents younger than 45 years in the HYENA
sub-studies should qualify these sub-studies to be excluded from our meta-analysis.
Gjestland then writes: “Guski et al. are aware that this fact has most certainly contributed to an
increase in annoyance in the HYENA study, but still they choose to include the data in violation of
their own selection criteria (‘member of the general population’)”. If Gjestland means “representative
of the general population”, this was not an inclusion criterion, and of course persons aged 45 and more
are still members of the general population.
4. On Low-Rate Change and High-Rate-Change Airports (Studies)
On page 4, Gjestland writes: “someone that has endured a noisy construction period of perhaps 3
to 4 years and then suddenly has been exposed to unfamiliar aircraft noise for two years, cannot be
considered a typical airport neighbor.” We agree that the construction and implementation of a new
airport is a rare and noisy event, and one of the major components defining a “high rate change airport”.
However, is there any civil airport which does not carry out construction work regularly? Also, is there
any common definition of a “representative European airport”? Is there any widely shared definition
of a “typical airport neighbor”? We believe the answer is “No” to all of these questions.
Gjestland mentions the exclusion of the Athens and Milan airports from the pooled
exposure–annoyance curve in the Babisch et al. [5] paper: “They [Babisch et al.] discuss several reasons
for this and conclude that the data from these two airports are not representative for airports in general.”
Should we thus have excluded the Athens and Milan sub-studies from our meta-analysis? Babisch
et al. [5] do not conclude that the data from these two airports are not representative for airports in
general. Rather, they wrote (p. 1175): “The airport-specific annoyance curves gave some indication that
the very high annoyance scoring of the Athens and Milan sample could have been due to an overshooting of
annoyance reporting (over-reaction) because of recent changes in airport operations” . . . “Furthermore, based on
the assessment of noise sensitivity, there was some indication that a certain degree of selection bias (more noise
sensitive subjects in more aircraft noise exposed areas) might have been present in the Milan sample. We therefore
excluded these two airports from the pooled analyses.” We included both airports because we wanted to
include all studies that met our inclusion criteria. This led to a share of 63% study participants in
high-rate change (HRC) conditions, which was discussed in Sections 3.1.4 and 3.1.8 in (see [2] main
text), and in (see [2] supplementary materials, sections S4, S10, and S13). We did indeed not exclude
any study based on a speculation about the presence of selection bias.
5. On the Effect of Weighting Studies for Pooling Evidence
Gjestland criticized the weighting of studies according to study size in our meta-analysis. At first
sight, he seems to be right that weighting can induce bias instead of reducing it and that, for example,
the quite large Amsterdam–Schiphol study (N = 5873, cp. [9]) had a large and therefore disproportionate
influence on the final common exposure–response function. However, if one wants to estimate
a common effect size with the highest precision and validity possible, one would weight studies
according to study quality. In view of our goal to estimate a reliable mean effect size from a set of
studies differing in effect size and sample size, we decided to weight studies according to sample size,
which is a very common procedure in systematic reviews. It should be noted that we weighted the
studies according to the square root of sample size. This procedure is a non-linear form of weighting
which reduces the impact of the absolute sample size at larger sample sizes. The overall effect of this
weighting approach is thus less “dramatic” than initially feared. In fact, the influence of sample size
weighting on the WHO aircraft noise dataset is relatively small, as can be seen in Figure 1.Int. J.J. Environ.
Int. Environ. Res. Public Health 2019, 16, 1088
x FOR PEER REVIEW 44 of 66
Figure 1. Exposure–response
Figure 1. Exposure–response curves for aircraft noise annoyance responses in the WHO dataset [2].
“Highly
“Highlyannoyed”
annoyed” refers
refersto
torespondents using≥≥73%
respondentsusing 73% ofof the
the annoyance
annoyance response
response scale.
scale. The
The red
red data
data
points
points and
and regression
regressionline linerefer
referto
to study
study size
size weighting
weighting according
accordingto
to sample
sample size;
size; the
the black
black data
data points
points
and
and curve
curve refer
refer to
to the
the same
same dataset
dataset without
withoutstudy
studysize
sizeweighting.
weighting.
6. OnInthe
Figure 1 itthe
Use of can be observed
Community that below
Tolerance dB Lden
50 (CTL)
Level there is no relevant difference between
Approach
the two curves. That is, the WHO Guideline Development Group’s conclusions regarding their
On page 6, Gjestland
recommendations in the WHOproposes the use of Noise
Environmental exposure–response curves
Guidelines would notbased on the
have been CTL approach.
different if study
One of the assumptions of the CTL approach
size weighting were omitted in the meta-analysis. is that the sigmoidal form and the slope of the exposure–
annoyance relationship are fixed (cp. [10]). In other words, the CTL approach assumes that the form
6.
andOnslope
the Use of the
of the Community Tolerance
exposure–response Level
function (CTL) Approach
is identical for all airports. This is contrary to our
experience. For instance, if we put the individual exposure–response curves of each of the studies in
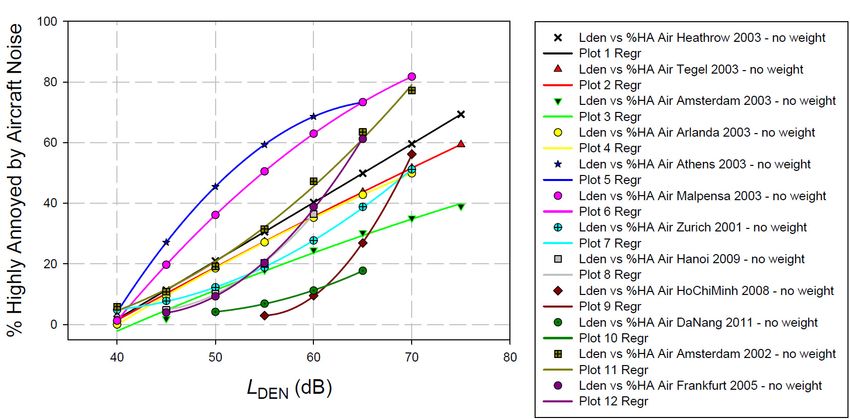
On page 6, Gjestland proposes the use of exposure–response curves based on the CTL approach.
the full WHO aircraft noise annoyance dataset into one plot, we observe a multitude of different
One of the assumptions of the CTL approach is that the sigmoidal form and the slope of the
shapes (see Figure 2).
exposure–annoyance relationship are fixed (cp. [10]). In other words, the CTL approach assumes that
In view of such differences between exposure–response curves from different annoyance studies
the form and slope of the exposure–response function is identical for all airports. This is contrary to
(usually, as here, confounded with airports), it is very doubtful if a common curve can be derived at
our experience. For instance, if we put the individual exposure–response curves of each of the studies
all. Taking into account the multitude of different exposure–response curves (and their shapes), we
in the full WHO aircraft noise annoyance dataset into one plot, we observe a multitude of different
do not see any indication that the application of the CTL method would allow for a more reliable
shapes (see Figure 2).
common exposure–response curve, even if the selection of studies would have been performed
In view of such differences between exposure–response curves from different annoyance studies
according to a more rigid protocol than has been done in Gjestland’s paper. Moreover, the derivation
(usually, as here, confounded with airports), it is very doubtful if a common curve can be derived at all.
of a generalized exposure–response curve based on the CTL method cannot be recommended.
Taking into account the multitude of different exposure–response curves (and their shapes), we do not
see any indication that the application of the CTL method would allow for a more reliable common
exposure–response curve, even if the selection of studies would have been performed according to a
more rigid protocol than has been done in Gjestland’s paper. Moreover, the derivation of a generalized
exposure–response curve based on the CTL method cannot be recommended.Int. J. Environ. Res. Public Health 2019, 16, 1088 5 of 6
Int. J. Environ. Res. Public Health 2019, 16, x FOR PEER REVIEW 5 of 6
Figure
Figure 2. 2. Individual
Individual exposure–response
exposure–response curves
curves for for aircraft
aircraft noisenoise annoyance
annoyance responses
responses in 12
in the the 12
studies
of the full WHO dataset [2]. % Highly Annoyed (%HA) refers to respondents using ≥73% ofofthe
studies of the full WHO dataset [2]. % Highly Annoyed (%HA) refers to respondents using ≥73%
the annoyance
annoyance response
response scalescale
(same(same definition
definition as Figure
as in in Figure1).1).
No No weightingaccording
weighting according to
to sample
sample size
size is
is applied
applied here. here.
7. 7.
Conclusions
Conclusions
InIn
this
thisreply,
reply,we wesubstantiated
substantiatedour our decisions regardingthe
decisions regarding theinclusion
inclusionororexclusion
exclusion of of studies
studies in in
our systematic
our systematicreview
reviewon on aircraft noiseannoyance
aircraft noise annoyance[2]. [2].
We We demonstrated
demonstrated thatthat the common
the common practice
practice of
of weighting
weightingstudies
studiesaccording
accordingtotosample
samplesizesizehas
hasnonounwanted
unwanted side
side effects, and
effects, andthat
thatthethe
central
central
assumption
assumption ofofthe
theCTL
CTLapproach
approachcontradicts
contradicts empirical
empirical evidence:
evidence:the theform
formofofthe exposure–response
the exposure–response
relation
relation is is
notnotfixed,
fixed,ititmay
maydiffer
differfrom
from one
one study
study toto another.
another.All Allininall,
all,weweconclude
conclude that there
that were
there were
no specific flaws, faults, or inaccuracies in the analysis of the available evidence
no specific flaws, faults, or inaccuracies in the analysis of the available evidence in the bespoke in the bespoke
systematic
systematic review.We
review. Weare areconvinced
convincedthatthat the
the WHO
WHO Guideline
GuidelineDevelopment
DevelopmentGroup Group did
didnotnot
come
cometo to
false conclusions and that their recommended guideline value for aircraft noise is
false conclusions and that their recommended guideline value for aircraft noise is not unjustifiably low. not unjustifiably
low.
Author
Author Contributions:For
Contributions: Forthe
theconceptualization,
conceptualization,all
allauthors;
authors; methodology: R.G., R.S.
methodology: Rainer andRudolf
Guski, M.B.; writing—original
Schuemer and
draft preparation, R.G.; writing—review and editing, all authors; visualization, R.G.
Mark Brink; writing—original draft preparation, Rainer Guski; writing—review and editing, all authors;
Funding: The preparation
visualization, of this comment received no external funding.
Rainer Guski.
Conflicts of Interest: The authors declare no conflict of interest.
Funding: The preparation of this comment received no external funding.
Conflicts of Interest: The authors declare no conflict of interest.
References
1. References
Gjestland, T. A Systematic Review of the Basis for WHO’s New Recommendation for Limiting Aircraft Noise
Annoyance. Int. J. Environ. Res. Pub. Health 2018, 15, 2717. [CrossRef] [PubMed]
2. 1. Guski,
Gjestland, T. A Systematic
R.; Schreckenberg, D.; Review
Schuemer,of the Basis forWHO
R. Review: WHO’s New Recommendation
Environmental for Limiting
Noise Guidelines for theAircraft
European
Noise Annoyance. Int. J. Environ. Res. Pub. Health 2018, 15, 2717, doi:10.3390/ijerph15122717.
Region: A Systematic Review on Environmental Noise and Annoyance. Int. J. Environ. Res. Pub. Health 2017,
2. Guski, R.; Schreckenberg, D.; Schuemer, R. Review: WHO Environmental Noise Guidelines for the
14, 1539. [CrossRef]
European Region: A Systematic Review on Environmental Noise and Annoyance. Int. J. Environ. Res. Pub.
3. World-Health-Organization-Europe. Environmental Noise Guidelines for the European Region;
Health 2017, 14, 1539, doi:10.3390/ijerph14121539.
World-Health-Organization-Europe: Copenhagen, Denmark, 2018; Available online: http://www.
3. World-Health-Organization-Europe. Environmental Noise Guidelines for the European Region; World-Health-
euro.who.int/en/health-topics/environment-and-health/noise/publications/2018/environmental-noise-
Organization-Europe: Copenhagen, Denmark, 2018. Available Online:
guidelines-for-the-european-region-2018 (accessed on 25 March 2019).
http://www.euro.who.int/en/health-topics/environment-and-health/noise/publications/2018/
4. Gelderblom, F.B.; Gjestland, T.T.; Granoien, I.L.N.; Taraldsen, G. The Impact of Civil Versus Military Aircraft
environmental-noise-guidelines-for-the-european-region-2018 (accessed on 25 March 2019).
4. Noise on Noise F.B.;
Gelderblom, Annoyance. In Proceedings
Gjestland, of the
T.T.; Granoien, INTER-NOISE
I.L.N.; Taraldsen, and NOISE-CON
G. The Impact ofCongress and Conference,
Civil Versus Military
Melbourne, Australia, 16–19 November 2014; AUS: Melbourne, Australia, 16–19 November
Aircraft Noise on Noise Annoyance. In Proceedings of the INTER-NOISE and NOISE-CON Congress 2014. and
5. Babisch, W.; Melbourne,
Conference, Houthuijs,Australia,
D.; Pershagen, G.; Cadum,
16–19 November E.; Katsouyanni,
2014; AUS: K.; Velonakis,
Melbourne, Australia, M.; Dudley,
16–19 November M.L.;
2014.
Marohn, H.D.; Swart, W.; Breugelmans, O.; et al. Annoyance due to aircraft noise has increased over the
years—Results of the HYENA study. Environ. Int. 2009, 35, 1169–1176. [CrossRef] [PubMed]Int. J. Environ. Res. Public Health 2019, 16, 1088 6 of 6
6. Van Gerven, P.W.M.; Vos, H.; Van Boxtel, M.; Janssen, S.; Miedema, H. Annoyance from environmental noise
across the lifespan. J. Acoust. Soc. Am. 2009, 126, 187–194. [CrossRef]
7. Schreckenberg, D.; Faulbaum, F.; Guski, R.; Ninke, L.; Peschel, C.; Spilski, J.; Wothge, J. Endbericht, Band
3: Wirkungen von Verkehrslärm auf die Belästigung und Lebensqualität. In Verkehrslärmwirkungen im
Flughafenumfeld; Umwelthaus gGmbH: Kelsterbach, Germany, 2015; Available online: https://www.norah-
studie.de/de/publikationen.html (accessed on 25 March 2019).
8. Brink, M.; Schäffer, B.; Vienneau, D.; Foraster, M.; Pieren, R.; Eze, I.C.; Cajochen, C.; Probst-Hensch, N.;
Röösli, M.; Wunderli, J.-M. A survey on exposure-response relationships for road, rail, and aircraft noise
annoyance: Differences between continuous and intermittent noise. Environ. Int. 2019, 125, 277–290.
[CrossRef] [PubMed]
9. Breugelmans, O.R.P.; van Wiechen, C.M.; van Kamp, I.; Heisterkamp, S.H.; Houthuijs, D. Gezondheid
en beleving van de omgevingskwaliteit in de regio Schiphol: 2002-Tussenrapportage Monitoring
Gezondheidskundige Evaluatie Schiphol. In Health and Quality of Life Near Amsterdam Schiphol Airport:
2002; Interim Report; RIVM: Bilthoven, The Netherlands, 2004.
10. Fidell, S. A Modern Standardized Method for Predicting Community Response to Aircraft Noise.
Civ. Eng. Archit. 2018, 6, 71–77. [CrossRef]
© 2019 by the authors. Licensee MDPI, Basel, Switzerland. This article is an open access
article distributed under the terms and conditions of the Creative Commons Attribution
(CC BY) license (http://creativecommons.org/licenses/by/4.0/).You can also read